Every company needs help in identifying opportunities for direct material cost reduction. For a product, there can be several alternative bills of materials (Alt BOMs), which can have varied costs based on market conditions. In standard SAP, there is no report to identify the lowest cost BOM; the system may be using a high cost BOM when a lower cost alternative exists.
This article will explain an approach for developing a tool to find the lowest cost Alt BOM based on current cost, which can be used for production and help reduce direct material cost, a critical issue for companies facing current high inflation rates. You can analyze the historic and going forward analysis of the available Alt BOMs.
(For background on BOM creation, costing configuration, and costing variant, please see the Appendix below).
This article will help you develop a tool for Production comparison and Lowest Cost Alt BOM comparison.
For simplicity, Costing Variant PPC3 will be used (refer to
Figure 1).
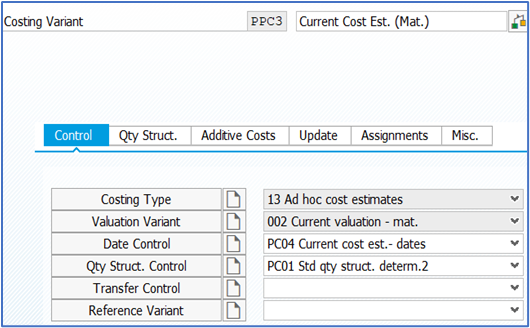 Figure 1 - Costing Variant
Production Comparison
Figure 1 - Costing Variant
Production Comparison
In this scenario, production has already occurred. Using the data for the already produced material, you can compare the cost of produced material during a given time frame against the available lowest cost Alt BOMs and highlight any cost differences. Thus, you can analyze the historic data if the lowest cost Alt BOM was used or not.
Selection screen can have Plant, Finished Goods Material, Costing Variant, and Production period. Output in SAP List Viewer (ALV) will always give enough flexibility to analyze the data.
A. You can begin by looking at process orders, manufacturing orders, and production orders for plant/material combination in the selected time frame (depending on type of order you use).
Main Production Order Tables can be used to get all Order Item data.
AUFK - Order master data
AFKO - Order header data PP orders
AFPO - Order item
By joining AUFK and AFPO on field AUFNR, you can get Order Header from PP Production Order.
B. Obtain all Alt BOMs for plant material combinations you found above.
Report output can look like
Figure 2. Different companies may have different requirements.
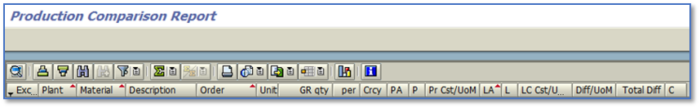 Figure 2 - Layout of Production Comparison
Lowest Cost BOM Comparison
Figure 2 - Layout of Production Comparison
Lowest Cost BOM Comparison
In this scenario, production has not happened, but you have multiple Alt BOMs available, and a going-forward analysis can be done on existing Alt BOMs for material/plant combinations with detail at the component level identifying the lowest cost Alt BOM and any costing issues.
Report output can look like
Figure 3. Again, different companies may have different requirements.
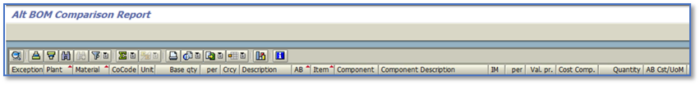 Figure 3 - Layout of Alt BOM Comparison
Cost Determination Steps (for both options)
Figure 3 - Layout of Alt BOM Comparison
Cost Determination Steps (for both options)
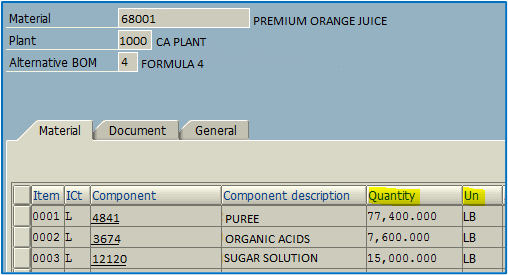 Figure 4 - Display Material BOM: General Item Overview
1) We will refer to a simple example of BOM from
Figure 4 as we go along.
2) Get Alt BOM items/components using BOM item table while ignoring the inactive BOMs. Inactive BOMs and raw materials can be filtered based on your company standards.
3) Further, you may want to have additional filters; e.g., BOM uses a material/subcomponent with no movement type in the last year. To have the latest raw material information, you can check the relevant movement types like 101 within a certain number of days using MSEG (Document Segment: Material).
4) Cost Alt BOMs using the standard Function module; e.g., CK_F_MATERIAL_VALUATE. If you need to display specific information regarding costing configuration, you can use KKEK_TCK_TABLES_READ. Refer to
Figure 5. This gets all the configurations for costing variant.
a. Costing each Alt BOM can take time.
b. Based on your configuration, there are short cuts you can make using custom code; e.g., Standard function module (FM) will take account of costing sheet, routings, etc. If your costing model is simpler, you can have something that runs faster.
5) However, there is a risk that this may diverge from future costing results if configuration is changed. The business decides to add burden to the material using a costing sheet. You may want to create a costing variant that may have slightly different rules.
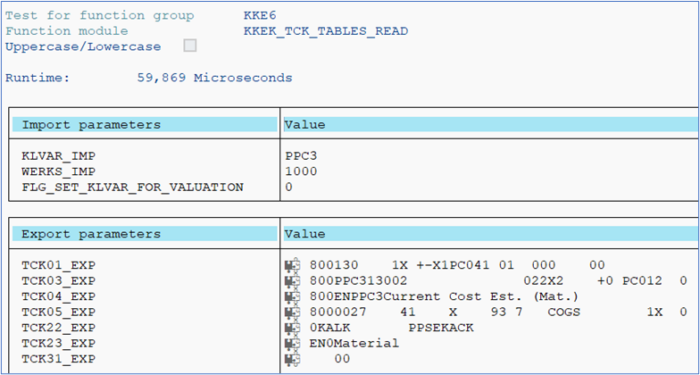 Figure 5 - KKEK_TCK_TABLES_READ
6) You need to take into account pricing qty (MBEW-PEINH) and different units of measure (UoM) in Alt BOM vs. Material Master (MARA & MBEW). Different Alt BOM may use different UoM. So, make sure you standardize when you do comparisons. Useful FM-> MD_CONVERT_MATERIAL_UNIT.
7) Now let’s see how the calculation works.
Figure 5 shows the Alternate BOM for “Premium Orange Juice” that has three subcomponents, as shown in
Figure 4 and
Figures 6-8.
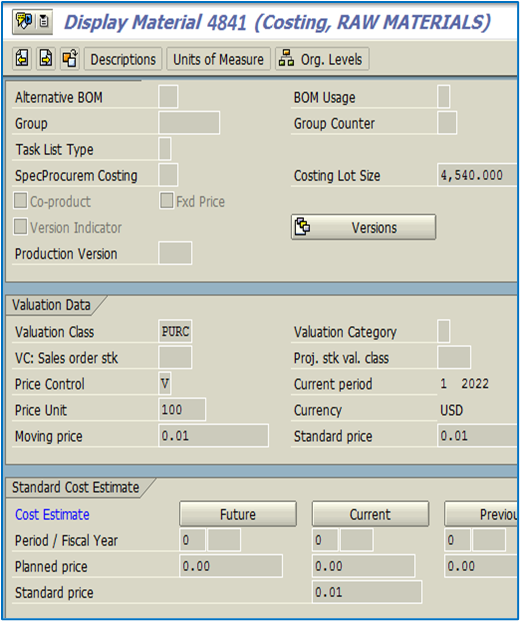 Figure 6 - Material Display
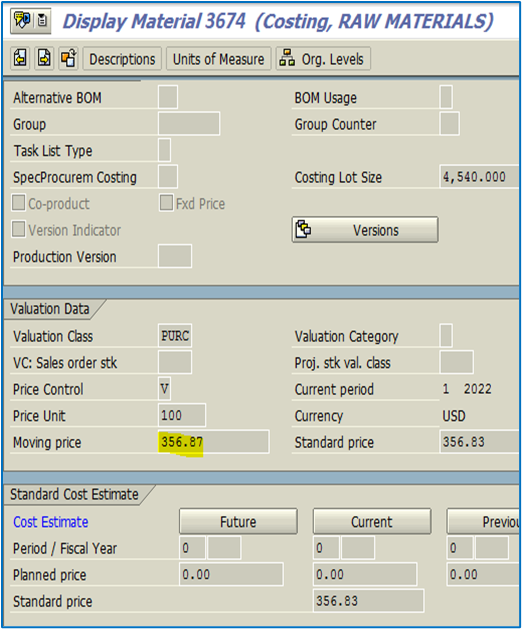 Figure 7 - Material Display
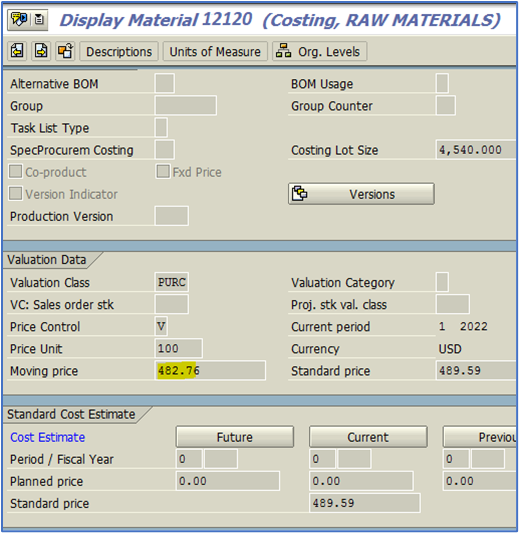 Figure 8 - Material Display
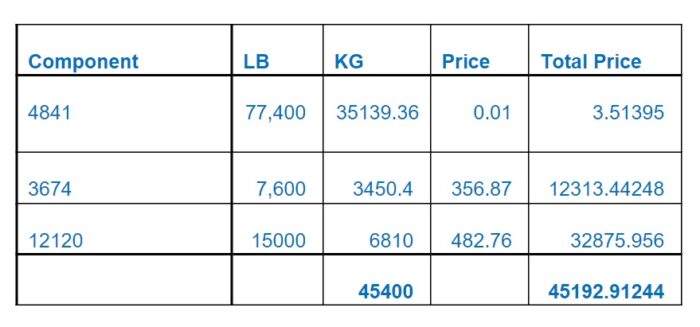 Cost/UoM = 45192.91244*100/45400 = 99.54
The above calculation is done by finding and calculating the values at the table level and using standard function modules.
8) CK11N using PPC3 will also show the same amount as in Figure 9, which is the same as in step 7. Step 7 results came as part of the tool development.
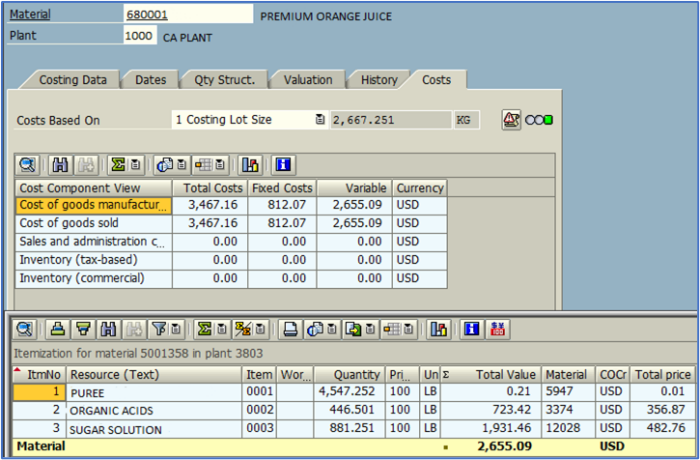 Figure 9 - Material Cost Estimate
Cost/UoM = 2655.09*100/2667.251 = 99.54
Figure 9 - Material Cost Estimate
Cost/UoM = 2655.09*100/2667.251 = 99.54
9) ALV Output from step 7 will provide information that can be analyzed to do the following:
-Sort the report in ascending order of lowest cost available for all Alt BOMs.
-Find the cost difference between lowest available cost Alt BOM and production order created.
-Look at different raw materials and different suppliers in the market that may be available at a cheaper price.
-Create Production version using C223 and assign the lowest Alt BOM.
-The tool can provide an opportunity to clean up the old or bad data.
Above is a simplified costing example. It doesn’t have a costing sheet or routing. More tables will be involved when considering a costing sheet and routing.
SAP doesn’t provide any report to find the lowest cost Alt BOM. If a tool were to be developed where you can find the cost of all available Alt BOMs and can use it in production based on the lowest cost BOM, there could be potential savings in the process.
Appendix
Alt BOM Creation:
Alt BOM creation is the same as regular BOM using CS01. There are many SAP menu paths to create, change, and display BOM; e.g.:
SAP Menu->Logistics->Production->Master Data->Bills of Material->Bill of Material->Material BOM->Create
SAP Menu->Logistics->Sales and Distribution->Master Data->Products->Bills of Material->Bill of Material->Material BOM->Create
SAP Menu->Logistics->Materials Management->Foreign Trade/Customs->General Foreign Trade Processing->Environment->Material BOM->Create
Menu Path examples:
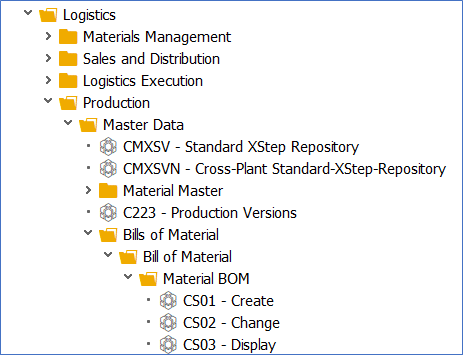 Figure 10 - SPRO Menu Path for Material BOM under Production
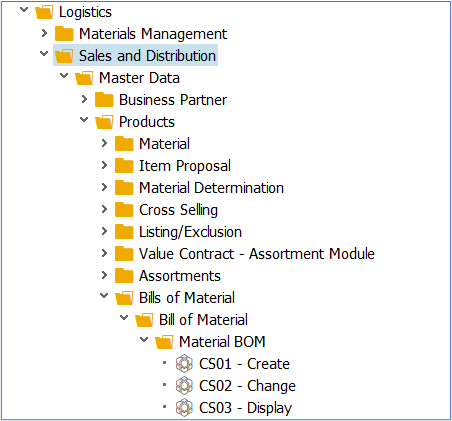 Figure 11 - SPRO Menu Path for Material BOM under Sales and Distribution
Using CS01, create a BOM and then create again using same Material, plant, and BOM usage. System will show warning message “Alternative * added to BOM” while creating more BOMs for same material.
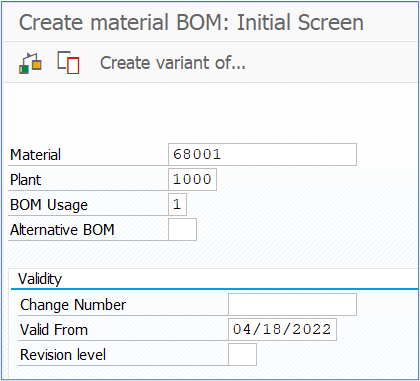 Figure 12 - Create Material BOM
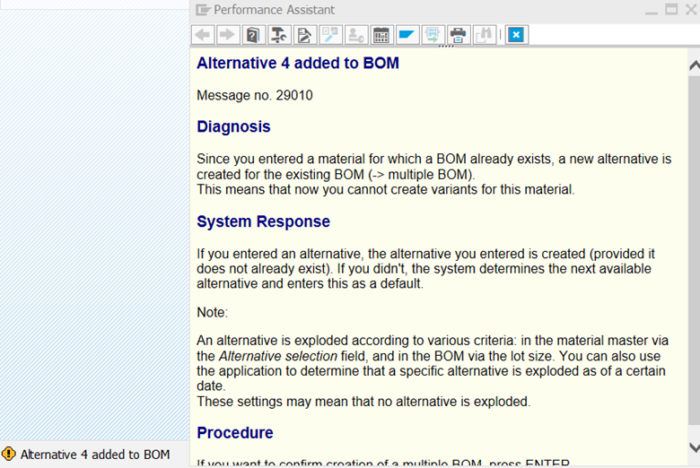 Figure 13 - Create Material BOM Warning Message
Once all the BOMs are created, CS06 gives the overview of all Alt BOMs available within a group.
Displaying an Alternative Overview:
The alternative overview lists all BOMs that exist for the multiple BOMs (Material/Plant/Usage )
In CS03, enter material, plant, and usage and the alternative view will display showing all the Alt BOMs. In the example below, there are four Alt BOMs.
Select the alternatives for which you want to display the data. Double click the line or click on Item overview icon.
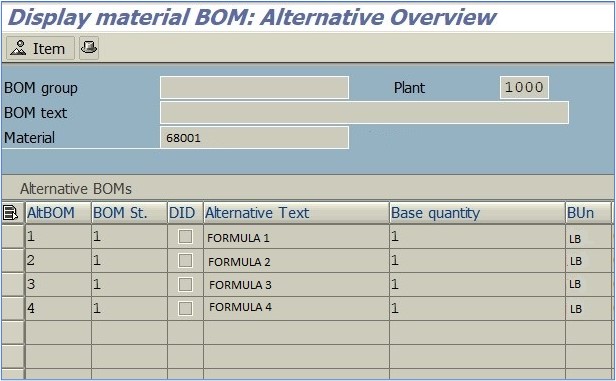 Figure 14 - Overview of Alternative BOM
Costing Variant
Figure 14 - Overview of Alternative BOM
Costing Variant:
Costing variants contain a set of controlled parameters for costing. Prices and activities can be determined based on what variant was selected.
Execute Tcode OKKN or SAP Menu:
Controlling > Internal Orders > Planning > Manual Planning > Define Cost Variant
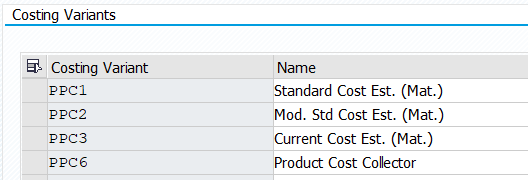 Figure 15 - Costing Variant
Most companies use Standard Cost estimate for material at the beginning of a fiscal year, which becomes valid for the rest of the year. Choosing costing variant and the time to run is entirely up to each company.