Rakesh Kalahasthi explains how to overcome a limitation in developing geographical charts in SAP Lumira by pulling data from SAP Business Warehouse (SAP BW) powered by SAP HANA.
Key Concept
All InfoCubes and DataStore objects (DSOs) can be accessed in SAP HANA as native SAP HANA models by importing them into the SAP HANA database through SAP HANA studio.
Consider a scenario in which a company wants to view user-violation data to see how violations are distributed in cities or countries across the globe. The graphical data enables the company to analyze the types of risks and then mitigate them. To do so, the company can use geographical visualization on top of SAP Lumira by pulling SAP GRC data into SAP Business Warehouse (SAP BW) powered by SAP HANA.
SAP Lumira provides different visualizations that you can build with just a few clicks. SAP Lumira also combines multiple data sources and can handle large volumes of data without sacrificing performance. I describe this scenario in the following stages:
- Review the approach using SAP Lumira
- Import the SAP BW-optimized GRC InfoCubes to SAP HANA through SAP HANA studio
- Access GRC InfoCubes in the SAP Lumira visualization/discovery/dashboard tool
An Overview of the Approach Using SAP Lumira
In this section I provide you with an overview using SAP Lumira for my example scenario. I explain the pain points you face if you don’t use this approach, the purpose for choosing this approach, and the prerequisites to set it up.
Pain Points of Not Using this Approach
SAP Lumira is a discovery tool that runs as a background process on the instance of Intelligent Query (IQ), formerly known as Sybase IQ. IQ uses column store and compression for years based on different indexing types, which increases the speed of aggregation of analytical data. When you are visualizing data through SAP Lumira on SAP BW powered by SAP HANA, the geographical charts are not available due to the limitations of SAP BW. These limitations would stop the analysis of user-violation data on a geo-based chart that might lead to untimely decisions.
The Purpose for Choosing this Approach
In my example scenario, the company wants to build a geographic-chart-based visualization dashboard on top of SAP BW models in SAP Lumira. However, when it tries, as shown in Figure 1, there is a limitation. You can’t find the Geo Bubble Chart when accessing the queries or InfoProviders of SAP BW directly through SAP Lumira. Therefore, the company needs to import the SAP BW data models as native SAP HANA models (calculation/analytical views). It then needs to access the views by connecting to SAP HANA through SAP Lumira so that it can view the geographic charts in SAP Lumira for the same models. You access Figure 1 by going to an SAP BW query directly from SAP Lumira.

Figure 1
Geographical charts do not appear when SAP BW queries are accessed directly through SAP Lumira
To import the SAP BW-optimized GRC InfoCubes into the SAP HANA system, you need to complete these steps:
- Implement SAP Notes 1703061, 1759172, 1752384, 1733519, 1769374, and 1790333 on your SAP BW powered by SAP HANA system
- Upgrade your SAP HANA modeler to SAP HANA 1.0 Support Package 5 revision 58 or above
- Add an SAP BW schema to the SQL privileges for the modeler user to import models
- Ensure that the _SYS_REPO user has SELECT with GRANT privileges on the schema that contains the SAP BW tables
Import the SAP BW-Optimized GRC InfoCubes to SAP HANA through SAP HANA Studio
I now explain the steps to import SAP BW-optimized GRC InfoCubes as native SAP HANA models.
Step 1. Connect to SAP BW powered by SAP HANA by entering the system details as part of a new connection. In SAP HANA studio click the SAP HANA Modeler option and then under the Content heading, click Import. This action opens the Import pop-up screen (Figure 2) in which you can enter the Connection details for the new connection. Create a new connection and enter all the relevant parameters related to the desired source system by providing details such as Server Name, Host Name, Instance Number, Client Number, User Name, and Password. Click the Next button to connect to the source system. Then click the Next button again.
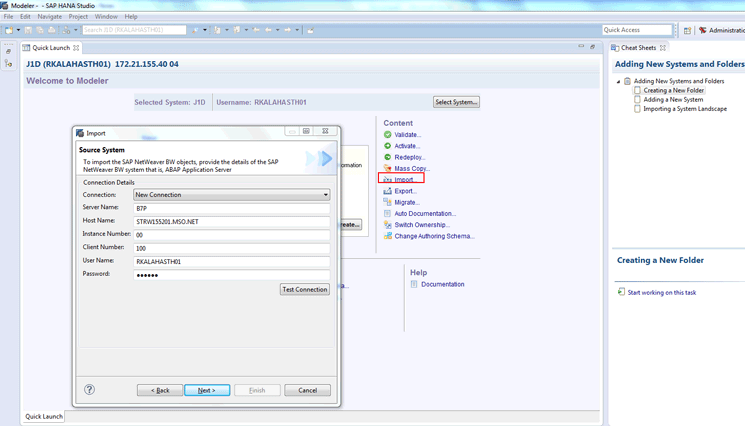
Figure 2
Provide the appropriate details to import data models by creating a new connection
Step 2. After connecting to the source system, select the specific target SAP HANA system as required from the available systems as shown in Figure 3. Click the Next button to go to Figure 4.

Figure 3
Access the required SAP HANA system
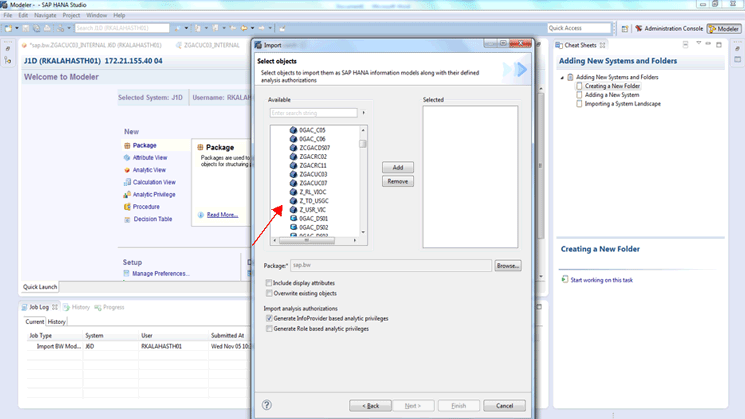
Figure 4
Select the optimized InfoCubes
Step 3. Select the respective SAP BW-optimized GRC InfoCubes that were built in the SAP BW system from the list shown in Figure 4. Click the models in the left box one by one, then click the Add button to import the selected cubes into SAP HANA. The optimized GRC InfoCubes shown in Figure 4 were directly pulled from the SAP BW system.
Step 4. Select the objects that are required to be imported as native SAP HANA models. The selected models are on the right side of the pop-up screen in Figure 5. Now select the package to group the objects that are selected above for importing to SAP HANA. (A package in SAP HANA is for grouping related components.) To do that, click the Browse button to open a browse window with all the available SAP-defined packages. Go to the respective package available in the standard packages SAP has provided. Select the sap_bw package and then click OK to close the browse window. Also select the Generate InfoProvider based analytic privileges check box to get the necessary authorizations if any are defined the BW system for the GRC InfoCubes shown in Figure 5. Click the Finish button when you are done with the Browse button.

Figure 5
Add the selected optimized GRC InfoCubes and map them to an SAP BW package
Step 5. Once you click the Finish button the job executes automatically. When the job is completed you can check its status in the Job Log (Figure 6). The Job Log tab appears on the right side of the screen with an initial status of running (not shown). Then it changes to either Completed or Completed with warnings. Ignore the warnings as they are just general.
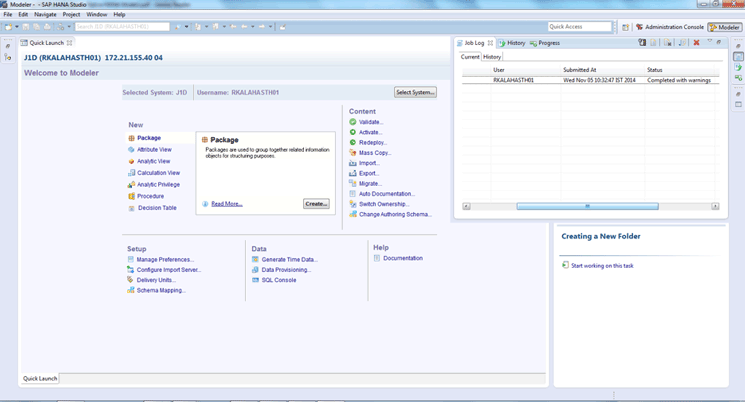
Figure 6
Status of the job
Step 6. Once you’ve reviewed the status, click the Modeler button on the right top corner of Figure 6, which takes you to Figure 7. Navigate to the specific package on the left side where the imported data models are available in the SAP HANA modeler. In Figure 7 expand the sap node and then click the bw option. Now you can see that the imported SAP GRC BW models are available as SAP HANA native models in the packages under both Analytic Views and Calculation Views (in the left pane of Figure 7).
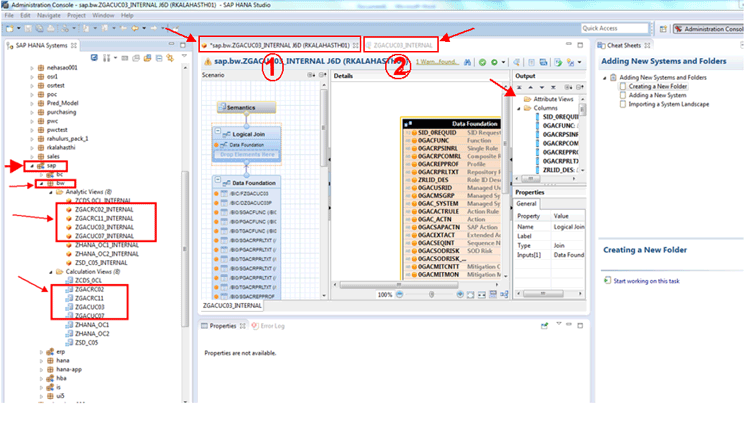
Figure 7
The SAP HANA modeler view of the specific models
Step 7. Go to SAP HANA Systems on the left side and select sap > bw (Figure 7). Select the analytic views that are enclosed in the red square in Figure 7 and double-click them. The screen then displays two tabs at the top of the screen: SAP.bwZGACUC03_INTERNAL J6D (RKALAHASTH01) and ZGACUC03_INTERNAL (numbered in Figure 7 as 1 and 2, respectively). Figure 7 is how the screen appears when the first tab is selected. When you click the second tab the screen looks like the one shown in Figure 8.
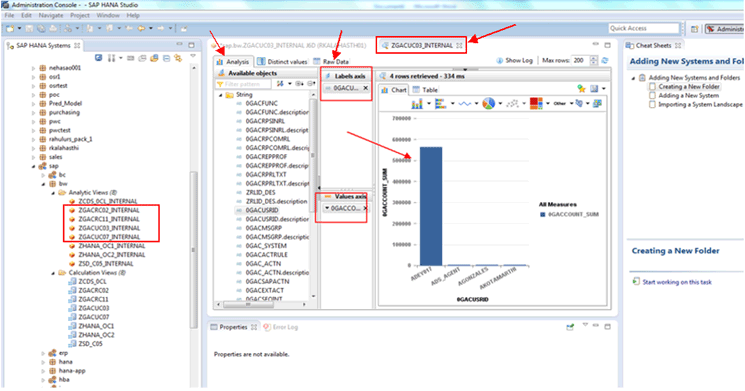
Figure 8
Analysis view in a column chart with selected labels and values
In Figure 8, click the Analysis tab and select the available objects and drag them to the Labels axis and Values axis sections shown on the right side of Figure 8. In Figure 8 you see the data in a chart view. The Analysis view itself has some chart capability, so you can view a chart by clicking the Chart tab. Also you can check whether the data is available in the Analytic views by clicking the Raw Data tab highlighted with arrow on the right side of Figure 8.
Access GRC InfoCubes in the SAP Lumira Visualization/Discovery/Dashboard Tool
Now I explain how to connect to SAP HANA native models using SAP Lumira.
Step 1. Open SAP Lumira. Go to File > New and a New Dataset pop-up window opens as shown in Figure 9. Click the Connect to SAP HANA option and then click the Next button to open Figure 10.
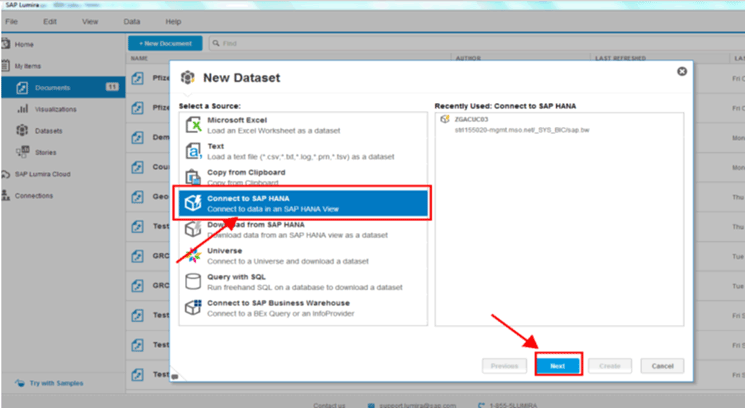
Figure 9
Connect to SAP HANA
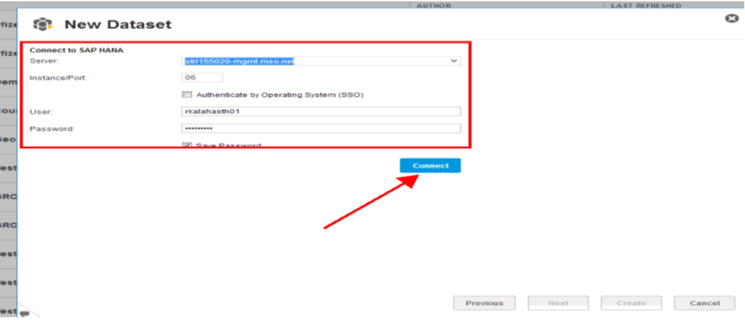
Figure 10
Pass on the SAP HANA system credentials
Step 2. Enter the SAP HANA server credentials in Figure 10. Click the Connect button to connect to the SAP HANA system, which takes you to Figure 11.
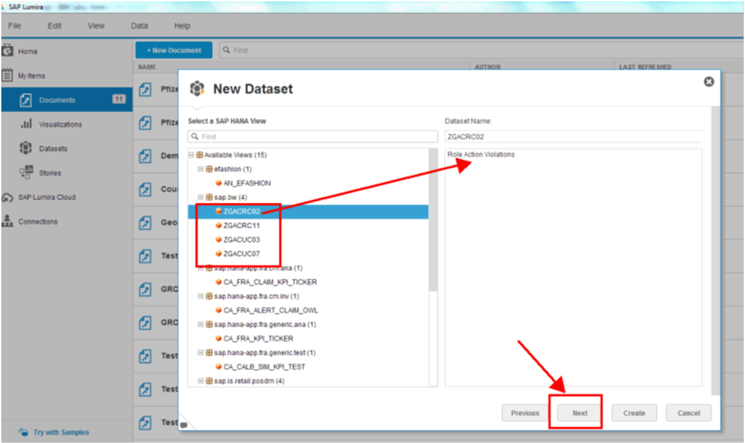
Figure 11
Add the selected SAP HANA views
Step 3. Select the required SAP HANA View from the highlighted analytical views in Figure 11. (These are same as the SAP BW models that were imported to SAP HANA.) The system automatically picks the Dataset Name on the right side. Click the Next button to display the screen shown in Figure 12 in which you can select the measures and dimensions.
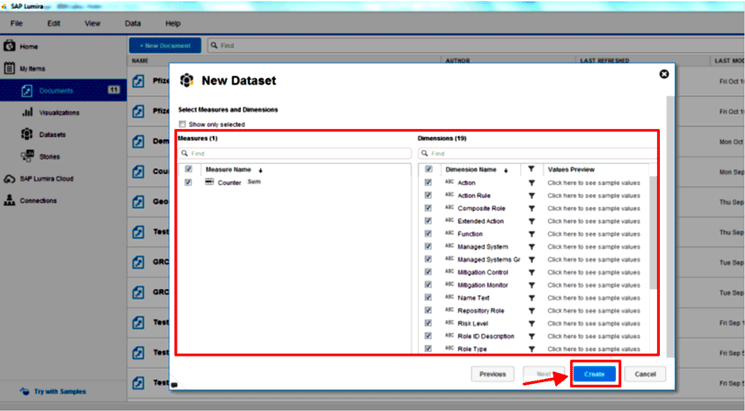
Figure 12
Pick the required objects for the new dataset
Step 4. In Figure 12 you have the option to select all the required measures and dimensions by clicking the appropriate check boxes available in the Measures and Dimensions sections. After you make your selections, click the Create button.
Step 5. After you click the Create button in Figure 12 to create the new dataset, you are taken to the dashboard development screen of SAP Lumira. This screen has different tabs, such as Prepare, Visualize, Compose, and Share (Figure 13). Click the Visualize tab and you see that the geographical charts component is enabled (pointed out by the arrow). This approach of importing the SAP BW models as SAP HANA native models enables the geographical charts component on the component bar (highlighted in Figure 13 with an arrow). It includes components such as charts and tables.
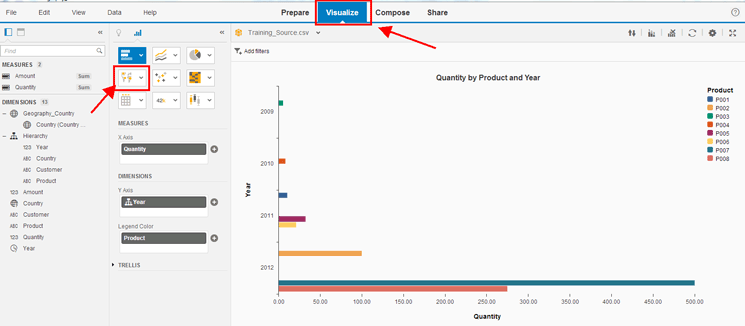
Figure 13
The geographical charts component option is added to the Visualize tab
Step 6. Create a dashboard that displays a counter (Number of) by country and Segregation of Duties (SOD) risk in a Geo Bubble Chart. Click the geo bubble chart icon (Figure 14) to create a dashboard. You can create a geographic hierarchy with names, such as country or region, based on the data you have in the GRC InfoCubes. Drag Country from the selection area on the left side to the reporting area on the right side (under DIMENSIONS). Move Counter (under MEASURES) to the right side. To show the Geo Bubble Chart with multiple colors drag another dimension (i.e., SOD Risk) into the Color field. You find the number of counters by country with different SOD risk differentiators based on colors shown in the maps on the far right.
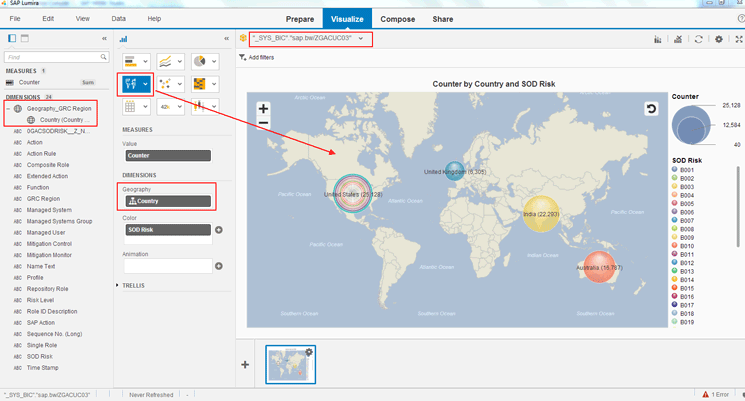
Figure 14
View the Geo Bubble Chart to look at the number of SOD risks in different countries

Rakesh Kalahasthi
Rakesh Kalahasthi is a project manager with PwC SDC in Bangalore, India. He holds two master’s degrees in technology (M.Tech [Mechanical Engineering] and M.Tech [Computer Science Engineering]) and has worked with companies such as Deloitte, BearingPoint, and Infosys. Rakesh has more than 13-plus years of experience with 11-plus years in different SAP projects focused on the SAP BW/SAP NetWeaver BW/SAP BusinessObjects BI/SAP HANA implementations. He has deep expertise in extraction, modeling, and reporting in the Financials and logistics modules. Rakesh has been involved in multiple end-to-end BW/BI implementations encompassing analysis, design, development, configuration, implementation, and maintenance, and support projects spanning across the manufacturing, retail, pharmaceuticals, automotive, banking, and utilities industries. He has led multiple BI teams across projects ensuring quality and on-time deliverables.
You may contact the author at rakeshtej@gmail.com.
If you have comments about this article or publication, or would like to submit an article idea, please contact the editor.


