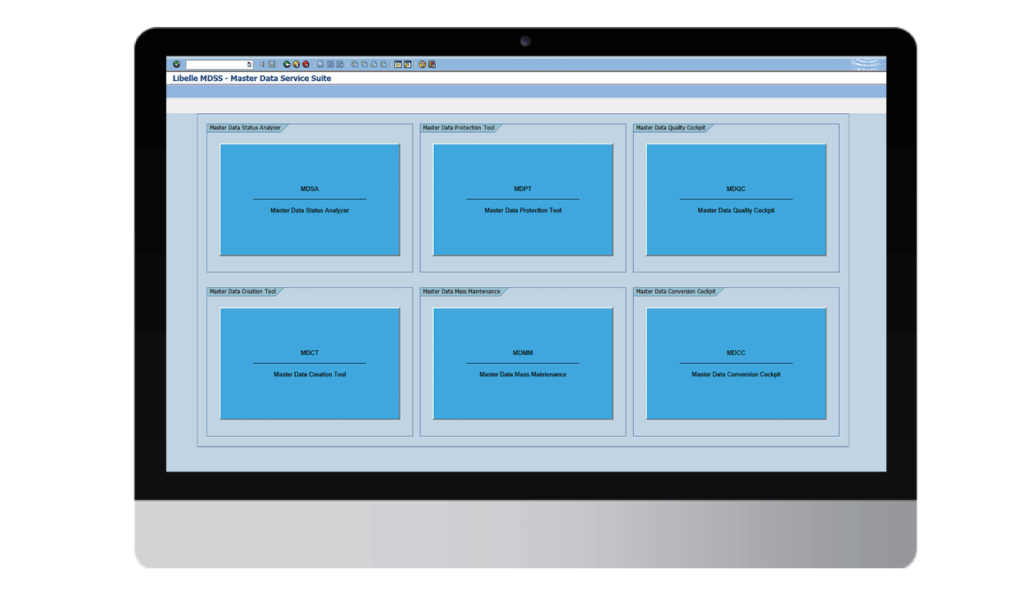
See how to use Customizing Scout, which is part of SAP Solution Manager’s Customizing Synchronization suite. This functionality enables you to compare functional IMG configuration between two systems. These systems must be connected in Solution Manager and should be configured with the necessary authorizations. It is useful especially when manual activity is involved in a comparison of the synchronization, distribution of configuration, and master data differences between two systems.
Key Concept
Many project or business scenarios require a comparison of two SAP systems’ functional configuration. Executing this comparison manually may be difficult, error prone, and time consuming. To achieve this goal of a functional comparison, you can use SAP Solution Manager’s Scout comparison functionality. Scout comparison is part of the Customizing Distribution & Customizing Scout feature of Solution Manager.
In many situations, you need to compare two systems’ configurations. They include:
- Differences in development and production IMG configuration in the same landscape
- Differences in IMG configuration in the support and project landscapes
- Differences in IMG configuration among different production systems during consolidations or migrations
In an implementation project that has support and project landscapes with a common production system, you need to know the differences in IMG configuration of the development systems of both landscapes so that they remain synchronized. This scenario is like a manual retrofit of configuration differences among the systems. This is critical if you do not have SAP Solution Manager Change Request Management (ChaRM) or if you are implementing ChaRM.
ChaRM has a retrofit feature and it allows disciplined transports among the landscapes so that they remain synchronized. In some large and especially complex landscapes (based on regions or business functions), ChaRM functionality may not be rolled out to the entire landscape. In such cases, use of Scout comparison is important to keep the landscape synchronized.
In a business acquisition, there is a need to understand the differences as well as similarities in the configuration of the acquired and existing landscape for the final consolidated version. For the systems consolidation project, you need to know the scope of functional configuration differences so that the appropriate scope definition, consolidation approach, risks, and timeline can be planned.
In an SAP S/4HANA migration analysis, Scout comparison can help you to know the extent of configuration differences and the efforts needed for system synchronization or system cleaning. This information helps you to make a lean approach for synchronized configuration of the existing landscape that will undergo migration.
In an SAP S/4HANA migration (e.g., an instance consolidation option such as an SAP Central Finance implementation), post go-live, the SAP ERP Central Component (ECC) production as well as the consolidated single SAP S/4HANA production instance are operational. In this case, before go-live, one-time configuration data and master data from all ECC production instances are uploaded in a single SAP S/4HANA landscape. Post go-live real-time replication of transaction data happens between ECC production and SAP S/4HANA production using SAP Landscape Transformation (SLT).
The journey of consolidating configuration data is a critical one for this sidecar approach of an SAP S/4HANA migration. The configuration data is first downloaded from all source ECC production systems in Excel sheets either using SAP Business Configuration Sets (BC Sets) or via download programs. These Excel sheets are cleansed manually for the entries that are required for migration. Then the required data is uploaded in an SAP S/4HANA sandbox or development system using some automated scripting. This data is further transported from the SAP S/4HANA sandbox or development system to the SAP S/4HANA production instance.
There are two levels of data reconciliation checks in this case. One is from consolidated Excel to SAP S/4HANA sandbox or development, and the second level is between SAP S/4HANA sandbox or development to its own production instance. To ensure that SAP S/4HANA systems (i.e., SAP S/4HANA sandbox or development versus SAP S/4HANA production) are in sync, relying just on transport requests may not be enough. It may result in uncertain behavior during go-live and post-production support. In this case using the Scout comparison functionality will help with a fast, automated, error-free, and accurate check of differences, if any.
Based on the differences of IMG configurations of the required systems, important decisions regarding consolidation, migration, or system cleanup can be taken. The extent of the differences helps in understanding the effort involved in ensuring synchronization of the two systems.
Note
Configuration Validation (ConfigVal) is a reporting functionality of Solution Manager. This functionality focuses on a multiple variety of reports on technical configuration of the SAP landscape, which is connected to the Solution Manager system. These reports fall in multiple categories, including transports, software patches, SAP Notes, operating system, kernel, database, hardware, software, and security. A variety of projects requires these technical reports. To know the different use scenarios and step-by-step use guidelines, refer to the
SAP Professional Journal article by Sapna Modi titled “
Configuration Validation Reporting Made Easy.”
SAP NetWeaver Transactions Codes SCMP and SCU0 and Solution Manager Scout Functionality
You can use a few SAP NetWeaver transaction codes such as SCMP and SCU0 for a comparison of SAP system functional IMG configurations. To execute these transaction codes, you have to be in one of the systems that is part of the comparison.
SAP Solution Manager offers Customizing Scout functionality, which facilitates this SAP system functional configuration comparison among the SAP landscapes connected to it. This flexibility not only allows for a comparison but also facilitates the distribution functionality to synchronize the setup of the two systems, both of which are harmonized on configuration. That means the configuration fields ID mapping between the two systems is the same for the same fields. In un-harmonized systems, this ID mapping may not be the same and requires an integration server in between. This is not the case in Scout distribution. Scout distribution does direct synchronization and distribution between the source and target systems.
SAP Solution Manager SCOUT Comparison Functionality Details
Solution Manager is a mandatory product in the SAP landscape due to its maintenance planner functionality. With the necessary setup of Remote Function Calls (RFCs) and the required authorizations, you can leverage the Scout comparison functionality.
There are different ways of doing comparisons in Scout functionality. I focus on using the synchronization group for IMG comparison. This is the easiest way for SAP functional experts to use the Scout feature due to the IMG structure-based selection of configuration comparison. In general, functional users are comfortable dealing with the SPRO transaction IMG tree structure.
There are multiple ways of populating a synchronization group – inserting IMG objects from a source system, inserting IMG objects from a target system, inserting customizing objects from a target system, and inserting synchronization objects from an SAP system component. Among these types, the option of IMG objects is user friendly. The last option of inserting synchronization objects leads to faster processing time. This is due to its comparatively greater level of detail (added directly in a synchronization group at the time of its creation). It requires knowledge of the technical names of the objects. The IMG tree is based on functionality so selecting values from IMG nodes is user-friendly. All these options are explained later.
Once the synchronization group is created, it is used for comparison and analysis of results. The Scout distribution functionality is used for distributing the differences of configuration and/or masters from the source system to the target system (which are homogenous in nature on configuration).
Synchronization Group
1. Execute transaction code SCDT_GROUPS in the SAP Easy Access screen as shown in Figure 1. This action displays the screen in Figure 2.

Figure 1
Enter transaction code SCDT_GROUPS in the SAP Easy Access screen
2. In Figure 2, click the create role icon to create a new synchronization group.

Figure 2
Synchronization Group Editor transaction
After you click the create role icon a pop-up screen appears in which you enter the values as shown in Figure 3.

Figure 3
The pop-up screen for creating the new Synchronization Group
Click the Load Object Lists button. This action opens another pop-up screen (Figure 4). In this screen, the data you input in the fields in the Source Reference System and Target Reference System sections, as well as the Source Component and Target Component fields, is important. In my example, both the source and target systems are ECC systems. These are the systems that are connected with the specific RFC connections (needed for Scout functionality) with the Solution Manager system, where this Scout setup is being done. It is required for Scout functionality to work and is part of the Scout setup.
3. After you click the Load Object Lists button in Figure 3, a small pop-up screen displays a message (Figure 4). The meaning of this message is that the synchronization objects from the target system are copied in the Solution Manager system. Click the enter icon (the green checkmark) to close this pop-up screen.

Figure 4
Pop-up screen of the Load Objects Lists option from the target system
4. After you close the pop-up screen in Figure 4, the Create Synchronization Group pop-up screen appears again (Figure 5). In this screen click the enter icon to create the group.

Figure 5
The Create Synchronization Group popup
5. In the next pop-up screen (Figure 6), enter the Package name and click the save icon. The custom name for the package is created with transaction SE80. The name can be anything starting with Y or Z. A package is a folder with a variety of content.

Figure 6
Enter the package name
6. The next screen is a prompt for a Workbench transport request (Figure 7). Click the enter icon. The Synchronization Group is a transportable entity across the Solution Manager landscape. To make it available for transport, you need to add it to a Workbench transport request.
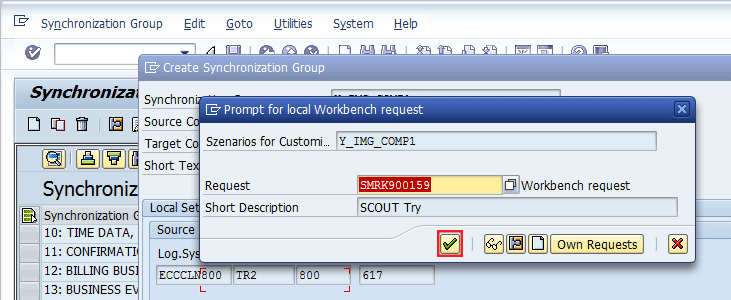
Figure 7
The pop-up screen for a Workbench transport request
7. The system now creates a synchronization group and a message appears at the bottom of the screen (not shown). Select the newly created synchronization group from the left panel. On the right panel, select the Insert Objects button and then select Add Objects from Target IMG from the drop-down list of options (Figure 8). In this drop-down list, you see multiple options for inserting objects. I cover each of these options.
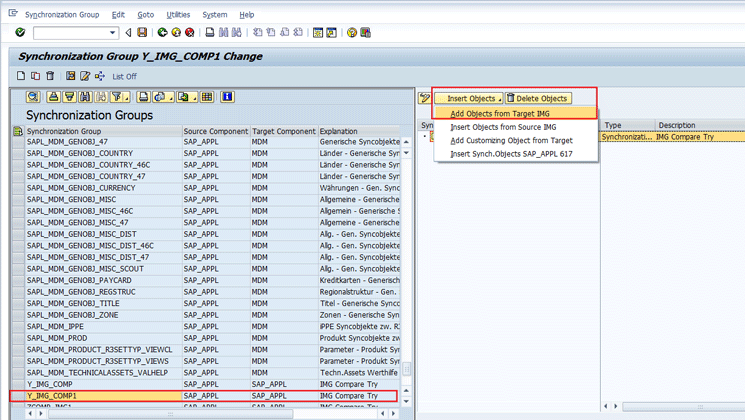
Figure 8
Synchronization group edit option to add target IMG objects
8. The IMG hierarchy of the target system appears as shown in Figure 9. Select the IMG hierarchy as per the required functional areas of comparison (e.g., the Depreciation node in this example) and click the enter icon to add them.

Figure 9
IMG Hierarchy tree from the target system
9. The selected IMG hierarchy of the target system is added back to the synchronization group in the Solution Manager system as shown on the right panel in Figure 10. Save the synchronization group by clicking the save icon.

Figure 10
10 IMG objects from the target system added back to the synchronization group
10. Now click the Insert Objects button and then select Insert Objects from Source IMG in the drop-down list shown in Figure 11. In this case, the source system is the one that was given during the creation of the synchronization group.

Figure 11
The option to insert objects
11. A pop-up screen of the IMG hierarchy for the source system opens as shown in Figure 12. Select the configuration nodes from the tree structure as required for comparison (e.g., in this case, the Pricing node is selected). Click the enter icon.

Figure 12
IMG tree structure from the source system
12. The system copies the selected IMG tree structure from the source system back into the synchronization group of the Solution Manager system as shown in Figure 13. There are already IMG nodes of the target system in the same synchronization group. The source system IMG hierarchy is added in addition to them. Click the save icon.

Figure 13
Selected source system IMG nodes are added back in the synchronization group
13. Now click the Insert Objects button and select Add Customizing Object from Target from the drop-down list shown in Figure 14 to directly add customizing objects from the target system. In this case, instead of the IMG hierarchy as seen in the above cases, the underlying customizing objects from the target system are shown for selection in the next pop-up screen.

Figure 14
Option of adding customizing objects from the target system to the synchronization group
14. The customizing objects from the target system are shown in the pop-up screen (Figure 15). This selection is generally done by SAP functional experts. You need to know or search for the exact technical term for customizing objects, whereas in the selection option of IMG nodes, the IMG nodes are categorized by functional areas and are nontechnical terms. Select the object as shown and click the enter icon to continue.

Figure 15
Customizing objects selected from the target system
15. The selected customizing object from the target system is added back into the Synchronization Group of the Solution Manager system as shown in Figure 16. There are already IMG nodes added from other options, which also appear in the right panel. This customizing object of the target system is added in addition to them. Click the save icon.

Figure 16
The customizing object of the target system is added back in the synchronization group
16. In Figure 17, click the Insert Objects button and select Insert Synch.Objects SAP_APPL 617 from the drop-down list of options.

Figure 17
The Insert Objects option with synchronization objects from SAP Application 617 Version
17. From the pop-up screen of Synchronization Objects as shown in Figure 18, select the objects for comparison. Click the enter icon.

Figure 18
The Synchronization Objects pop-up screen
18. These objects are added back in the Synchronization Group in Solution Manager system as shown in Figure 19. Click the save icon.
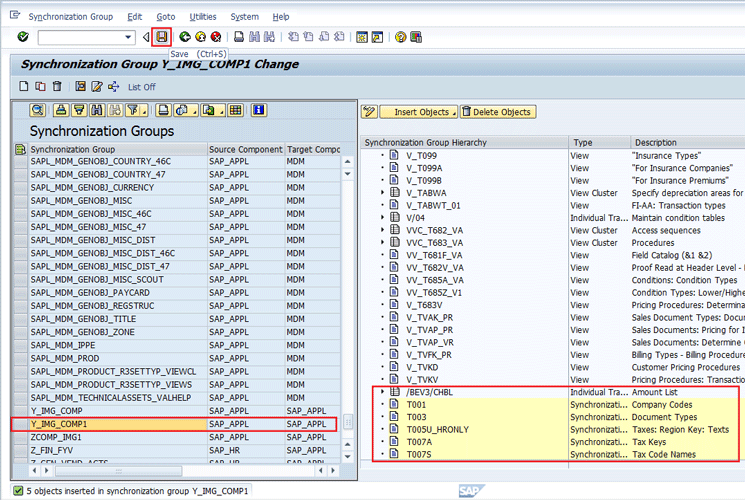
Figure 19
Synchronization objects added back in the Synchronization Group
This was the last option for inserting objects in the synchronization group. Now use this synchronization group for the configuration comparison and fetch the results.
Configuration Comparison
19. To do the comparison of configuration, execute transaction code Scout in the Solution Manager system from the SAP Easy Access screen as shown in Figure 20.

Figure 20
The Scout transaction screen
20. With Solution Manager 7.2, only three system roles can be selected from the SAP landscape, which is connected with Solution Manager. These are the system types that are used in the configuration comparison. Select the check boxes of the selection criteria you want as shown in Figure 21 and click the execute icon.

Figure 21
Select the systems you want to compare
21. Select the required target system and click the compare icon as shown in Figure 22.
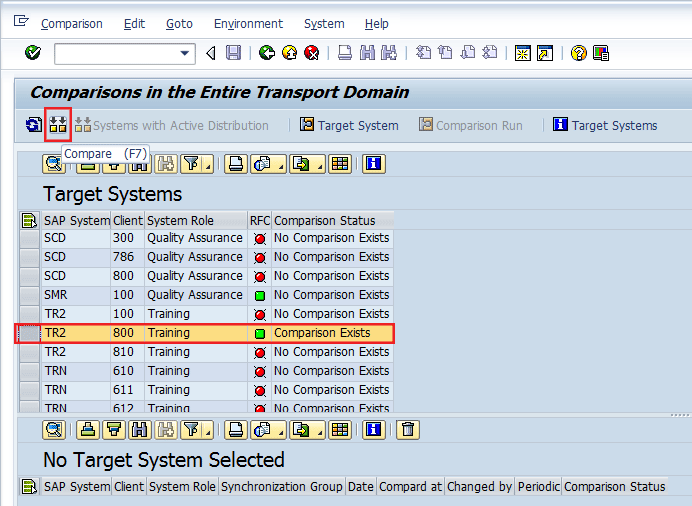
Figure 22
Select the target system
22. The next pop-up screen shows the selected target system. Enter the name of the Synchronization Group and Source System with its Source Client as shown in Figure 23. Click the enter icon to check the input values.

Figure 23
The pop-up screen for the comparison
Based on a check of the input values, the system shows a message in the status bar at the bottom of the screen as shown in Figure 24. In this case, it shows entries are OK to start the comparison. Click the online comparison icon. There is also an option for doing the comparison in the background. The background option is useful so that large and time-consuming comparisons do not use intensive resources. In this example, I use the online comparison option.

Figure 24
Start the comparison online option
23. The output is shown in the next screen (Figure 25). Click the legend icon to understand the meaning of different legends in the output screen.

Figure 25
Scout comparison output
24. The meaning of legends is explained in the next pop-up screen (Figure 26). Understand the legend values so that you can interpret the results in the output screen. Close this pop-up screen.
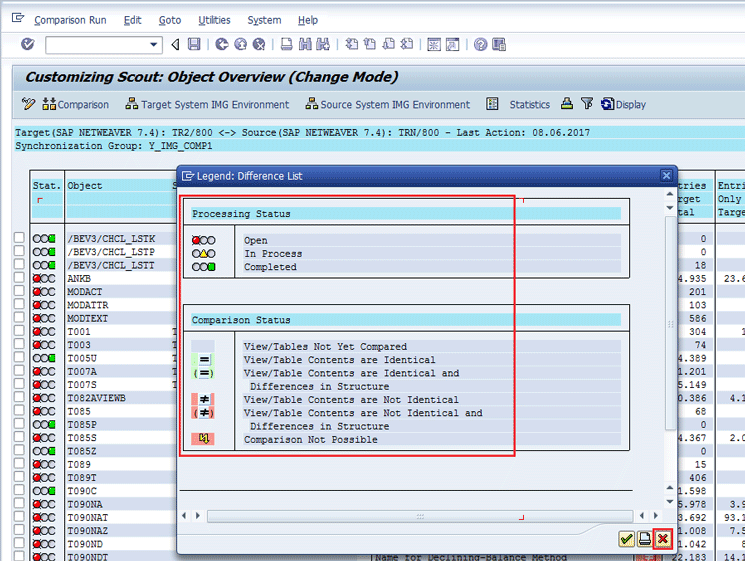
Figure 26
Comparison legend pop-up screen from the Scout output screen
25. After you close the legend pop-up screen, the Scout comparison output is shown on the screen. Select one of the result entries to get into a detailed comparison and click the comparison icon as shown in Figure 27. From the legend, it is clear that the selected record does not have identification table content for the source and target systems (as visible from the Comp. column icon).

Figure 27
Individual result record comparison option from Scout output screen
26. For a higher number of outcome lines, the system shows an information pop-up screen in tThe pop-up screen in Figure 28 shows the number of records the system would fetch online and the impact of performance (response time). This task also can delay other tasks that are waiting for CPU resources. This online fetching of records for comparison purposes is generally carried out during off-business hours to avoid any performance impact. For fetching huge records, you can use the background execution option. he section Notes on Performance as shown in Figure 28.
Note
The pop-up screen in Figure 28 shows the number of records the system would fetch online and the impact of performance (response time). This task also can delay other tasks that are waiting for CPU resources. This online fetching of records for comparison purposes is generally carried out during off-business hours to avoid any performance impact. For fetching huge records, you can use the background execution option.
Click the enter icon to go to
Figure 29.

Figure 28
Notes on the performance of the online comparison
27. In the output screen, a table with values appears as shown in Figure 29. Click the legend icon to understand on how to interpret the results.

Figure 29
Detailed output screen of the comparison
28. The pop-up screen with legend values appears as shown in Figure 30. Review the color code and ID acronyms from this legend and close it. This is the second legend in the Scout transaction. The first legend is on the first output screen of Scout as shown in Figure 26. This second legend specifically highlights the interpretation logic for the detailed output screen.

Figure 30
Explanations of legends for the detailed output screen
29. After you close the pop-up screen in Figure 30, click the Statistics button in the output screen as shown in Figure 31. This shows the summary form of the output in numbers.
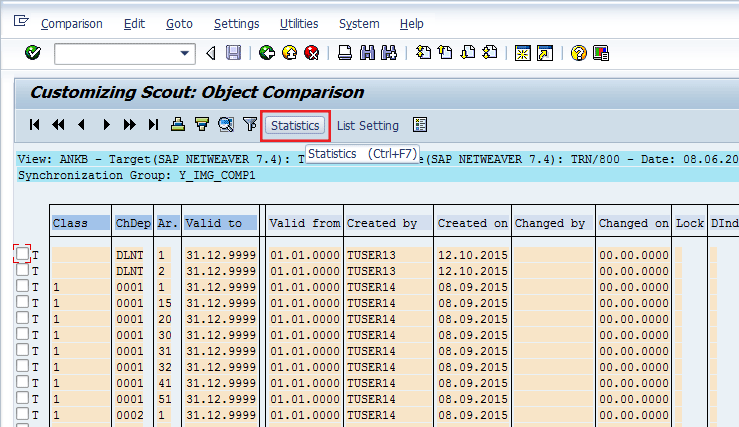
Figure 31
The Statistics option for the detailed output comparison screen
30. A values snapshot pop-up screen appears as shown in Figure 32. The numbers for different and identical values in the source and target systems are shown here. These details are for the selected record from the first output screen (Figure 27). After analyzing these counts, click the close icon.

Figure 32
Comparison statistics from the source and target entries of the selected output record
31. After you close the statistics pop-up screen, the output screen appears. By default, it shows all the values that are identical and different in the source and target. This result can be narrowed down for focused analysis. To do so, follow menu path Settings > Change Filter as shown in Figure 33. There are multiple filter values. I explain most of them.

Figure 33
Menu option to change filters
32. In the pop-up screen, change the values to see only differences in the comparison system as shown in Figure 34. Select the check boxes as shown and click the enter icon.

Figure 34
Custom filter options for viewing object comparison results
33. After you save the filter, the output screen shows only the values that match with the filter criteria as shown in Figure 35. Based on the legend, in this example, the output color changes to green rows (representing only source system values). A list of ID acronyms appears before each row in the table. Note that each row in Figure 35 is preceded by an S. This means that the entries are only in the source system.
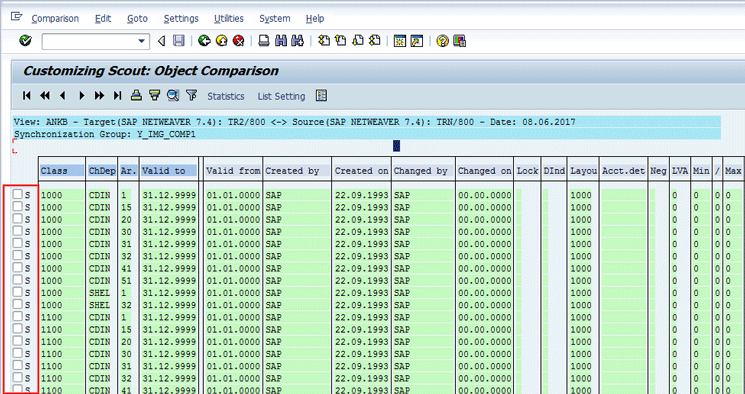
Figure 35
Detailed output screen based on custom filter criteria
34. To see the detailed analysis of the comparison, select any of the lines in the output screen as shown in Figure 36 and double-click it.

Figure 36
Select a result record for detailed analysis
35. A pop-up screen appears with detailed configuration values from the table. In this example, values present only in the source system (i.e., the comparison client) are shown (Figure 37). After analysis, click the back icon.
Note
The statistics around the overall results, as well as these individual values, are important. SAP functional experts use them for elaborate analysis on identical and different records among the systems. Based on this analysis, they can further guide the probable next steps of synchronizing the values between the two systems. They can synchronize either using the Solution Manager Scout distribution functionality to transfer the differences so that both the systems (under distribution) have same values, or synchronize the different values manually (by copying from one system to other). If the differences are not critical, they could ignore them. It also helps to know the quantum of work involved for synchronization.
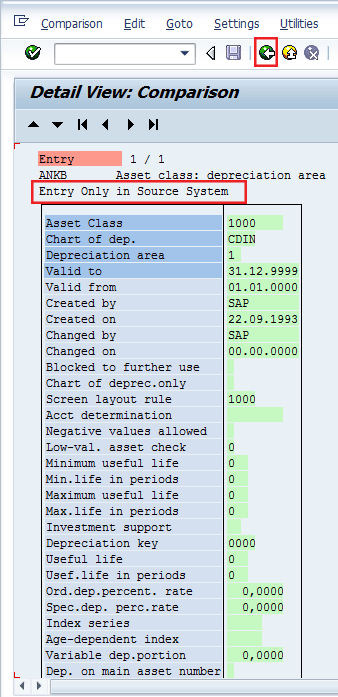
Figure 37
Individual record values from table present only in source system
36. After clicking the back icon, go to the Filter setting again as shown in Figure 33. Go to Settings > Change Filter as shown in Figure 33. Now to see only the values from the target system (the Only in Logon Client option), change the filter setting as shown in Figure 38. Click the enter icon.

Figure 38
Filter setting for target system (i.e., Logon Client values)
37. Based on the filter criteria, the output is shown in the next screen (Figure 39). Based on the legend, in this example the output color changes to light orange rows (representing only target system values). There is an ID acronym T before each row in the table, which means that the entries are only in the target system. Individual records can be further selected and studied in depth.
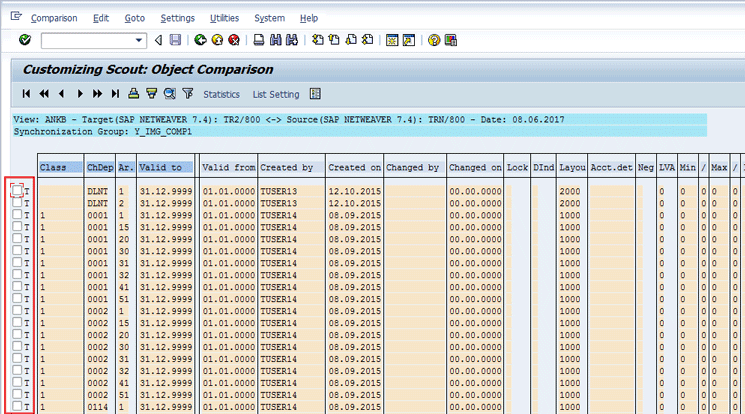
Figure 39
Detailed output screen with custom filter criteria
38. Now, to see only the identical configuration values in the detailed output screen, change the filter setting. Go to the filter by following the path shown in Figure 33. In the pop-up screen (Figure 40), select the Identical check box and click the enter icon.
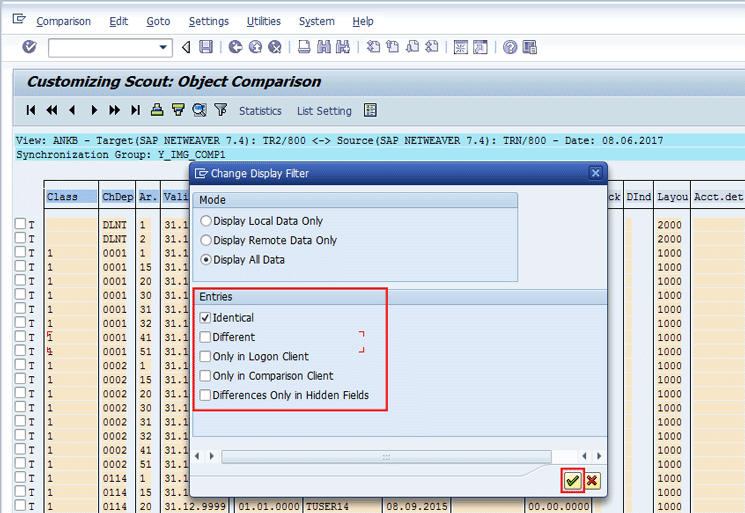
Figure 40
Filter value for identical entities from the source and target output
39. The output of identical values is shown in the next screen (Figure 41).

Figure 41
Identical records detailed in the output screen
I've explained most of the filter settings. Now I discuss different types of output types.
40. Now go back to the result set of Scout differences as shown in Figure 25. Select another entry with the positive outcome of having no difference (as visible in the Comp. column) and click the comparison icon as shown in Figure 42.
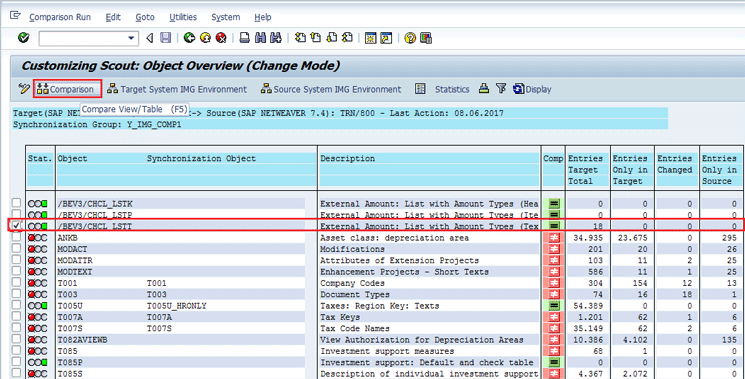
Figure 42
Selection of an entry from the Scout output screen
41. In this case as there are no different values, a confirmation pop-up screen appears as shown in Figure 43. Click the Yes button to proceed so that the detailed output screen is shown.

Figure 43
A message indicates that contents are identical
42. The detailed output is shown in the next screen (Figure 44). Double-click one of the entries to see the information at the table level.

Figure 44
Detailed output screen for identical entries for selected Scout record
43. In next screen, the information at the table level appears as shown in Figure 45. The outcome shows that there are no values that are shown as different. The reason is that all the entries are identical in the source and target systems.

Figure 45
Table output showing that entries are identical in the source and target systems
44. Now I analyze one more type of outcome. Refer to the Scout screen again (Figure 25). Select another entry in the comparison output as shown in Figure 46 and click the comparison icon. The intent here is to show the different types of outputs. In the steps above, output records either in the source system or in the target system were observed. In this example, other varieties of outputs are shown (e.g., difference entries from the target system or difference entries from the source system).

Figure 46
Selection of a record from Scout output for comparison details
45. The result appears in the next screen (Figure 47). Select one of the entries and double-click it to see the details.

Figure 47
Detailed output screen for the selected Scout record
46. The details appear in the next screen highlighting MT (modified entry from the target system) and MS (modified entry from the source system) as shown in Figure 48. These results require attention so that appropriate decisions can be made for synchronizing the records.

This way, multiple types of outcomes in Scout comparisons can be analyzed for informed decision making for project requirements.

Sapna N. Modi
Sapna N. Modi has 13+ years of experience in the software industry including SAP software in the areas of solution architecture, consulting, presales, and project management. Sapna has multiple SAP and non-SAP certifications. She is an integral part of the team in setting up the SAP Solution Manager practice at L&T Infotech (
www.lntinfotech.com) and has participated in consulting and advisory roles for multiple projects. She has global exposure with experience in the US, Canada, Denmark, Sweden, Germany, the Netherlands, and Kuwait. She is instrumental in and is dedicated to an extreme automation initiative of SAP projects across verticals at L&T Infotech (LTI). Her goal is to accomplish automation-driven efficient operations and to formulate an automation platform for optimized TCO for customers as well as for her organization. Her focus is on innovation to leverage SAP products and non-SAP products involving Robotic Process Automation (RPA), Artificial Intelligence (AI), and Machine Learning (ML) to help customers standardize their portfolio so that it is simplified, automation ready, and able to easily migrate to the SAP S/4HANA platform.
You may contact the author at
sapna.modi@lntinfotech.com.
If you have comments about this article or publication, or would like to submit an article idea, please contact the
editor.


