Management
With a little discipline and the right metrics, the SAP Center of Excellence (COE) can be transformed from an application support team into a key player in the business. See how the Novartis Vaccines and Diagnostics division boosted the success of its COE, and how you can apply the same techniques in your company.
SAP Centers of Excellence (COE) were initially conceived to help companies support specific SAP applications, but by developing and tracking the appropriate metrics, COE staffers can boost the profile of the center and make it an important player in key business decisions.
Ken Grady, head of ERP for the Novartis Vaccines and Diagnostics division, learned that lesson starting in 2004, when he was brought from the U.S. to Europe to establish a COE for the division’s SAP ERP system. The COE now comprises 38 geographically dispersed full-time staff to support 2,500 end users. The division runs on a single instance of SAP ERP Central Component (ECC) 6.0.
The staff of a COE typically includes a mix of business and application experts. By nature, this group touches on almost every aspect of the business. Grady used this to his advantage by developing a range of metrics that could be tracked over time to help determine future plans.
“I believe you can’t manage what you can’t measure. So I thought of quantifiable metrics that I could take back to our leadership and show them what they were getting for their money, and to encourage them to continue to invest in SAP and get more out of it,” says Grady.
He began by polling COE consultants on what kinds of metrics they used when reporting back to their clients. From there, he created a series of simple metrics that affected the business and could be tracked over time. (Grady outlined this process in an article titled “5 Steps to Measuring COE Value,” in the Fall 2007 issue of SAP NetWeaver magazine.)
For example, Grady insisted that COE staff log each activity in its incident and problem management system. From that data, Grady was able to build a simple dashboard for tracking incident resolution, as shown in Figure 1.
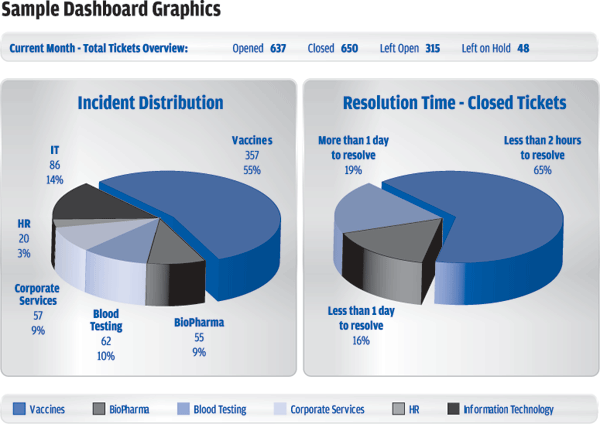
Figure 1
Simple dashboard graphics help illustrate IT incident resolution. The data used for these graphics is hypothetical.
Not only do these straightforward metrics help track recurring trouble spots for the support team, they also help Grady justify his department’s activities with real data rather than anecdotes.
“A great example is the CFO who said to me, ‘Your department costs too much.’ I was able to say, ‘Your department called for help 400 times last month. How many of those do you want me to ignore so I can reduce the cost to you?’ It turned an emotional conversation into an objective one because we were using metrics,” he says.
Grady also saw an opportunity to measure how his staff was spending its time by instituting simple logging procedures. The resulting metrics would indicate possible trouble spots and offer objective measurements of the value each task brought to the business.
“I really wanted to understand how we were using our resources at all these sites. How were the employees spending their time? They all told me they were very busy, but the evidence was anecdotal. So we implemented a very rudimentary resource utilization tool — it’s an Excel spreadsheet — which we’re still using. Everybody logs how much time they’re spending and what they’re doing,” says Grady.
About once a month, the staff spends a few minutes compiling the resource allocation data. The data can be sorted by the amount of time an employee spends on each task, the purpose of each task (such as project support or user training), and how much of the work is devoted to administration. Grady can then compare how much of his staff’s work adds value to the business versus that which simply maintains the system. Figure 2 shows an example of this type of data rendered in dashboard form.
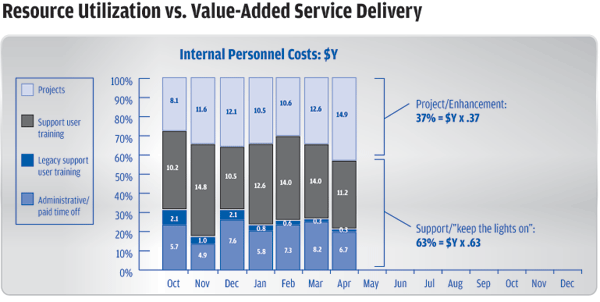
Figure 2
Comparing value-adding activities to maintenance activities
“The easiest way to increase the value-add is to reduce the cost of care and feeding. I can do that by outsourcing or automating the commodity work, or I can have a conversation with the business staff and say there are things here that we are doing month after month that really don’t add value back into the business,” he says.
For example, asking power users to conduct basic SAP training courses frees the IT staff to perform more value-add functions, says Grady.
One key to Novartis’ success in developing appropriate metrics was realizing how much information it could gather with minimal discipline. Regardless of the industry, most companies considering a COE can probably identify dozens of obtainable data points that can be tracked over time. Other simple metrics that can be tracked within a COE are system uptime and change management processes.
“Most people have this information someplace. A lot of companies can show their cost per user and other metrics CFOs really like. You have that information at your fingertips, and gathering it makes answering questions much easier,” says Grady.
Tracking Trends
Once you have decided which metrics to follow, the next step is to analyze trends that affect the day-to-day operations of the business. With a small amount of added demographic information, such as functional type, you can build a quick operations dashboard to pinpoint trouble spots, as shown in Figure 3.
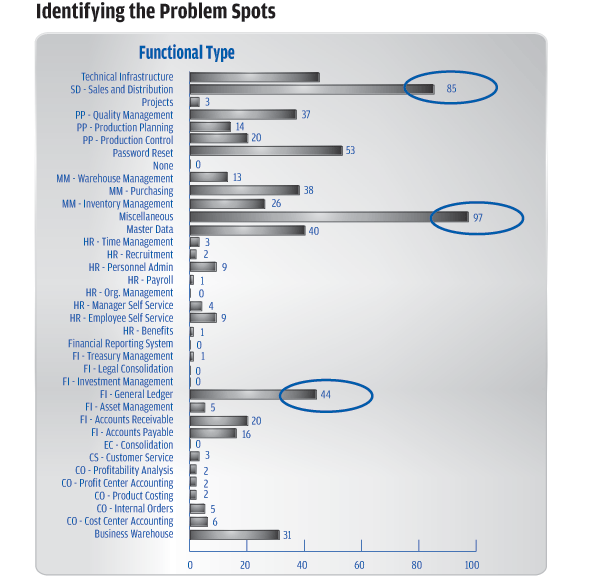
Figure 3
An operations dashboard for tracking trends and spotting problem areas
Over time, these metrics can be coordinated into trend reports, which can be used to track changes in resource allocation and help plan future projects. An example trend report is shown in Figure 4.
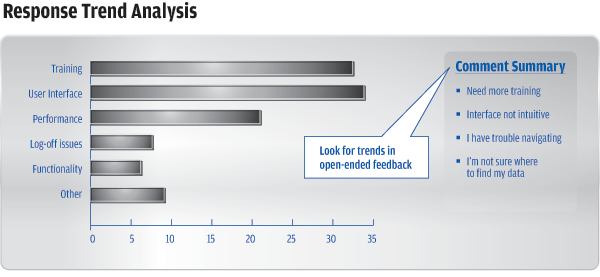
Figure 4
A sample trend report, including open-ended feedback collected from end users.
Adding New Metrics
The COE staff hopes to realize even greater gains in the future by adding new metrics to track. Grady says the goal is to reduce as much as possible the division’s reliance on “commodity” skills.
“One metric we’ve added is we’re tracking how we are using consultants. Are we using them for projects or support? Are we using the big five vendors or offshore vendors? How is the mix shifting over time? We are really looking to source as many of those commodity skills as possible so we can continue to drive down our operations costs and focus our internal resources on value-add work. I’d much rather spend consulting dollars on the boring work and have all the fun myself,” says Grady.
Of course, the COE still serves its originally-mandated function as well. In 2007, the small COE staff (the division outsources most of its ABAP, Basis, and portal development) was able to support the upgrade from R/3 4.6C to ECC 6.0.
“It was a huge project with a global span. It was great because we didn’t bring any of the staff together physically except for a few meetings. We managed all the upgrades, testing, and revalidation, along with all the extra things we have to do for the life sciences environment,” says Grady.
The Result: A COE That is Critical to the Business
Four years later, the Novartis COE is a cornerstone of the division’s investment strategy — a central repository for business process wisdom that supports a broad range of corporate decision-making.
“It has definitely become more strategic. The challenge we’re looking at now is to leverage more of the outsource partners and how to manage that activity, and really make sure our internal staff is focused on the value-add — the solution architecture and design, business analysis, things that you need to know the biz for and not commodity work.”
For example, COE metrics were a key factor in the division’s recent decision to run its clinical supply chain operations in SAP. Because SAP already managed the division’s commercial supply chain, management was able to assess the value of bringing the clinical supply chain into the fold as well.
“We use this data a lot during budget time to help drive prioritization conversations. For example, if we have 73 project requests, how do we prioritize the top 12? Or do we have an SAP strategy that’s cohesive? A lot is tied to the information we drive back from the COE. In the beginning, it was about managing the environment. Then it was for trending information. Now we use it to drive investments — to drive returns back out,” he says.
Key Best Practices for Managing a COE
In a 2006 study of almost 60 COEs, SAP and ASUG identified a number of key best practices to help lower the total cost of ownership of an SAP system and to optimize business processes. Those include:
- Managing the entire process of support, from problem definition to resolution
- Documenting the knowledge management process, from the creation of a knowledge repository through all training and help desk routing tasks
- Centralizing the COE to streamline support delivery
- Limiting system customization
- Establishing the COE during the initial system implementation phase
- Adopting a business process owner model and letting those owners drive decision-making
- Enacting formal power user programs to provide the first line of support to the business user community
Source: “Centers of Excellence: Optimize Your Business and IT Value” – 2006 ASUG/SAP Best Practices Survey
Davin Wilfrid
Davin Wilfrid was a writer and editor for SAPinsider and SAP Experts. He contributed case studies and research projects aimed at helping the SAP ecosystem get the most out of their existing technology investments.
If you have comments about this article or publication, or would like to submit an article idea, please contact the editor.