Learn the process flow of realigning data and copying characteristic value combinations (CVC) in SAP Advanced Planning and Optimization (SAP APO) Demand Planning (DP). Follow a step-by-step procedure to understand the prerequisites, importance, configuration, and execution of the CVC maintenance process and interpretation of results.
Key Concept
Demand Planning (DP) in SAP Advanced Planning and Optimization (SAP APO) helps to generate forecasts based on historical values. Before beginning the planning process, you need to define the parameters on which forecasting needs to be done. These parameters (for example, product, location, country) are called characteristics in SAP APO. To generate a forecast, some kind of object or master data is needed. In DP this master data is known as characteristic value combinations (CVCs). CVCs combine different characteristics values that you need to plan. Planning can only be done if CVCs have been defined.
A Business Scenario
Consider an example of a food and beverage manufacturer that sells multiple products around the globe. For my business scenario in this article, the company sells its product FG01 in four countries (C1, C2, C3, and C4) from manufacturing plant Plant1. Each country shipment is delivered either by international or domestic distribution centers. The company plans to roll out a new product, FG02, in all four countries. Product FG02 is an improved version of the existing product, FG01. No historical forecast data exists for the new product, and therefore, the company might be using FG01 as its reference.
Figure 1 shows the business scenario discussed above. I also describe other scenarios highlighting different situations and how to map them within the system.

Figure 1
A sample business scenario
DP Objects
Master Planning Object Structure (MPOS)
An MPOS contains plannable characteristics for use in planning. To configure an MPOS, execute transaction code /SAPAPO/MSDP_ADMIN. For my example, the MPOS contains the following characteristics: APO Location, APO Product, Sales Organization, and Country as shown in
Figure 2. To see the navigation attributes defined, click the Navigation attributes button.

Figure 2
The initial screen for the MPOS
In the pop-up screen (
Figure 3), you can see that Division is a navigational attribute based on country. Navigational attributes are used in reporting to provide more information about a basic characteristic. The process of realigning navigational attribute is different from realigning other characteristics. I explain how to realign other characteristics later in the article.

Figure 3
An MPOS navigational attribute
Planning Area
A planning area defines the area in which most of the planning activities take place. It groups together both characteristics and key figures under a single domain. To create a planning area, execute transaction code /SAPAPO/MSDP_ADMIN. For my example, a planning area is created based on an MPOS that contains two key figures: Forecast and History (
Figure 4).

Figure 4
A planning area
CVCs
To view the CVCs that are present in the MPOS, execute transaction code /SAPAPO/MC62. This action displays a screen that lists the CVCs (
Figure 5).

Figure 5
The CVC list
Note
Creation of a CVC is a basic step that I do not describe in this article.
Planning Book/Data View
In the planning book/data view, forecast and history values are present for product FG01 for all countries as shown in
Figure 6. Data is entered in the planning book/data view via transaction code /SAPAPO/SDP94.

Figure 6
Forecast and history values for product FG01
Realignment Process Steps
The realignment function works at the MPOS level. Here, the system can create new CVCs based on selection criteria of old CVCs. Not only CVCs but also associated key figure values are copied.
Suppose a company is planning to introduce a new product, FG02, in country C1. Because the product is new, it does not have any historical data. The product FG02 is similar to the existing product FG01, which is being sold by the business in country C1. Therefore, the company decided to use the historical values for calendar year 2015 for FG02 in country C1.
Note
Here the underlying assumption in the business scenario is that FG02 is similar to FG01, but an improved version. So FG01 is used as a reference to distribute forecast values in FG02. If there is no similar product, then a forecast is created based on qualitative forecasting techniques, such as sales force surveys, Delphi sessions, focus groups, and test marketing. These techniques are beyond the scope of this article.
Maintain a Realignment Table
To use the realignment function, execute transaction code /SAPAPO/RLGCOPY. In the Choose Application section of the screen that appears (
Figure 7), select the Realignment radio button. In the Realignment Run: Properties section, select the Planning Object Structure field and choose an option from the drop-down list (e.g., ZTEST). Click the Create/Change Table button.

Figure 7
The Realignment initial screen
In the pop-up message screen (
Figure 8), click the Yes button.
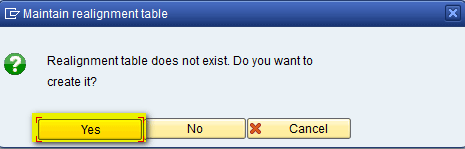
Figure 8
The pop-up message screen to create a realignment table
A message appears at the bottom of the screen (
Figure 7) stating that the realignment table has been created successfully as shown in
Figure 9.

Figure 9
Successful creation of the realignment table
In the same screen, click the Maintain Entries button as shown in
Figure 10.

Figure 10
Maintain entries for the realignment table
In the next screen (
Figure 11), enter the source and destination details for all characteristics: APO Location, APO Product, Sales Organization, and Country. Because new product FG02 will be introduced in country C1, the destination for the SAP APO product is FG02. Note also that the Copy Factor is 100. This setting denotes 100 percent (i.e., all the values will be copied from the source to the destination).

Figure 11
Save your entries for the realignment step
The Copy Logic is M. The M value denotes overwrite. You also have option of A in Copy Logic that denotes add (i.e., add to the existing values present in destination). Because in my example the destination value does not exist, both M and A yield the same result. After you enter the values, click the save icon highlighted in
Figure 11. After saving your data, click the back icon (the left arrow highlighted in
Figure 11). This action returns you to the screen shown in
Figure 12.

Figure 12
Successful creation of the realignment step
In the screen shown in
Figure 12, you can see that the realignment step is defined. Click the back icon to return to the Realignment main screen in
Figure 10.
Because you want to copy only History values in accordance with business requirements, in the main screen you need to select only the required key figure. In the Key Figures section of the Realignment main screen, select the Individual Key Figures radio button and then click the arrow icon highlighted in
Figure 13.

Figure 13
Select Individual Key Figures
In the pop-up screen (
Figure 14), select the History check box and then click the enter icon (the green checkmark).

Figure 14
Select the History key figure
Execute the Realignment Run
In the previous section, you learned how to define a realignment table and realignment step. Now you need to execute the step defined in the table. In the main screen (
Figure 15) click the execute icon.
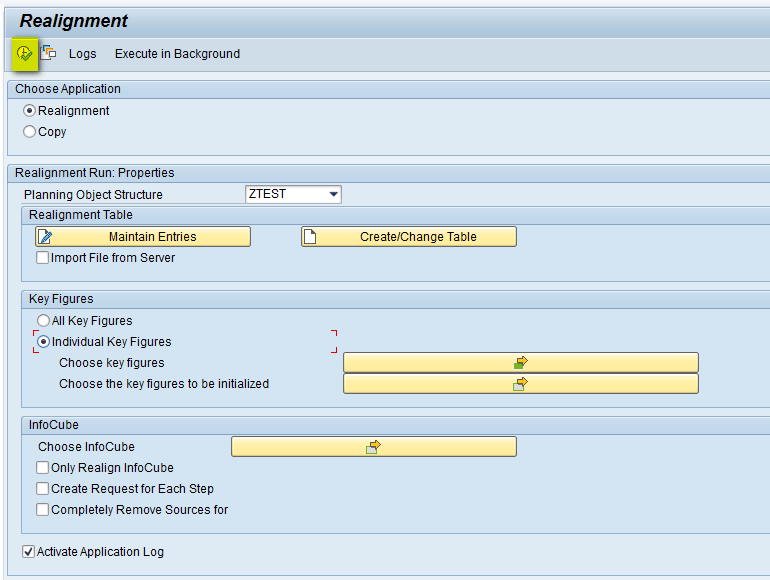
Figure 15
Execute the realignment
To view the results, execute transaction code /SAPAPO/SDP94 and load the same selection that you loaded in
Figure 6. Note that a new row was created for Product FG02 in Country C1. You also can see that History values are copied from country C1 for FG01 into FG02 (all 10 values in the row highlighted in yellow belong to FG01 and it has been copied to FG02 in C1). The Forecast values are empty as you selected only the History Key Figure while defining the Realignment step as shown in
Figure 16.

Figure 16
History values for FG02 in Country C1
Mass Processing of CVCs in the Realignment Table
In the above section, you learned how to carry out realignment by defining the step manually. However, in practical scenarios in which the CVC count is huge, defining each step manually can be time-consuming. For these scenarios, there is another option to create entries in Microsoft Excel and then directly upload them in the system.
To use this option, execute transaction code /SAPAPO/RLGCOPY. In the initial screen that appears (
Figure 17) click the Maintain Entries button.

Figure 17
Maintain entries for a CVC
In the next screen, select Utilities > Create Local File as shown in
Figure 18.
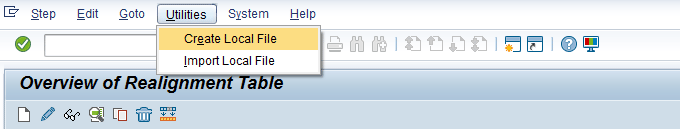
Figure 18
Select the Create Local File option
In the pop-up screen that appears (
Figure 19) enter a name in the File name field (e.g., Realignment) and click the Save button. This action saves the file in the given location in the local system.

Figure 19
Save the realignment file in the local system
Consider a scenario in which a company wants to introduce the new product FG02 in other countries too (i.e., C2, C3, and C4). However, the proportion of values to be copied needs to be 50 percent for country C2 and 25 percent for country C4. Also for country C3 the company has decided to remove product FG01 and sell only product FG02. Therefore, details of product FG01 in country C3 need to be deleted, too.
To incorporate the above requirements, you need to create three steps within the Excel file — one for each country. Also for countries C2 and C4, the copy factors are 50 and 25, respectively. For country C3, Delete Source also needs to be checked as shown in
Figure 20.

Figure 20
Maintain entries in the realignment file
After you save the entries in the Excel file, you need to import it into the system. To complete this step, from the same screen as shown in
Figure 18, go to Utilities and select Import Local File as shown in
Figure 21.

Figure 21
Import the local realignment file to the system
After the system imports the entries, it lists them in the screen shown in
Figure 22. Note that the Step Status for new rows created is different from the Step Status of row 1. The status shows that step 1 has been executed successfully, but steps 2, 3, and 4 have not yet been executed.
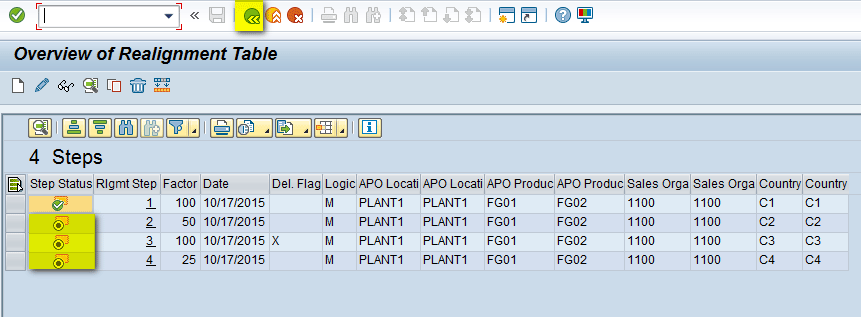
Figure 22
Data uploaded to the system
Click the back icon (
Figure 22) to go back to main Realignment screen (
Figure 23). Make sure that the Realignment radio button in the Choose Application section is selected. You also want to copy all key figure values, so select the All Key Figures radio button in the Key Figures section. Now click the execute icon.

Figure 23
Execute realignment
In the same screen (
Figure 23), click the Logs button to view the Realignment logs. In the next screen (
Figure 24), the log shows that three steps have been processed successfully.

Figure 24
View realignment logs
To view the results, execute transaction code /SAPAPO/SDP94 and load the same selection that you loaded in
Figure 6. In
Figure 25, you can see the new row being created for Product FG02 in countries C2, C3, and C4. Note that the row is deleted for FG01 in country C3. The values for FG02 in country C2 are also 50 percent of the values for FG01 in country C2. Similarly, values for FG02 in country C4 are 25 percent of the values for FG01 in country C4.

Figure 25
Values for FG02 in countries C2, C3, and C4
The Copy Function
The difference between realignment and copy is that the copy function runs at the planning area level, whereas Realignment runs at the MPOS level. Unlike the Realignment function, the copy function does not allow you to create new CVCs. Copy can only be used when CVCs exist in a destination and some or all values need to be copied from the source to the destination. The copy function also enables you to copy data between individual versions, select the key figures to be copied, and restrict the period in which data is copied.
To demonstrate the use of the copy function, suppose you want to add the values in
Figure 25 of Forecast and History key figure for FG01 in FG02 for country C1 between July and September 2015.
Figure 26 is a snapshot of the values in country C1.

Figure 26
FG01 and FG02 in country C1
To use the copy function, execute transaction code /SAPAPO/RLGCOPY. In the Choose Application section of the main screen that appears (
Figure 27), select the Copy radio button. In the Copy Run: Properties section, select a name in the Planning Area field (e.g., ZTEST), and click the Maintain Entries button.

Figure 27
The initial screen for the copy function
In the next screen, define the settings as highlighted in
Figure 28. Click the save icon to save your entries. Note that the Copy Logic is A, which means it will add to existing entries present in the destination. The Copy Factor is 100, which denotes 100 percent.

Figure 28
Define settings for the copy function
In the main Realignment screen (
Figure 29), go to the From Date field in the Period section. Enter a period from July to September 2015. In the Key Figures section, select the All Key Figures radio button and then click the execute icon.

Figure 29
Execute the copy function
To view the results, load data in the planning book via transaction code /SAPAPO/SDP94 for country C1 for both product FG01 and FG02 as shown in
Figure 30. In the screen, you can notice the difference by comparing the values in
Figure 30 with values in
Figure 26. Values have been modified between July and September 2015 for FG02 as highlighted in yellow.

Figure 30
Updated values for FG02 between July and September 2015
Realign Navigational Attributes
Until now I explained how to carry out the realignment and copy process for normal characteristics. However, the procedure is different for navigational attributes because they point to values of another characteristic.
In my example, you know that Division is the navigational attribute based on the Country characteristic as shown in
Figure 3. To see the current list of CVCs present, execute transaction code /SAPAPO/MC62 for MPOS ZTEST. In the screen that appears (
Figure 31), you can see there are a total seven CVCs present.

Figure 31
A CVC list
Consider a business scenario in which the earlier country C1 was served from the International Division (INTL). Because of some legal issues, now it will be served from the Domestic (DOM) Division, so you also need to change this division in the CVC, too. Since Division is a navigational attribute based on the characteristic Country, it follows a different process.
To complete this step, execute transaction code RSD1. In the screen that appears (
Figure 32), enter a name in the InfoObject field (e.g. ZCOUNTRY) and click the Maintain button.
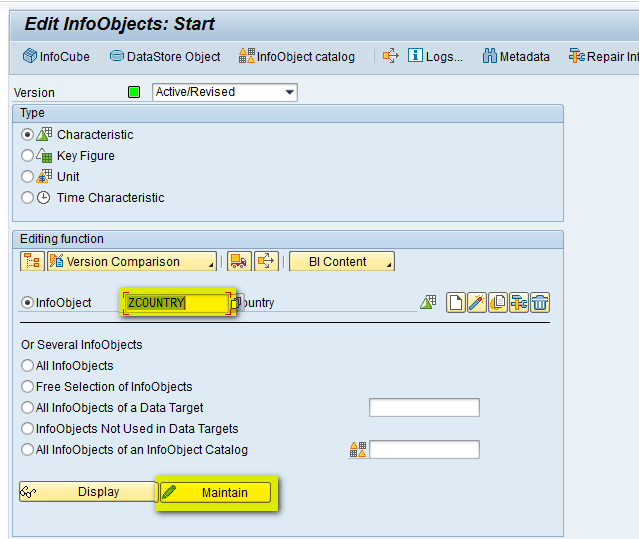
Figure 32
Edit the InfoObject
In the next screen, click the Maintain button as shown in
Figure 33.

Figure 33
Maintain the InfoObject
A new web URL opens in a separate window that displays a screen in which you can see the names of the divisions present for each country (
Figure 34). For Country C1 it is correctly INTL.

Figure 34
Navigational attribute values
In the same screen, change Division name to DOM for country C1 and then click the Save button as shown in
Figure 35.

Figure 35
Change navigational attribute values
After you save your changes, execute transaction code /SAPAPO/MC62 for MPOS ZTEST to see the modified list of CVCs present. In the screen that appears (
Figure 36), you can see that there are seven CVCs present and country C1 Division is now DOM.

Figure 36
A CVC list showing modified navigational attribute values
Realign the InfoCube
Figure 37

Figure 37
Realign the InfoCube
Note
If both the InfoCube and the MPOS need to be realigned, then do not select the Only Realign InfoCube check box in Figure 37.
Limitations and Recommendations
• If a user is in the planning book based on the MPOS or planning area for which realignment or copy is being executed, the process terminates and gives a locking message. To demonstrate, I tried to run the realignment step by opening another session in the interactive planning book. The error message shown in
Figure 38 appears.

Figure 38
Locking message in Realignment
Figure 38Figure 39

Figure 39
Running realignment in the background
Alok Jaiswal
Alok Jaiswal is a consultant at Infosys Limited.
He has more than six years of experience in IT and ERP consulting and in supply chain management (SCM). He has worked on various SAP Advanced Planning and Optimization (APO) modules such as Demand Planning (DP), Production Planning/Detailed Scheduling (PP/DS), Supply Network Planning (SNP), and Core Interface (CIF) at various stages of the project life cycle.
He is also an APICS-certified CSCP (Certified Supply Chain Planner) consultant, with exposure in functional areas of demand planning, lean management, value stream mapping, and inventory management across manufacturing, healthcare, and textile sectors.
If you have comments about this article or publication, or would like to submit an article idea, please contact the
editor.