Learn how you can use the monitoring cockpit accessible via transaction SMWP to comprehensively monitor CRM Middleware. In particular, you will learn how to monitor generation information, runtime information, and systems settings.
Key Concept
You can use transaction SMWP to access the Monitoring Cockpit, a central monitoring tool for CRM Middleware that allows you to access important administration and monitoring tools. Monitoring CRM Middleware is an important responsibility of the SAP CRM system administrator and can be automated with Monitoring Cockpit functionality. It provides information about the statuses of different nodes or monitoring elements. CRM Middleware monitoring is a proactive exercise aimed at ensuring potential system issues are quickly identified before they affect the performance and availability of the system.
Monitoring CRM Middleware is essential for the availability of your system. Transaction SMWP provides a comprehensive tool that combines different monitoring tools and transactions in the areas of queued Remote Function Call (qRFC) monitoring, Business Document (BDoc) monitoring, and initial load monitoring. Transactions SMQ2 or RZ20, SMQR or RZ20, SMQ1or RZ20, and SMQS or RZ20 are used to monitor inbound queue, inbound queue scheduler, outbound queue, and outbound queue scheduler, respectively. Furthermore, transactions SMW01, SMW02, and R3AM1 are used to monitor BDoc details, the BDoc summary, and the initial load, respectively.
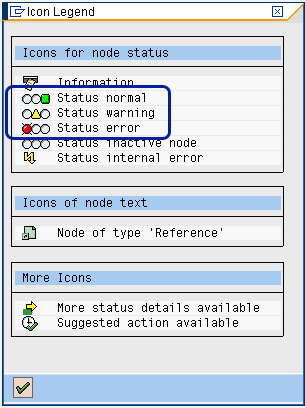
The tool is based on Computing Center Management System (CCMS) qRFC monitoring because data exchange to the SAP ERP or SAP R/3 back-end system is based on qRFC. The traffic light concept is used in the Monitoring Cockpit to show the status of each monitoring element. Generally, green represents a stable and normal state, yellow depicts a warning message or specific information, while red is associated with error and abnormality (Figure 1).

Figure 1
Monitoring Cockpit legends
Note
For the purposes of this article, I use the terms SAP ERP and SAP R/3 interchangeably.
Monitoring CRM Middleware is important to ensure that it properly performs its responsibilities and functions, which include data queuing, data transport, data replication, data realignment, data exchange, and data mapping. To use the Monitoring Cockpit, you must first schedule reports SMWP_BATCH and SMWP_GE_BATCH for execution. Report SMWP_BATCH updates the runtime information (it is frequently updated), while report SMWP_GE_BATCH updates generation information (less frequently updated).
The Monitoring Cockpit monitors the following elements (Figure 2):
- Generation Information
- Runtime Information
- System Settings
- Monitoring Tools/Statistics
- Background Jobs

Figure 2
Nodes of the CRM Middleware Monitoring Cockpit
Next I discuss how you can use the Monitoring Cockpit for monitoring generation information, runtime information, and system settings of SAP CRM Middleware.
Generation Information
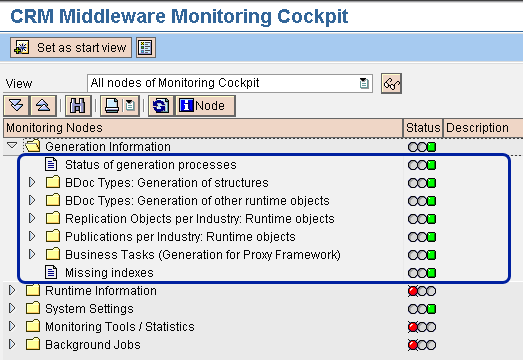
First, you can use the Monitoring Cockpit to monitor the status of the generation of different processes, structures, replications, publications, and indexes (Figure 3). The generation of these elements is cross-client and initiated under the following conditions:
- At the initial configuration of the system or client
- At program run
- After implementing a Support Package
- After changing a BDoc type
- After a publication or replication object is created in the Administration Console via transaction SMOEAC
- After a change transport for a BDoc, publication, or replication

Figure 3
Monitoring elements for the Generation Information monitoring node
The Generation Information monitoring node in the Monitoring Cockpit provides information in the following subject areas, as shown in Figure 3:
Runtime Information
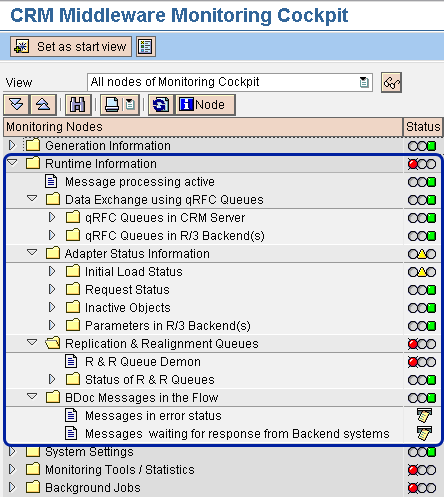
The runtime information monitoring node of the Monitoring Cockpit provides information in the following areas (Figure 4), which I’ll explain in more detail below:
- Message processing active
- Data Exchange using qRFC Queues
- Adapter Status Information
- Replication & Realignment Queues
- BDoc Messages in the Flow

Figure 4
Elements of the Runtime Information monitoring node
Message processing active: The middleware activation mode setting is cross-client and you can activate or deactivate it. If message processing is set to Yes (activated), the traffic light is green. If message processing is set to No (deactivated), the traffic light is red. Message processing is set to No if the generation or last upgrade was unsuccessful. The implications of the No setting include:
- BDoc messages are not generated
- SAP CRM online transactions are cancelled
- Delta changes originating from the back-end system do not leave the R3A* inbound queues and are assigned the status SYSFAIL
Data Exchange using qRFC Queues: qRFC queues are used for data exchange or transfer between the SAP CRM system and other components in the SAP CRM system landscape, such as SAP ERP, groupware, and CRM Mobile Clients. qRFC queues must be closely monitored to prevent interruptions to data exchange that result from stopped or failed queues. When the qRFC queues encounter an error condition, the traffic light displays red; otherwise, a green light is displayed. The qRFC queues that are monitored in the Monitoring Cockpit include:
- R3AI/R*: Start queues for loads from online transaction processing (OLTP)
- R3A*: Load queues (SAP R/3 OLTP to SAP CRM)
- R3AU*: Load queues (SAP CRM to SAP R/3 OLTP)
- CRM_SITE*: Load queues for mobile clients
- CDB*: Start queue for loads (SAP CRM to CDB)
- CRI*: Initial load queue (SAP CRM to CDB)
- CSA*: Send queues of SAP CRM server application
Adapter Status Information: The adapter status information monitoring node in the Monitoring Cockpit provides information about initial load status, request status, inactive objects, and parameters in the backend. I’ll explore each of these further.
Initial Load Status: You can use the Monitoring Cockpit to display the status of initial loads based on the information available in transaction R3AM1. This transaction is a download monitor that displays the status of the initial load of business objects and also controls initial load. It is also used to start the initial load for customizing adapter objects and business adapter objects. An initial load is used to transfer the data of a customizing adapter object (i.e., a group of one or more database tables) from the back-end system to SAP CRM. It is important to note that the Monitoring Cockpit must be started on all clients in the productive environment because the initial load information is client-specific. The information displayed from the initial load is from report SMOF_MONITOR_SMOFDSTAT and based on statistics table SMOFDSTAT (Figure 5).

Figure 5
Initial load status based on report SMOF_MONITOR_SMOFDSTAT
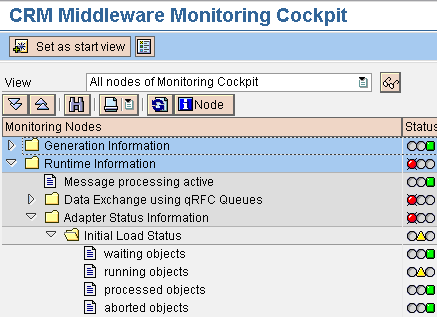
The different branches of initial load statuses include the following, shown in the Monitoring Cockpit (Figure 6):
- Waiting objects: All objects that have a waiting status are displayed here. The Additional Information functionality allows you to investigate why the object has a waiting status.
- Running objects: All objects whose initial load has not completed
- Processed objects: Successfully processed initial loads
- Aborted objects: All objects whose initial load is manually and explicitly cancelled by a user

Figure 6
Initial load status monitoring elements
Request Status: Requests are created using transaction R3AR2. You can access the request monitor via transaction R3AR3. Transaction R3AR4 triggers the request to load selected data from the back-end system to the SAP CRM database or vice versa. Requests are similar to an initial load because they overwrite data for customizing objects and business objects, and they are used to synchronize data that lacks delta load capability. The information displayed after you access transaction R3AR4 is from report SMOF_MONITOR_SMOFRSTAT and based on statistics table SMOFRSTAT. The different nodes of the request status include:
- Waiting objects: All objects whose requests have a waiting status
- Running objects: All objects whose requests have not completed
- Processed objects: Successfully processed requests
- Aborted objects: All objects whose requests are manually and explicitly cancelled by a user
Inactive Objects: Table SMOFOBJPAR acts as the repository for inactive parent objects. They are displayed in object management via transactions R3AC1, R3AC3, and R3AC5.
- Transaction R3AC1 is used to display the business adapter object
- Transaction R3AC3 is used to display the customizing adapter object
- Transaction R3AC5 is used to display the condition adapter objects
Parent objects need to be active to successfully load child objects. Transaction SMWP provides details about the attributes of inactive objects, especially regarding the availability or unavailability of active child objects.
Parameters in R/3 Backend(s): Client-specific information, such as the sites for the SAP back-end system, is defined in the Administration Console. Table CRMRFCPAR controls the data that is sent to a particular consumer. Whether the entry in table CRMRFCPAR is used for data exchange depends on the values in the following fields within that table:
- CONSUMER: This is the receiving application (e.g., SAP CRM, SAP Internet Pricing and Configurator [SAP IPC], and SAP Enterprise Buyer [SAP EBP]). The consumer is usually transferred using table CRMCONSUM.
- OBJECT NAME: This represents the adapter object. In a scenario where no particular entries exist for specific object, an entry with object name * is used.
- DOWNLOAD: The valid load types include delta load (D), initial load (I), request load (R), back-end system error messages (E), other error messages (O), and all load types except E and O (*)
- DISCARDDAT (discard data indicator): This allows data to be rejected before it is written to the outbound queue by setting the field to X.
The following information is displayed in the Monitoring Cockpit for each site of the back-end system defined in the administration console:
- Entries with RFC destinations for the local CRM system: Data is exchanged between the back-end system (e.g., SAP ERP) and SAP CRM via RFC connections. In the Monitoring Cockpit, a green traffic light is displayed if the correct RFC connection is configured. A red traffic light signifies that an incorreect RFC connection is defined.
- CRM default entry for object load from ERP backend: To ensure that all changes in SAP ERP are transferred to SAP CRM, you need to enter CRM as a consumer in table CRMRFCPAR in SAP ERP. The corresponding traffic light is green if SAP CRM is defined as a consumer in table CRMRFCPAR.
- XML active for object load from ERP back end: Different formats can be used to transfer data from SAP ERP to SAP CRM. This parameter defines the mandatory format in which data must be transferred. In the Monitoring Cockpit, the traffic light is yellow if not all objects use XML as the data transfer format from SAP ERP to SAP CRM. The traffic light is green if all objects use XML as the data transfer format. To define the use of XML as the data transfer format for an object, you must maintain the field SEND_XML in table CRMRFCPAR in SAP ERP via transaction SM30.
- Use CRM inbound queues for object loads from ERP backend: The data transferred from SAP ERP is stored in the inbound queue of the SAP CRM server. The data is only saved in the outbound queue if the communication was interrupted or the parameter has been explicitly defined to act like this via transaction SMQ1. In the Monitoring Cockpit, if the traffic light is yellow, it means that not all objects use inbound queues. The traffic light is green when all objects use inbound queues.
Replication & Realignment Queues: This monitoring node provides information about the status of replication and realignment queues demons and the statuses of replication and realignment queues. I’ll explain this in further detail next.
- R&R Queue Demon: The monitoring of R&R queue demon is only applicable to field application scenarios. The R&R queue demon is a queue scheduler and it is cross client. Ideally, queues should have the status RUNNING or WAITING (but not for too long). The number of entries in a queue should reduce under a normal condition especially if new entries are not added to the queue. It is expedient to check the status (for RUNNING) when the entries in the queue do not reduce. The Monitoring Cockpit can take you to the environment for comprehensive monitoring of R&R demon (transaction SMOHQUEUE). In the Monitoring Cockpit, a green traffic light indicates that the R&R demon is running and red indicates that the R&R queue demon is not running.
- Status of R&R Queues: The monitoring of R&R queue is only applicable to the field application scenario. The Monitoring Cockpit provides information about the status and content of the replication and realignment queues used for CRM Mobile Clients. The replication and realignment queues include:
- AC_EXTRACT: Contains records created by the administration console when the data extract is performed
- EXTRACTBLK: Contains records created by the administration console for jobs to extract data from bulk-type BDoc types
- EXTRACT: Contains records created by realignment queues for jobs to extract data from different BDoc types
- REALIGN: Contains records for BDoc types, particularly where distribution requires a realignment
- SUBCHECK: Contains records created by the administration console immediately when a subscription is created or when an existing subscription is changed or deleted
Under normal circumstances, when queues are released, the entries are processed to ensure that the queues decrease. However, if the status of a queue is on HOLD (set manually by the queue demon after encountering an error), the queue entries increase. By setting the status icon in the status column, it is possible to:
- Release queues for processing by setting their status to released (yellow traffic light)
- Interrupt queue processing with running status by setting the status to HOLD (green traffic light)
- Reset released queues to HOLD (red traffic light)
BDoc Messages in the Message Flow: Transaction SMWP is an invaluable tool for troubleshooting BDoc processing errors. Under this section of the Monitoring Cockpit, two nodes exist for each client because the monitored information is client-specific. The first node contains information about BDoc messages, with the following error statuses for individual clients:
- E01: Technical error (incomplete)
- E02: Partially sent; receivers have errors
- E04: BDoc validation error
- E05: Inbound processing failed
- E06: Outbound processing failed
- E07: Conversion error
The display of BDoc messages in each of the error statuses is client specific. It is expedient to check and analyze BDoc message errors on a daily basis and ensure that they are speedily resolved to avoid data inconsistencies.
From the Monitoring Cockpit, you can display a BDoc message in error status via transaction SMW02. This applies to the data of the client onto which you are logged. For entries related to other clients, you must log on to that client and use transaction SMW02. The second node (messages waiting for response from back-end systems) contains a summary report of BDoc messages that have the status O01 (WAITING) — in other words, BDoc messages waiting for SAP ERP system response. The status WAITING is an indication that the response from data receivers such as the SAP ERP back end has not been confirmed. Special attention should be given to BDoc messages that are pending. For BDoc messages that are waiting too long for a response from the SAP ERP system, it is important that you analyze the qRFC outbound queues R3A* in the R/3 system or the qRFC inbound queues R3A* in the SAP CRM system.
System Settings
Transaction SMWP allows you to get information about the administration console sites on the local client of the SAP CRM server. This gives you an overview of the number of mobile clients, SAP ERP back-end systems, and groupware integration implementations as they relate to the types of receivers that are active.
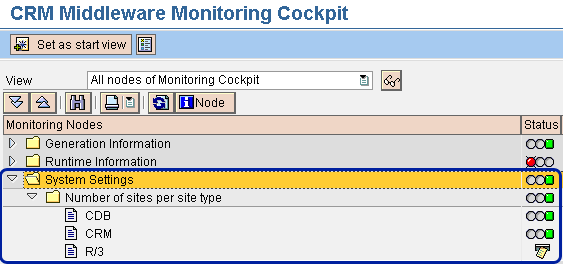
The System Settings node of the central Monitoring Cockpit provides information about the number of sites per site type (Figure 7). Sites are defined as components that send and receive data via CRM Middleware. Examples of sites are SAP CRM, CDB, and SAP ERP or SAP R/3. Under normal circumstances, the allowed number of sites for the SAP R/3 site type ranges from one to many. In contrast, there is only one CRM and CDB site type.

Figure 7
System settings in the Monitoring Cockpit
Kehinde Eseyin
Kehinde Eseyin is a security architect. He holds a bachelor’s degree in computer science. He has about 12 years of IT security, governance framework, IS risk, and compliance experience gained by working in numerous global organizations. Over the years, he has demonstrated competencies in security design, information assurance, cyber security, data privacy, threat and vulnerability management, penetration testing, business architecture, project management, IT audit, IS controls framework, and identity and access management.
You may contact the author at eseyinok@gmail.com.
If you have comments about this article or publication, or would like to submit an article idea, please contact the editor.
