Using the /hs command can help you not only debug system programs, it can also help you clarify vague error messages and uncover the database tables and fields involved in reports. Find out two ways you can use the /hs command to quickly solve coding problems.
Key Concept
You switch the debugger on by using the /h command. However, this command does not debug the system programs unless the system debugging is also switched on. To ensure the debugging of system programs, you use the /hs command. To ensure a smooth assessment of errors, which may include system programs, you should always use the /hs command instead of /h.
When someone in your company demands a report with specific fields in the output, the developer must know the relevant database tables and fields combinations for the output fields. Debugging can help the developer determine the correct combination.
In another situation, the standard business transaction VA01 fails during execution, so the user raises an issue request. The debugging support team is responsible for analyzing the issue. An effective debugging technique involves knowing all the options available in a given situation and being able to decide which is best.
The following two tips explain what to do and when to do it. Although the features of the debugger tool are covered in existing material, I found that much of this coverage overlooks how to identify which specific debugger feature is best to quickly solve an issue requiring the debugger.
Tip 1: Debug to Clarify Warning, Success, and Error Messages
This tip is suitable for debugging when you encounter warning, success, or error messages during SAP GUI-based transactions or ABAP program execution. Before following these steps, make sure that you have debugging authorization in place. The authorization object is S_DEVELOP with the development object ID DEBUG.
Sometimes error messages can be difficult to understand because they may not fully explain the problem — for example, “Wrong type specified in program ‘SAPLSDSD.’” Generally, ABAP dump errors fall into this category.
Here is what you do if the error does not contain enough explanation. In this example, an error occurred while creating a sales order. The problem is a missing customer master record for a given sold-to party. I intentionally took a simple business scenario with an error message instead of an ABAP dump case as it is simpler to understand.
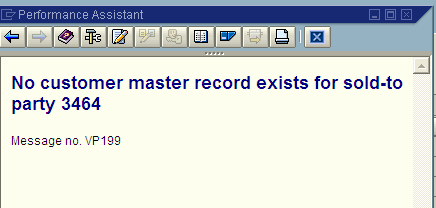
First, click the message on the status bar. Record the message type, message number, and application area (i.e., message group) from the pop-up screen that appears (Figure 1). In this example, the error message number is 199 and the application area is VP. You use this information during debugging to locate the message.

Figure 1
Pop-up dialog shows the error message number and application area
Next, access the debugging mode to trace this error message by replicating the scenario that led to the message. Through this replication, you can see when the error occurs. Just before the point where the error message appears, enter the command /hs at the top of the screen and press Enter. The command enables debugging in the current transaction execution. After you press Enter, the system displays the message Debugging switched on.
Press Enter to generate the error message with debugging enabled. Because debugging is switched on, the error message system automatically takes you into debugging mode (Figure 2).

Figure 2
Debugger screen immediately after entering debugging mode
Next, assess the error in the code. In the debugger, the complete program is visible for assessment on the left side of the screen. Debugging code line by line not only consumes a lot of time but may also lead to confusion because a standard SAP program contains thousands of lines of code. Therefore, you need to focus on precise research.
The debugger tool contains numerous options that if used effectively can save a considerable amount of time. In this case, you want to assess the reason behind the error message, so follow menu path Breakpoints > Breakpoint at > Breakpoint at Statement. In the pop-up screen that appears, enter message in ABAP Cmnds section and click the ok icon (Figure 3). This places a breakpoint at all the messages in the program.

Figure 3
Enter message in the ABAP Cmnds tab
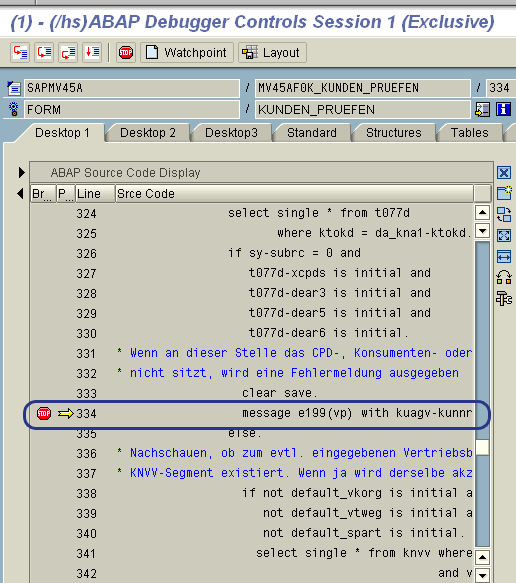
Once the breakpoint is set, you can easily skip to all the message statements in the code. Click the continue icon or press F8 to view each message statement (Figure 4).

Figure 4
The stop sign indicates a breakpoint
Press F8 to see each message statement until you reach the message statement that matches the information you wrote down from the error code. I’ve highlighted this line in Figure 4. When you reach the required message, you need to relocate the error position so that you can do a more detailed analysis in the second round of debugging. Because you have already located the specific position in the program where the error message exists, you do not need to debug the rest of the breakpoints. Deleting all the other breakpoints enables the second round of debugging to focus debugging only on this error message. Follow menu path Breakpoints > Delete all BPs to delete the breakpoint on the message statement that you set at the start of debugging. When the breakpoints are deleted, click the save icon.
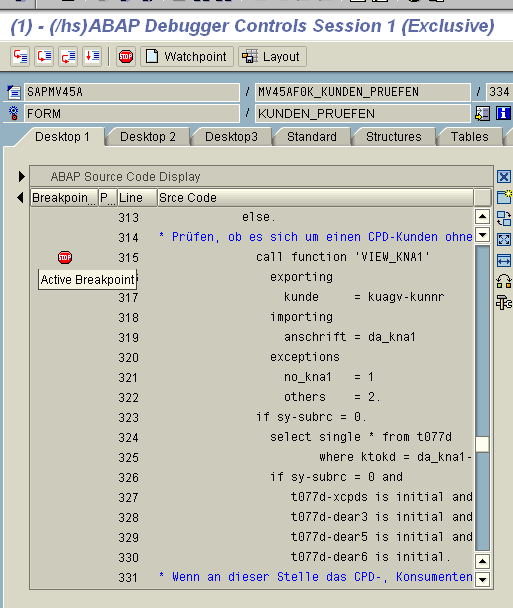
Now you are viewing the code that contains the error message. For the second round of debugging, you also need to see the code that generates the message. In this example, the system raises the error message based on the outcome of the function module, such as an exception status or SY-SUBRC value. Set a breakpoint at this code and the error message by double-clicking before these lines under the Debugging column, as shown in Figure 5. Click the save icon to save the breakpoints.

Figure 5
Set the breakpoint where the code calls the function module related to the error message
After you save the breakpoints, press F8 and the system takes you back to the initial screen that generated the error message. The system has no halt point since you deleted all the breakpoints of the message statement that occurred after you pressed F8.
Now that you are back to the transaction, you need to replicate the error again to find the value for the SY-SUBRC code. Once more, just before you encounter the error statements, switch on the debugging by using the /hs command. Press F8 and the system directly jumps to the function module breakpoint you set in Figure 5. This time, press F6 at the breakpoint to take a closer look at the SY-SUBRC value that is causing the error message.
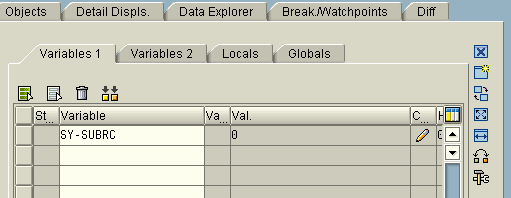
The SY-SUBRC value as shown in the Variables 1 tab (which is on the right side of the main screen) does not match any of the exception numbers of the function module (Figure 6). Therefore, the error message is not due to any exceptions. You can proceed to analyze the code after this function module.

Figure 6
The SY-SUBRC value does not match the function module’s exception numbers
Tip!
You can press F5 to do step-by-step debugging without jumping back and forth from the program. When programs or form routines contain a lot of code, I recommend you first use the F6 key to do a high-level assessment on error generation. Once you locate the sub programs or routines where the error occurred, do more detailed analysis by using the F5 key for step-by-step debugging.
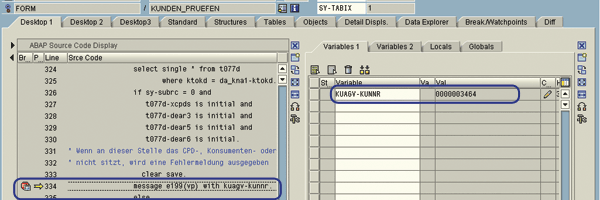
In my example, the error has occurred due to a missing indicator, as shown in Figure 7. This was analyzed by step-by-step debugging. Note the message parameters (if any) such as the KUNNR value in this example.
Tip!
In the code, you will encounter German comments that explain the meaning of the error, such as lines 331 and 332 in Figure 7. Google language tools are useful to help translate the comments if German is not a language you speak.

Figure 7
The debugged code on the left shows the error breakpoint, while the right side of the screen shows the database-field combination for sold-to party
Tip 2: Find the Database Table/Field for the Transaction/Program
Use this debugging tip if you want to know which database tables contain key information about a program or transaction. If you expect a particular output with given input data and that output does not occur, then by using this tip you can get a clear picture of the situation. You can also use it to understand the data flow for classes and interfaces.
I use an example of finding the database table and related field for Last Name. This is a common scenario in which you find such information either to display in report output or to use the table information in ABAP programs. You can find the last name details by identifying database tables for a given user profile in transaction SU3 (Figure 8).

Figure 8
The user profile screen (transaction SU3)
Before entering debug mode, verify whether the required information is easily available. In the Last name field, press F1. Then click the technical information icon to access the field’s details. Figure 9 shows the values in the Field Data section. The table category is Struct. (Structure) and the field name is Name_Last. Because the field belongs to a structure instead of a transparent table, you do not have handy information unless you debug for its table name. Note the technical name of the required field (NAME_LAST) to use in debugging.

Figure 9
The technical details for the Last name field
To discover the database tables after you identify the technical name, enter transaction SU3 with debug mode switched on. You need to analyze the database SELECT query that fetches the data into the Last name field. As in tip 1, switch on the debugging mode by using the /hs command in SAP Easy Access. Then enter transaction code SU3 in the command field. Once you are in debugging mode, set up a breakpoint by following menu path Breakpoint > Breakpoint at > Breakpoint at Statement. The breakpoint helps you assess the data fetching table by making it easier to find the SELECT queries on data fetching. Enter SELECT in the ABAP Cmnds field and click the enter icon (Figure 10).

Figure 10
Enter the SELECT ABAP command
After you set this breakpoint, press F8 to begin the search. As a result of setting the breakpoint, the system only stops at the SELECT statements. When the system stops, double-click the internal table and database table name from the SELECT query so that it appears in the variable column on the right side of the screen (Figure 11).

Figure 11
Double-click the internal table and database table name on the left side of the screen
Continue reviewing the SELECT statements. Double-click the table variable at each stop and look for the NAME_LAST technical name in the internal table. Double-click the internal table name from the variable list on the right side of the screen. This takes you to the Tables tab in the debugging where the table columns and values appear. In my example, you can see the NAME_LAST technical name on table <FT_TEMP> (Figure 12).

Figure 12
Table contains the NAME_LAST technical name in the internal table
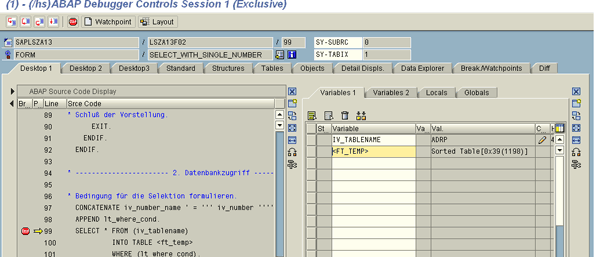
Next, execute the select query by pressing F5. If the select query is successful (i.e., SY-SUBRC = 0) as shown in Figure 13, look for the values that have been retrieved in the internal table. Figure 14 shows that the required field in the internal table contains the value Modi, which was the value of interest. I want to identify the database table that contains this field. In this example, the database table is ADRP, indicated by the dynamic variable value shown in Figure 13.

Figure 13
The SELECT query was successful

Figure 14
Modi appears in the NAME_LAST column
Exit debugging mode and cross-verify the results. Delete all the breakpoints by following menu path Breakpoints > Delete all BPs. Click the save icon. After deleting the breakpoints, press F8 to return to the transaction. The system returns to the main screen of the transaction as shown in the Figure 8.
For results verification, go to transaction SE16 and provide the database table name you found (ADRP in this example). Try searching for the record with the given field value. If the database record is found, then the result is cross verified. If multiple tables are involved during the results verification, obtain all the necessary values from the different tables for verification. This may require noting down the values passed to the SELECT query during debugging.

Sapna N. Modi
Sapna N. Modi has 13+ years of experience in the software industry including SAP software in the areas of solution architecture, consulting, presales, and project management. Sapna has multiple SAP and non-SAP certifications. She is an integral part of the team in setting up the SAP Solution Manager practice at L&T Infotech (www.lntinfotech.com) and has participated in consulting and advisory roles for multiple projects. She has global exposure with experience in the US, Canada, Denmark, Sweden, Germany, the Netherlands, and Kuwait. She is instrumental in and is dedicated to an extreme automation initiative of SAP projects across verticals at L&T Infotech (LTI). Her goal is to accomplish automation-driven efficient operations and to formulate an automation platform for optimized TCO for customers as well as for her organization. Her focus is on innovation to leverage SAP products and non-SAP products involving Robotic Process Automation (RPA), Artificial Intelligence (AI), and Machine Learning (ML) to help customers standardize their portfolio so that it is simplified, automation ready, and able to easily migrate to the SAP S/4HANA platform.
You may contact the author at sapna.modi@lntinfotech.com.
If you have comments about this article or publication, or would like to submit an article idea, please contact the editor.
