Understand your custom formatting options when you are designing and creating SAP BusinessObjects Web Intelligence reports.
Key Concept
SAP BusinessObjects Web Intelligence is the flagship product for ad hoc, Web-based query creation and reporting for the casual end user. SAP BusinessObjects Web Intelligence allows you to access, analyze, and share reports on corporate data over intranets and extranets. It delivers a self-service reporting environment. You can use SAP BusinessObjects Web Intelligence on top of an SAP NetWeaver BW landscape and create user-friendly and interactive reports.
The introduction of the SAP BusinessObjects application as a part of SAP’s BI offerings led many companies to want to combine the SAP BusinessObjects applications with SAP NetWeaver BW. SAP BusinessObjects Web Intelligence (also called WebI) is an ideal application to use data from SAP NetWeaver BW because it allows self-service reporting. However, you need to be cautious when combining the two applications to create SAP BusinessObjects Web Intelligence reports to ensure you achieve the desired functionality and interactivity.
I’ll take you through the basic steps with SAP BusinessObjects Web Intelligence XI Release 3.1 in combination with an SAP NetWeaver BW landscape to achieve some advanced formatting and display functionality available with SAP BusinessObjects Web Intelligence. I’ll focus on two key objectives:
- How to display key figures from a custom structure
- How to display the values selected by users for various variables
How to Display Key Figures from a Custom Structure
You may have a scenario in which you have a structure in a BEx query that contains many key figures, but in the SAP BusinessObjects Web Intelligence report you want to display only a selected few key figures from that structure. For example, in Figure 1, which shows a BEx query, you see a structure called Rolling Periods that has key figures related to various months and quarter time periods of a year.

Figure 1
BEx query with the structure Rolling Periods in columns
In my SAP BusinessObjects Web Intelligence report on top of the above BEx query I want to display the key figures related only to all quarters. To do so, follow these steps:
Step 1. Create the SAP BusinessObjects Web Intelligence report on top of an SAP BusinessObjects Universe built on a BEx Query. You get the structure Rolling Periods displayed as a dimension in the data panel on the left side (Figure 2).
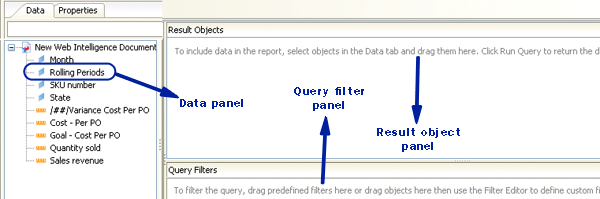
Figure 2
Rolling Periods displayed as a dimension in a data panel
Step 2. Drag the Rolling Periods into the SAP BusinessObjects Web Intelligence report Result Objects panel (Figure 3).
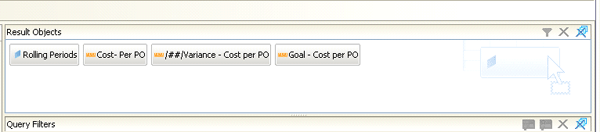
Figure 3
Rolling Periods added to Result Objects panel
Step 3. Drag the Rolling Periods again to the Query Filters panel. Click In list and select Value(s) from list from the drop-down options (Figure 4). This creates a filter of the type List of Values.

Figure 4
Create a filter of the type List of Values
Step 4. In next List of Values selection screen, select the key figures that you want to display on the SAP BusinessObjects Web Intelligence report by moving the selected values to the right-side panel (Figure 5). When you select values from the list then this screen automatically comes up.

Figure 5
Select the values for the List of Values filter
When you click OK in Figure 5, then your SAP BusinessObjects Web Intelligence report displays only the selected quarter key figures (Figure 6).
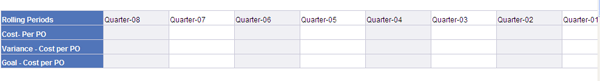
Figure 6
SAP BusinessObjects Web Intelligence report display
How to Display the Values Selected by Users for Various Variables
In most scenarios you have a reporting requirement that users want the values they enter for the report variables to be displayed in the SAP BusinessObjects Web Intelligence report along with the report data. This feature is built into BEx Analyzer, but in SAP BusinessObjects Web Intelligence you have to write a custom formula to achieve this type of display. To do so, follow these steps:
Step 1. Drag a Horizontal Table from the template panel in the report panel on top of your data table (Figure 7).

Figure 7
Drag a Horizontal Table into the report panel
Step 2. Click the formula icon in the toolbar so that the formula bar is displayed. Click the heading cell of the Horizontal Table that you dragged in step 1. Enter the name for the variable that you want to display in double quotes. For example, in Figure 8 you see the display value for the variable called Vendor.

Figure 8
Click the heading cell of the Horizontal Table and enter the name for the variable
Step 3. Click the value cell of the Horizontal Table that you dragged in step 1 in which you want to display the value the user entered for the variable. In the formula bar, enter the custom formula:
= UserResponse("<Name of your Variable>")
Figure 9 displays the value for the variable named Vendor.
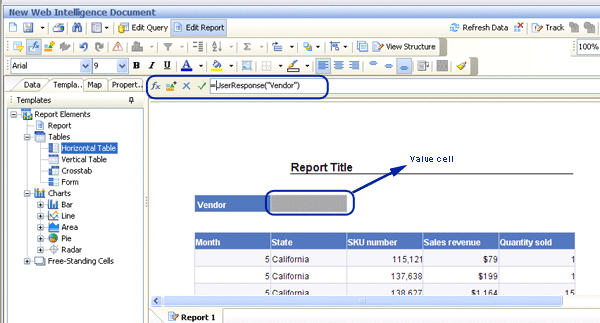
Figure 9
Click the Value cell of the Horizontal Table and enter the formula in formula bar
Step 4. Execute the SAP BusinessObjects Web Intelligence report and you get a prompt to select the value of the Vendor (Figure 10).

Figure 10
SAP BusinessObjects Web Intelligence prompt
After you select the value and refresh the data, you get the desired layout of the report (Figure 11).

Figure 11
Value entered by the user displayed in the Horizontal Table
Similarly, if you want the value -ALL- displayed in the report output if the user does not select any value for the variable, then you can change the formula in step 3 to this:
=If (UserResponse("<Name of variable>") = "";"-ALL-";UserResponse("<Name of variable>"))
Figure 12 displays the value -ALL- in the report if the user does not select any value for the variable.

Figure 12
The value -ALL- displayed if user does not select any value for the variable
If you want to display the range as output for the interval type Time variables, then modify the formula to this:
=UserResponse("<Name of start interval variable> From") + " and " + UserResponse("<Name of end interval variable> To")
Figure 13 shows an SAP BusinessObjects Web Intelligence report with the interval-based variable on Month.

Figure 13
Interval-type variable set to Month
Use the below formula to concatenate and display the range for the interval type month variable:
=UserResponse("Enter Month(Start)") + " and " + UserResponse("Enter Month(End)")
Figure 14 displays the concatenated value of the interval-based variable in the report.
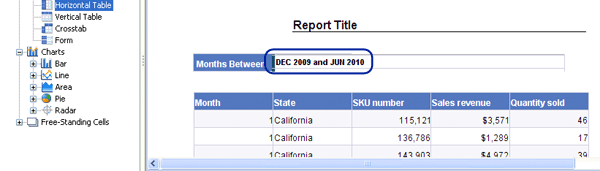
Figure 14
Concatenated variable values displayed for Month
Step 5. To display the heading of any column in the Web Intelligence output report using the variable values entered by user, follow the below method. For example, you may want to add the value entry for the variable Months of Consumption in a measure column with the heading text Surplus Quantity for <x> Months. In such a case, click the column heading and write this custom formula in the formula bar, as shown in Figure 15:
="Surplus Quantity for "+UserResponse("<Name of Variable>") +" Months"

Figure 15
Click the column heading and write the formula in the formula bar
Execute the report and the value that you entered for the variable (Figure 16) is displayed in the column heading (Figure 17).

Figure 16
SAP BusinessObjects Web Intelligence prompt for Month

Figure 17
Value of variable diplayed in the column heading
Isha Gupta
Isha Gupta is an SAP BI consultant in Accenture within its India Delivery Center. She is a subject matter expert with almost five years of experience in BI data model design, development, and reporting. She is a certified solution consultant in SAP NetWeaver 2004 Business Intelligence. She is proficient in various SAP BusinessObjects tools. Isha also has been involved in various SAP BI capability development activities within Accenture, including management of IDC SAP BI reusable assets, thought leadership, planning, and executing various client demos.
You may contact the author at isha.guptas@accenture.com.
If you have comments about this article or publication, or would like to submit an article idea, please contact the editor.