Learn how to format a report created using the SAP Advanced Planning and Optimization (SAP APO) demand planning add-in for Microsoft Excel using the SAP Enterprise Performance Management (SAP EPM) formatting functionality.
Key Concept
The SAP Advanced Planning and Optimization (SAP APO) demand planning add-in for Microsoft Excel is partially based on SAP Enterprise Performance Management (SAP EPM) technology, which was originally developed as part of SAP’s Business Planning and Consolidation (BPC) module. SAP EPM provides connectivity to the SAP APO back end, data retrieval and update services, and formatting functionality for reports.
Formatting the Report Using EPM Formatting
At the end of part one of this article, you had constructed a simple report as shown in Figure 1. This report is functional, but not formatted.
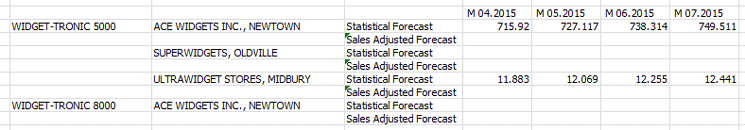
Figure 1
A simple report
To define formats you use a worksheet called EPM Formatting Sheet. This worksheet is created by the add-in automatically in each report, but is normally kept hidden. To show this sheet, click the View Formats button on the add-in toolbar as shown in Figure 2.
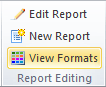
Figure 2
The View Formats button
The EPM Formatting Sheet contains multiple sections, each of which enables you to set the formats for different elements in the report (Figure 3). (Only some of the formatting options are shown in the figure.)

Figure 3
The EPM Formatting Sheet
The different sections enable you to set formats as shown in Table 1.
Section
|
Purpose
|
Hierarchy Level Formatting
|
Controls general formatting for the report
|
Dimension Member/Property Formatting
|
Enables specific formats to be applied to certain types of key figures (for example, editable key figures), certain data states (for example, only to key figures where the data has been changed), specific key figures (for example, Shipment History).
|
Row and Column Banding
|
Enables a banding effect so that alternate rows or columns are formatted differently
|
Page Axis Formatting
|
Controls the formats of the page axis section of the report
|
Table 1
The formatting options provided by the EPM Formatting Sheet section
In my example, you set formats for the two most commonly used sections: Hierarchy Level Formatting and Dimension Member/Property Formatting.
Each section enables formats to be set independently for the cells displaying the data and the headers. Not all sections are enabled by default. To enable a section, ensure that the check box in the section header is selected, as shown in Figure 4.

Figure 4
Enabling a section
Within each section, there are cells that control the formats for the Data (i.e., key figure values) and Header (i.e., characteristic values and column headers) components of the report as shown in Figure 5.
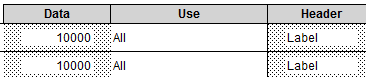
Figure 5
Data and Header cells
The Data cells show a default value of 10,000, and the Header cells show a default value of Label. These cells show you a preview of the formats as they will appear in the report. Setting a new format is as simple as using the standard Excel functions to format the cells, by right-clicking and choosing Format Cells… .
Before you set some formats, look at where the formats will be applied in the finished report. When you constructed your report, you decided to show the Material, Ship-to Customer, and Key Figures in the Row Axis of the report. You set the Column Axis to show the Time dimension. This resulted in the layout shown in Figure 6.

Figure 6
Row Axis and Column Axis report sections
Because your Column Axis section does not contain any key figure values, only the Header cell is needed to set formats for this section. The Column Axis contains both numerical key figure data and column headers, so both the Data and Header cells control the formats here.
Now set some formats as shown in Figure 7.
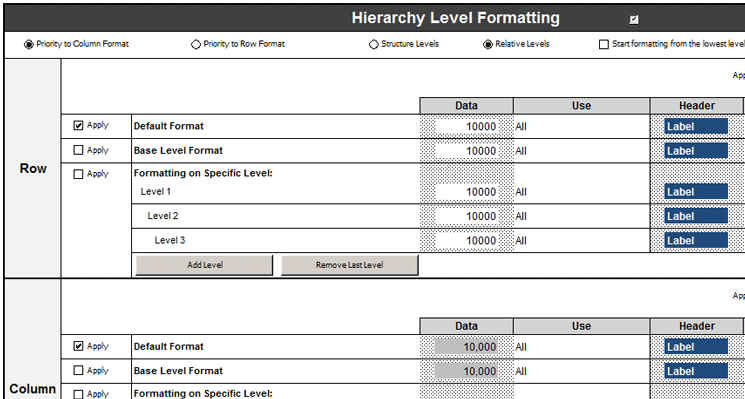
Figure 7
Apply formats
It’s important to ensure that the check box in the section header (just to the right of the test ‘Hierarchy Level Formatting in Figure 7), the Apply check box for Row Default Format, and the Apply check box for Column Default Format are all selected. If they are not selected, the formatting won’t be applied. Once these formats are set, switch back to the Excel sheet containing the report, and click the Refresh icon in the Demand Planning ribbon. The report now displays the formats as shown in Figure 8.
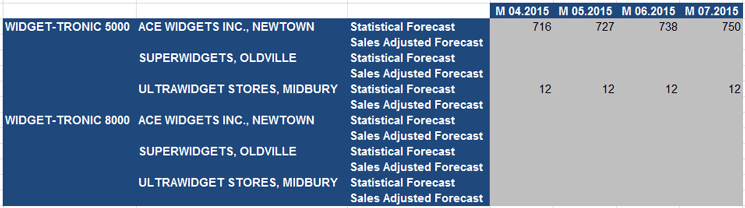
Figure 8
Report with formats applied
Adding Conditional Formatting
The formats you have set so far apply to the respective cells in all cases. It is useful, however, to be able to set formats that depend on more complex criteria. For example, take the Sales Adjusted Forecast key figure. It would be useful to highlight to the users which cells they should use to enter their data. Because the users are collecting their data in a forecasting process, you don’t want them to enter data for past months, so you want to format the cells that are in the future in a different color.
To achieve this, you need to be able to set a format dependent on the period in the column header for the data cell; if the period is in the past, you use the existing gray format, otherwise, you apply a new yellow format to indicate where the user can enter data.
Excel conditional formatting can be used to make the decision whether each cell is in a future or past month, and then apply the format as needed. But before you set this up, there’s an important point to understand about how the EPM Formatting Sheet relates to the report.
As I have explained, the EPM Formatting Sheet is a separate worksheet contained in the same Excel workbook as the report. When the Refresh button is clicked, the add-in reloads the data from SAP APO and then applies the formats you defined. This is, in effect, a process of copying the formats from one sheet (EPM Formatting Sheet) to another (the sheet containing the report). Because the formats are defined in one sheet, but applied in another, you need to construct the conditional formatting formulas in such a way that the cell references in the formula are valid for the report sheet where they will be used, rather than in the EPM Formatting Sheet.
The formula I’ll use is this:
=VALUE(RIGHT(F$5,4)&MID(F$5,4,2))>VALUE(YEAR(TODAY())&RIGHT("0"&MONTH(TODAY()),2))
This formula assumes that the row containing the column headers (and hence the period descriptions) is row 5 in the report sheet, and that the first column containing key figure data is column F. The formula extracts the year and month from the column headers to form a number, and compares this with today’s year and month. If the formula evaluates to True (i.e., the column represents a future month), then the format is applied.
You also want to apply this logic only to the Sales Adjusted Forecast key figure and not to any other key figures in the report. You can use the formatting on a specific member or property option in the Dimension Member/Property Formatting section to accomplish this.
To set this conditional formatting, switch to the EPM Formatting Sheet and scroll down to the Dimension Member/Property Formatting section. Make sure that the check box is selected in the section header and that the Apply check box is selected in the row for Formatting on Specific Member/Property.
Click the Add Member/Property button. Scroll down in the left pane and click Key Figures. Select the key figure you want to apply this formatting to in the right-hand pane and click the OK button. A new row will be added to the EPM Formatting Sheet for the key figure you selected. Select the Data formatting cell for your key figure, and from the ribbon select Home > Conditional Formatting > New Rule.
Select Use a formula to determine which cells to format, enter the formula in the field Format values where this formula is true, set a format for this key figure by clicking the Format… button, and click the OK button. Switch back to the Demand Planning ribbon and click Refresh. The report should now look something like the example shown in Figure 9.
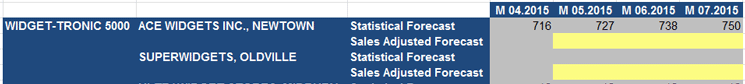
Figure 9
Report with conditional formatting
These steps control the formatting of the report cells, but still allow data to be changed in those cells. If you would also like to prevent a user from entering data into past months, you can extend the logic above to do so.
In the Data formatting cell of the EPM Formatting Sheet, for the key figure you used in the conditional formatting example, right-click and select EPM > Data Validation. In the Settings tab, set the field Allow to Custom and enter a formula that determines whether the cell is editable. The same logic as used in the conditional formatting example above also works here.
In the Input Message tab you can choose a message to be displayed to the users if they attempt to input invalid data. In the Error Alert tab, you can choose to display a pop-up message to the users if they attempt to input invalid data.
The cell just to the right of the Data formatting cell, headed Use, controls which of the formats from this cell are to be applied to the report. This defaults to the value All, but this setting excludes Data Validation. To apply Data Validation also, double-click this cell and ensure that the Data Validation option is selected as shown in Figure 10.

Figure 10
Select the Data Validation setting
At this stage, you have constructed a report to display and edit SAP APO data, and applied simple and complex formats to the finished report. Your report is now finished.
Lessons Learned
In this section, I cover some landscape considerations and tips on dealing with some limitations of the software.
SAP APO Landscape Considerations
It’s a common (and indeed good) practice to have at least three separate instances of SAP APO in the system landscape: Development, Test, and Production. Any SAP APO configuration performed should be created in the Development environment, transported to Test to ensure that it performs correctly, and transported to Production. However, reports defined using the add-in are not handled through the SAP transport mechanism, and it is therefore possible to build reports directly against the Production system once the tool is implemented. I would still recommend that the implementation project follow the three-stage landscape as outlined above.
Use of All Members in Report Definitions
In part one of this article, I showed you how to set the All Members filter option for dimension members (see the “Creating a Report” section of “Report Design from Start to Finish with the SAP APO Demand Planning Add-In for Microsoft Excel.”). It would be natural to assume that selecting All Members effectively removes the filter. In fact, this sets a filter equivalent to a list of all the dimension member values that exist in the connected SAP APO system at the time of report creation.
To work through an example of this, assume that your Development and Production SAP APO systems contain different materials (Table 2). This is a very common scenario, as new materials are typically created frequently in Production, but not necessarily in other systems in the landscape.
APO Development
|
APO Production
|
Report Contents |
Material1
|
Material1
|
Material1
|
Material2
|
Material2
|
Material2
|
|
Material3
|
|
|
Material4
|
|
Table 2
Example values for the Material characteristic
In this case, the result of setting All Members for the Material dimension would result in a filter value that includes Material1 and Material2, as those are the two values present in the Development SAP APO system in which the report was created. As a result, running this report against the Production environment would exclude values for Material3 and Material4.
To avoid this issue, you can refresh the list of possible values from the SAP APO system by selecting the Refresh Metadata option from the Refresh menu of the add-in toolbar as shown in Figure 11.
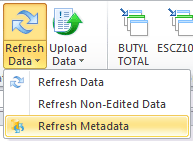
Figure 11
The Refresh Metadata command
How to Handle Navigation Attributes That Are Empty
At the time of writing, the SAP EPM layer is not able to handle dimension members with null (empty) values. However, it is possible to configure SAP APO to use navigation attributes that are null. If the report definition specifies a planning level that includes navigation attributes that have null values, then these records will not be shown in the report.
In this example, the SAP APO database contains the characteristics Material, Customer, and Customer Class as shown in Table 3.
| Material |
Customer |
Customer Class
|
Forecast |
Material1
|
Customer1
|
A
|
50 |
Material1
|
Customer2
|
|
60 |
Material2
|
Customer1
|
A
|
70 |
Material2
|
Customer2
|
|
80 |
Table 3
Example SAP APO data
If you were to create a report that specifies the planning level of Material and Customer, the report would include all data as shown in Table 4.
Material
|
Customer |
Forecast
|
Material1
|
Customer1
|
50
|
Material1
|
Customer2
|
60
|
Material2
|
Customer1
|
70
|
Material2
|
Customer2
|
80
|
Table 4
A report at the Material and Customer levels
However, if you were to create a report that specifies the planning level as Material and Customer Class, the records for Material1/Customer 2 would contain null values for Customer Class and be suppressed. The report would show the data in Table 5.
| Material |
Customer Class
|
Forecast |
Material1
|
A
|
50
|
Material2
|
A
|
70
|
Table 5
A report at the Material and Customer Class levels
To avoid this scenario, you can:
-
Ensure that all navigation attributes have non-null values in SAP APO.
-
Use selections in SAP APO to filter out records that contain null values.
-
Design reports such that navigation attributes containing null values are not included.
This article contains general information only and Deloitte is not, by means of its publication, rendering accounting, business, financial, investment, legal, tax, or other professional advice or services. This article is not a substitute for such professional advice or services, nor should it be used as a basis for any decision or action that may affect your business. Before making any decision or taking any action that may affect your business, you should consult a qualified professional advisor.
Deloitte shall not be responsible for any loss sustained by any person who relies on this article.
As used in this document, "Deloitte" means Deloitte Consulting LLP, a subsidiary of Deloitte LLP. Please see www.deloitte.com/us/about for a detailed description of the legal structure of Deloitte LLP and its subsidiaries. Certain services may not be available to attest clients under the rules and regulations of public accounting.
Copyright © 2015 Deloitte Development LLC. All rights reserved.
Alistair Thornton
Alistair Thornton is a specialist leader at Deloitte Consulting. Alistair specializes in Demand Planning, Supply Planning, and Sales and Operations Planning. He’s been working in this area for more than 15 years, helping some of the world’s largest companies to improve their supply chain planning capability. Alistair’s experience spans the consumer products, food and beverage, life sciences, high-tech, and chemicals industries.
You may contact the author at alithornton@deloitte.com.
If you have comments about this article or publication, or would like to submit an article idea, please contact the editor.