Discover a way to extract the Java source code of an SAP NetWeaver Process Integration PI (SAP NetWeaver PI) message mapping designed with the Java graphic mapping tool in the Integration Repository (XI 3.0 and PI 7.0) or Enterprise Service Builder (PI 7.1x and onwards). By using the extracted code, you can quickly determine what’s delaying your mapping and efficiently design a workaround.
Key Concept
Message mapping is the mapping of source and target messages supported by the graphic mapping editor. The mapping tool generates Java source code from the graphical mapping description, which is then compiled and packed in a JAR file. The Integration Engine executes this Java program at runtime.
In a process integration scenario, the business data could be processed in different systems with different data structures. To map the different data structure of the source system to that of the target system, message mapping is commonly used in the integration scenarios within SAP NetWeaver Process Integration (SAP NetWeaver PI). For example, you could use message mapping to map an invoice with an IDoc format from SAP ERP Central Component (SAP ECC) to the legacy system with a flat file format. The structures of the IDoc and the flat files are different.
During the design phase, there may not be any problem with message mapping. However, the SAP NetWeaver PI mapping program could have a very long execution time and the message could become stuck in the mapping step. For critical interface scenarios, the relevant core business process may also be delayed because of this. For example, a purchase order invoice needs to be sent to the legacy system; otherwise the order cannot be completed. Due to the poor performance of the message mapping, the purchase order processing is delayed.
By extracting the Java source code of the message mapping, you can profile this mapping program and identify the culprit inside the message mapping easily and precisely to figure out a solution with your developer. I will show you the detailed steps for this process using NetBeans, although this process applies to other tools that can profile Java code, such as Eclipse with plug-in. The target audience of this article includes SAP NetWeaver developers, administrators, and consultants.
Infrastructure of the Message Mapping
Figure 1 illustrates the message mapping infrastructure. The system processes messages from step 1 after receiving them from the sender component. For scenarios that do not use the Advanced Adapter Engine (AAE), messages enter the pipeline steps in the ABAP Integration Engine via HTTP in step 2. For scenarios that use the AAE, the AAE processes the messages directly in the Java stack in step 2.
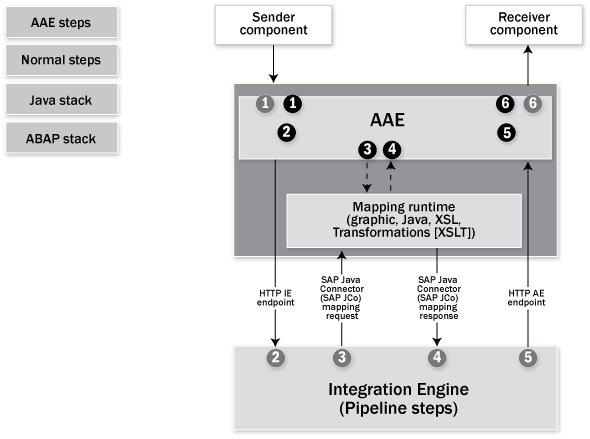
Figure 1
Message mapping infrastructure
In step 3, for non-AAE scenarios, the message mapping request is sent via SAP JCo AI_RUNTIME_JCO from the ABAP stack to the Java stack. For AAE scenarios, the message mapping request is processed directly within the Java stack. For both cases, the message mapping codes are executed in the Java stack. The message mapping program returns the target XML payload in step 4. In steps 5 and 6, messages are delivered to the receiver component via the communication channels.
Note
In the mapping runtime between steps 3 and 4, the system executes the message mapping to transform the source XML payload into the target XML payload so that the receiver component can understand it. This is the main focus in this article. In some cases, you may use ABAP mapping, which requires much more effort during the design phase and provides less functionality. That is out of the scope of this article.
Example of the Expensive Message Mapping
In the following example, I assume that invoice data is sent from a legacy system to SAP NetWeaver PI via the file adapter. SAP NetWeaver PI transforms the invoices from file format to IDoc format and sends them to SAP ERP Central Component (SAP ECC) via the IDoc adapter. The business staff complains about the sluggishness of the processing. After a discussion with the business staff, my team and I have figured out the relevant interface scenario in SAP NetWeaver PI. For simplicity, I define the interface scenario information search for the messages with the following criteria in transaction SXMB_MONI (Figure 2):
Sender Component: ZPRJ_SND
Sender Interface Name: sapprj_send
Sender Interface Namespace: https://xiExercise.com/P71
Receiver Component: ZPRJ_RCV
Receiver Interface Name: sapprj_rcv
Receiver Interface Namespace: https://xiExercise.com/P71
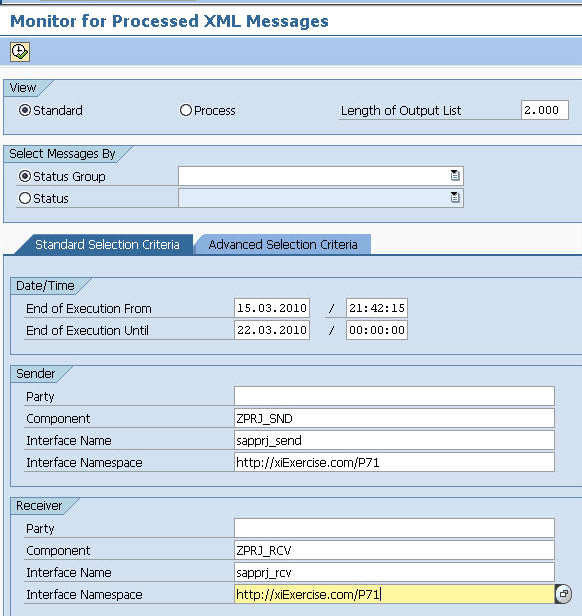
Figure 2
Transaction SXMB_MONI search criteria
In the result in Figure 3, I sort the messages by start time and the queue ID. Exactly Once (EO) messages are normally processed in parallel with different outbound queues, which is controlled by parameter EO_OUTBOUND_PARALLEL in transaction SXMB_ADM. In this example, messages are processed in the XBTOH___000 through XBTOH___0004 queues. Therefore, checking message processing times by queues makes the most sense.
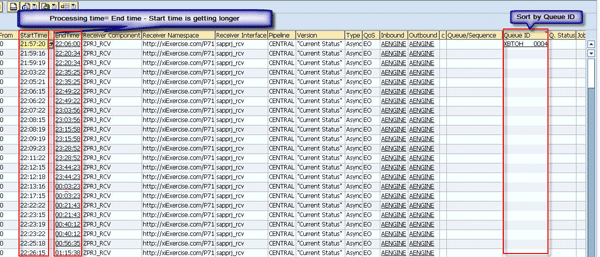
Figure 3
Messages sorted by queue ID
Let’s look into the messages in queue ID XBTOH___0004 (Figure 3). The total processing time for each message is calculated as: Total processing time = End time - Start time.
As you can see, the processing time becomes longer and longer, with the first one taking almost nine minutes (22:06:00-21:57:20) and the last row taking about 169 minutes ((24+01):15:38-22:26:15). In reality, the messages could start very quickly because the system processes messages in queues one after another. The Start Time means when the message was received by the Integration Engine and started processing. The start time between each row is not too long. Packaging is enabled so that you can see some messages completed executing in the same second. This is a result of the long running message mapping step.
Double-click the first message and look at the performance header (Figure 4). The beginning and ending timestamps are recorded for each processing step. For the first message, the total processing time is approximately eight minutes and 40 seconds (22:06:00-21:57:20). The processing time of the mapping step is approximately eight minutes and 10 seconds (20100317210558.078-20100317205748.234). You can see that approximately 94 percent of the time is spent on the message mapping step.
Note
The time clock in the performance header and transaction SXMB_MONI are different because the performance header record uses GMT.

Figure 4
Message PerformanceHeader
Say three messages come into the outbound queue XBTOH___0004 at 22:06:00 and the system processes them via the pipeline steps. The system executes the message mapping in sequence within the queue XBTOH___0004 for each message via SAP JCo AI_RUNTIME_JCO due to the queued Remote Function Call (qRFC) mechanism.
For simplicity, disregard the time spent on other pipeline steps and focus on the message mapping. Provided that message 1 has an execution time (T0) of eight minutes and 10 seconds (490 seconds), the total processing time for message 1 is T1=T0. In an ideal situation, assume the message mapping step costs same amount of time for each message as T0. Message 2 starts as soon as message 1 finishes. Including the waiting time for message 1, the total processing time for message 2 is T2=T1+T0=2*T0. For message 3, the total processing time is T3=T2+T0=3*T0 and so forth (Figure 5).

Figure 5
Message mapping execution time in a qRFC queue
At this point you may ask why you can’t just increase the value of EO_OUTBOUND_PARALLEL to be as large as possible to allow messages to process in parallel and prevent messages from having to wait for one after another. However, queue parallelism controls resource (CPU) consumption on the Integration Server. To optimize resource use, configure the fewest number of queues that allows CPU use at near 100%. Using more parallel queues only overloads the system, uses even more resources, and eventually causes hardware resource bottleneck.
The qRFC scheduler algorithm works efficiently with fewer queues and more entries for each queue. Therefore, the queuing situation is inevitable. For optimal system throughput and performance, the resolution for this is to find the best way to optimize the message mapping program and minimize the execution time.
Extract the Java Source Code from the Message Mapping
At this point, you have identified the culprit of the long processing time. Now you need to dig into the message mapping. As my example is for SAP NetWeaver PI 7.1, log on to the Enterprise Service Builder. According to the interface pair information, you can easily locate the interface mapping and the message mapping as shown in Figure 6. You can see the mapping structures and a list of customized user functions. You can switch to the Test tab and load a source payload for testing. Basically, you get the same result as the mapping pipeline step during runtime. However, it does not provide you that much information or any hints to make improvement for the message mapping or user defined functions.
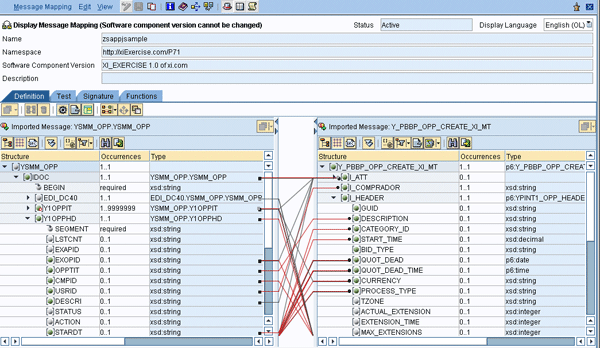
Figure 6
Message mapping in Enterprise Service Builder
If you put the cursor in the Description field and press Ctrl – Shift - 0, the screen in Figure 7 appears, which allows you to export and import the message mapping locally as an .xim archived file. The archive includes the data structures (source message and target message) of the message mapping and the Java source code of the message mapping program. You can use WinZip or WinRAR to open the .xim archive file.

Figure 7
Export the message mapping in Enterprise Service Builder
Dig into the ZIPPED_SOURCE_CODE.zip file, to view a file called value inside the archive (Figure 8). Extract the file value to your local disk and open it with a text editor such as Notepad or WordPad. Now you should be able to see the Java source code of message mapping as shown in Figure 8. To comply with the Java language definition, rename the file value to the class name, which should be the same name as the message mapping. Because the Java class named with package com.sap.xi.tf, put the Java source file in directory …comsapxitf.
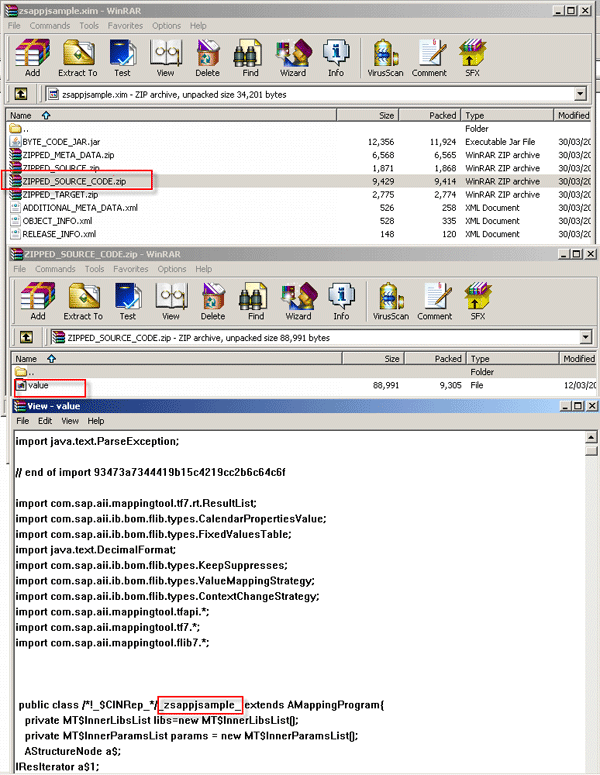
Figure 8
Dig into the message mapping for the Java source code
In the next part, you prepare the message mapping Java source code. You use this source code later in the process to create a Java project with existing sources in NetBeans.
Profile the Extracted Message Mapping Java Source Code in IDE NetBeans
To set up the integrated development environment (IDE), you need to download from the NetBeans IDE download page. Select the simplest version with just Java SE support. JDK 6 or JDK 5 has to be installed before you install and run NetBeans. You can download standalone JDK or the latest JDK with NetBeans IDE Java SE bundle. Installing NetBeans is quite simple, so I don’t provide the details for this part of the process.
To profile the extracted message mapping Java source code to identify which piece of the coding causes the long running time, you need to have necessary SAP NetWeaver PI mapping Java libraries from your SAP NetWeaver PI system or you can download the Support Pack Stack and extract them.
For SAP NetWeaver PI 7.0, you can find the files under directory …j2eeclusterserver0appssap.com:
aii_ib_core.jar
aii_ib_rb.jar
aii_ib_sbeans.jar
aii_ib_server.jar
aii_ibrun_rb.jar
aii_ibrun_server.jar
aii_map_api.jar
For SAP NetWeaver PI 7.1, you can find the files under … j2eeclusterappssap.com:
com.sap.aii.utilxi.core.jar
com.sap.xi.flib.lib_api.jar
com.sap.xi.mapping.tool.lib_api.jar
com.sap.xpi.ib.mapping.lib.jar
sap.com~tc~bl~guidgenerator~impl.jar
sap.com~tc~exception~impl.jar
Copy all the .jar files into your directory …lib to allow the project to use the libraries for both SAP NetWeaver PI 7.0 and SAP NetWeaver PI 7.1.
Step-by-Step Process
In the following steps, I illustrate how to create and profile the mapping project step-by-step with screenprints.
Step 1. Open NetBeans and create your project. Your message mapping Java source code is all set. Click File > New Project to create a new Java Project with Existing Sources project under the Java category as shown in Figure 9. Then click the Next button to continue.
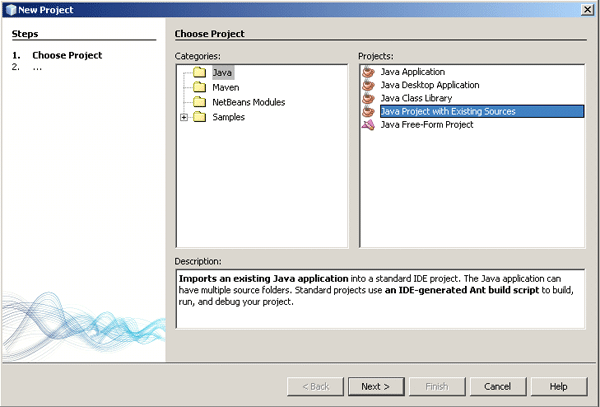
Figure 9
Create a new Java project
Step 2. Choose a location to store the project and name it as shown in Figure 10. The system creates a new folder with the project name automatically. Keep the default options and click the Next button.

Figure 10
Locate and name the project
Step 3. Select the source directory in which you have extracted the source code from the message mapping as shown in Figure 11. Click the Add Folder button to browse the source directory as shown in the small window on top. Then click the Open button to view the source code (Figure 12). Click the Finish button to create the project.

Figure 11
Select the source code directory
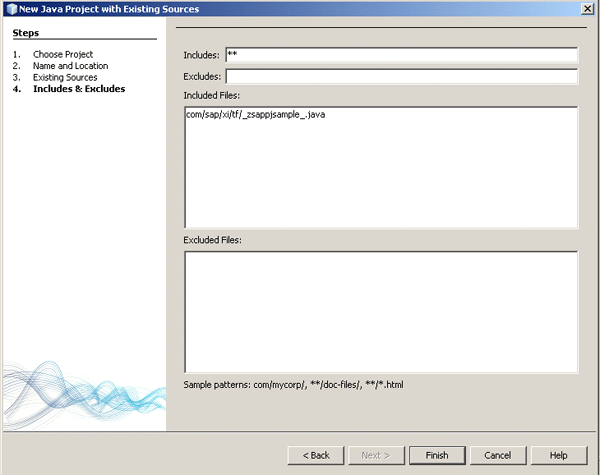
Figure 12
Include the Java source Code
Step 4. After you create the project, add the required Java libraries to it by right-clicking Libraries on the left side of the screen and selecting Add JAR/Folder…from the context menu. Select all the .jar files listed earlier prior to the steps and click the Open button. For simplicity, I added both Java libraries for SAP NetWeaver PI 7.0 and SAP NetWeaver PI 7.1x in the example in Figure 13. This allows you to profile the mappings for all versions. After you add the .jar files, the error indicator on the Java source code disappears.

Figure 13
Add the Java libraries
During runtime, the system accesses the aii.properties that contain the same parameters and values as in the profile. To avoid a runtime error, you need to add the file aii.properties to the project file directory. In SAP NetWeaver PI 7.1x, you can obtain the content of the properties via the URL
https://<host>:<port> /webdynpro/dispatcher/sap.com/com.sap.xi.adminweb/AdminApp.
Click the Aii Properties link and the contents appear in the right frame as shown in Figure 14.

Figure 14
Content of aii.properties
Copy and paste the content in Figure 14 to the aii.properties file. Modify the aii.properties file and add an equals sign (=) and spaces between the parameter and value as shown in Figure 15.
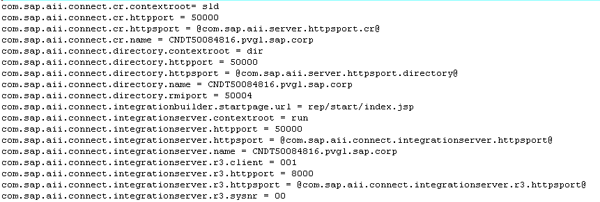
Figure 15
Modify the content of the aii.properties file
Step 5. Run the mapping program. To do this, you need to obtain the source xml payload, which you can download from transaction SXMB_MONI. You need to place the xml payload in the c: directory with the name src.xml because the mapping program will try to access the payload there during runtime (Figure 16). Open the message from SXMB_MONI and expand the Inbound Message node. Under the Payloads node, right-click the document and select Download to save the xml payload to c:src.xml.
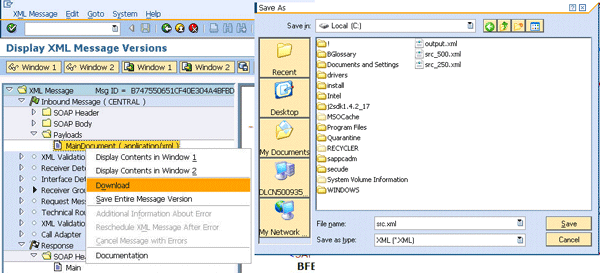
Figure 16
Download the xml payload
Step 6. Now everything is ready for the profiling. Go back to the NetBeans project window, right-click the file _zsappjsample_, and select Profile File from the context menu to start the profiling. Window 1 appears. In window 1, Click the Edit filter sets link to add the Java core, W3C.org, and XML.org classes as inclusive. Click the OK button after this is done as shown in window 2 (Figure 17).
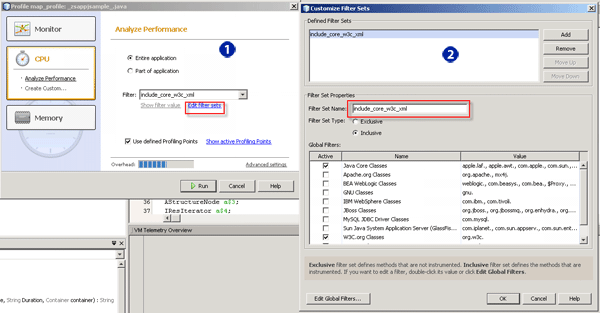
Figure 17
Add the Java Core, W3C, and XML classes for profiling
Step 7. Click the Run button to run the profiling. You can view the live results as the profiling runs. Figure 18 shows the final result.

Figure 18
The profiling result
As you can see in the results, 85.1 percent of the time out of the total three minutes and 15 seconds was spent on the method convertAttContentToAscii. This belongs to the user-defined function convertAttContentToAscii. Now you have identified the culprit. Looking into the code inside method convertAttContentToAscii, you can see that simple concatenations are used by String output and string outputAscii (Figure 19). This is a known issue in Java development. Because String is immutable, using StringBuffer instead of string enables you to gain significant performance improvement in simple concatenations.

Figure 19
String is used heavily for concatenations
Step 8. Without changing any logic of the message mapping program, use StringBuffer instead of String. After the change, profile the mapping program again. You can see the result as shown in Figure 20. Comparing with the previous program, the execution time of method convertAttContentToAscii reduces from 129742 ms to 9733 ms. The total execution time of the whole mapping reduces from 152470 ms to 31018 ms. Now the mapping program is tuned to be fast enough.
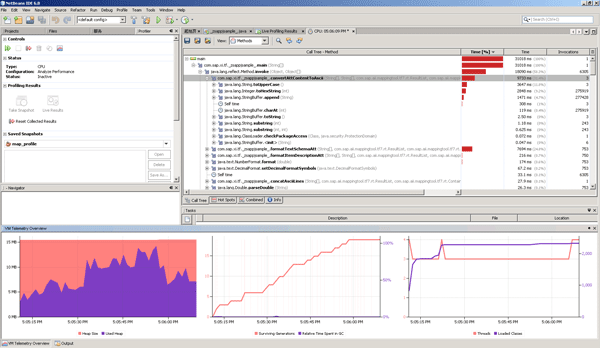
Figure 20
Program performance improves significantly after tuning
Step 9. Return to the user-defined function convertAttContentToAscii in Enterprise Service Builder. Change the code to use StringBuffer instead of String (Figure 21). Save and activate the change.

Figure 21
Change the code in the user-defined function
Send the messages again to SAP NetWeaver PI. As you can see in transaction SXMB_MONI, now the messages processing time reduces from tens of minutes to seconds (Figure 22).

Figure 22
Messages are processed much faster after the tuning
Aaron Long (Huaqiao Long)
Aaron Long is a senior SAP consultant specialist in SAP NetWeaver PI at SAP Active Global Support (SAP AGS). He is responsible for helping customers implement and operate their SAP solutions at their maximum potential and to manage their technical risks during solution implementation and operation. He has been working in SAP AGS for about 10 years.
You may contact the author at aa.long@sap.com.
If you have comments about this article or publication, or would like to submit an article idea, please contact the editor.