3 minute read

Meet the Experts
Key Takeaways
What you need to know
SAP IBP can sometimes fail to deliver results to the clients due to bad implementation practices.
Companies should analyze case studies of a client that achieved their goals.
Users should establish generic guidelines on how to achieve and use data science to improve demand forecasting capabilities using SAP IBP.
The rise of AI, machine learning, and data science are certainly hot topics. Significant media attention has been paid to solutions such as ChatGPT, MidJourney, Dall-E, and how the IBM Watson division was resurrected from the dead.
SAP is part of the leading software providers that are bringing practical applications to industry to manage stochastic processes or processes that evolve over time in a probabilistic manner. Also, SAP introduced the concept of Probabilistic Supply Chain into its SAP IBP product in the current and future versions with adaptive and very powerful algorithms for large data sets. Certainly, AI has been around within the SAP landscape for a while with extremely powerful algorithms in the SAP BW-Data Mining suite and SAP HANA PAL library as I wrote some time ago in this article.
When choosing products such as SAP IBP, Data Intelligence Cloud, HANA Predicted Analysis Library (PAL), SAC, and other products, users should consider:
Explore related questions
Ask SAPi
- Choose the right tool for your problem. Dall-E can help you create a picture of your boss in Egypt with Dua Lipa and Taylor Swift, but it is not the right tool to resolve your inventory problems or pay for your container to be released by pirates in Yemen using Bitcoin. Do not blame me if you do the Dall-E picture and you send it.
- Scope and type of problem you want to resolve. If someone wants to implement SAP IBP in a large beverage brand, but the sales difference is still 550 million Euros in Europe Region alone, (true story) and the SAP IBP architect saying this is normal and the project manager believes him, this requires a specific solution.
- Level of accuracy (or margin of error) and control you would like to have in the models. If you want to forecast the US lottery Powerball numbers with 100% accuracy, good luck!
- How you want the data reported and what data sets must be affected by the algorithms. If you want to monitor retail sales per point of sale using an SAP IBP forecasting model with at least 80% accuracy, yes this is possible.
- Choose the right performance indicators (KPIs) for your Model. For example, imagine you are working with a large tech company to manage their calling centers when you ask the manager what are her KPIs to be successful. She says “headcount and number of hours available for the week per person” instead of number of customers served per hour, number of customers per hour that arrive to the queue and the average number of customers waiting in queues, and other factors.
- Keep your analysis simple: it is important to know your goal, your inputs and expected outputs, and the most important keep it simple so you can explain it to management. If management cannot understand your analysis nobody wins. Like Picasso said, “simplicity is the ultimate sophistication.”
These and many more elements will help you jump into Data Science models like they are the holy grail or the wild west these days. In this article, we will focus on SAP IBP product, but similar analysis can be performed using other SAP products since they share similar algorithms, but also the concept of SAP Probabilistic Supply Chain as shown in Figure 1 will impact exclusively SAP IBP to expand and enhanced its capabilities in the upcoming releases with best of breed tools.
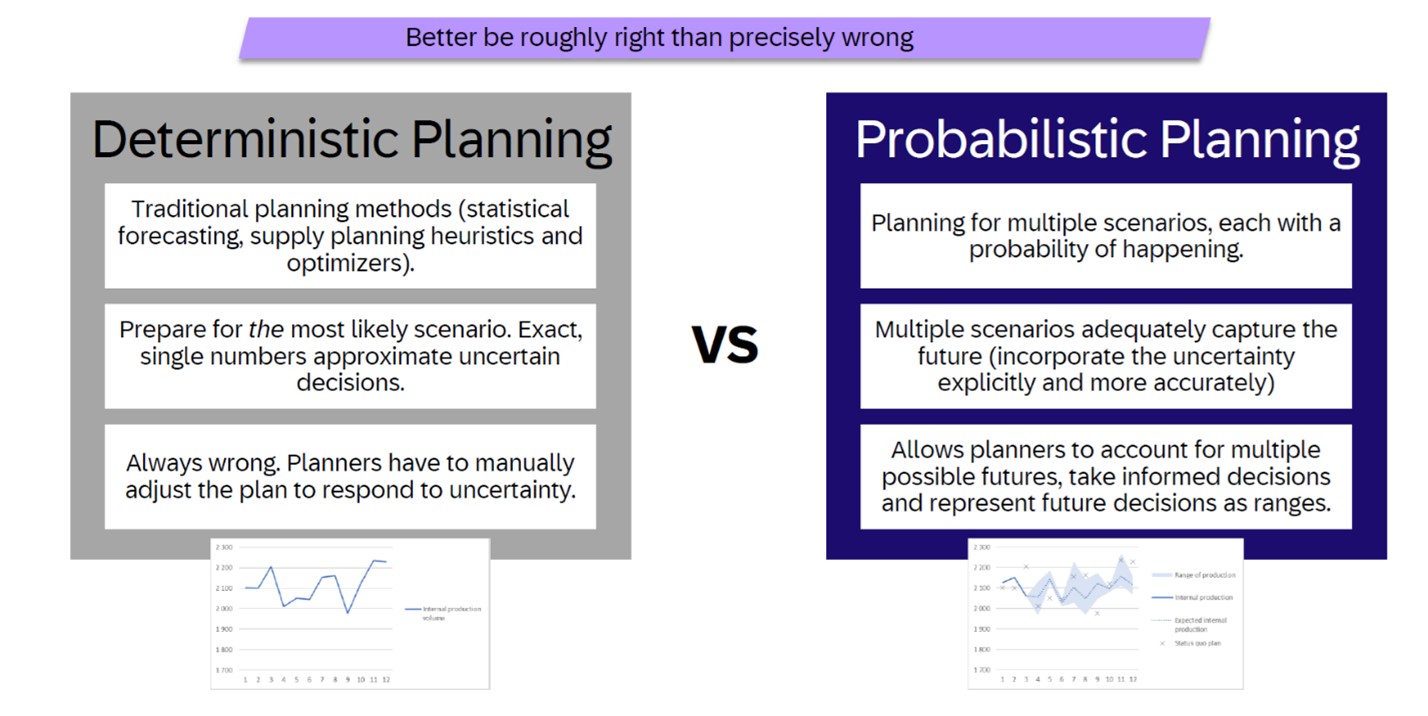
Figure 1— SAP IBP Probabilistic Supply Chain. Source: SAP.com for SAP IBP 2402
An important concept to remember is humans must be in control of the system, product, algorithms, models, or anyway you call your AI, machine learning, or data science efforts. The moment humans are not in control of the system, no Skynet again, your data quality outputs might not be as accurate if algorithms do not react or react too fast to change in the time series.
For example, the financial industry uses high frequency trading algorithms to manage buying and selling choices in seconds. But this is not a guarantee the fund will outperform the S&P 500 index for the year without self-correction or periodic evaluation of patterns and trends. Yes, these days the algorithms can do this themselves and write their own self-correcting code.
Certainly, computers are useful to analyze fast massive amounts of data. However, they still need humans to judge and help adjust the outputs periodically. Once the rules have been implemented and model parameters validated, they can generate massive results, good and bad, if left unattended. This reaffirms that the data quality you feed the algorithms is the same quality of data you will get out. Alerts and threshold indicators can also help you to monitor the short-term and long-term accuracy of your models using SAP IBP Analytic Stories. Information about this topic is available in this article.
With great power also comes great responsibility
Like your friendly neighborhood Spider-Man, if you can process more data fast and lots and lots of it, you can do lots and lots of damage if you are not careful. For that reason, having experts in model building and data analysis is key. Certainly, Arellius Enterprises can help you with even current implemented systems to get the most out of them with SAP IBP and other tools with carefully planned data science scenarios. The challenge with this higher level of planning is lots of new data will be generated and this requires analysis in new ways. You must trust that you did the right thing to communicate your conclusions to management to make tough decisions with the most accurate manner.
The other danger that comes into play with so much data, that you assume behaviors in your data that do not exist or that you have analyze them partially. A clear example in SAP IBP is that analysis by Product is the same conclusions as Product and Customer, and Product Type and Customer. For the untrained analyst or architect, it makes total sense. For the expert eye, these combinations certainly change the behavior of your time series and the type of algorithms to use and the accuracy levels.
It is extremely common these days that SAP IBP architects do not properly validate and test their data assumptions when managing billions of records. This causes, for example, a mismatch of 550 million Euros per year in the sales forecast for a large beverage company or inventory levels 90% higher than really required for an oil & mining company.
Also, in another project in the pharmaceutical industry, the leading architects tried to create measures for all elements of the supply chain with huge data volumes of useless data. This compromised the CPI-DS data loads and SAP IBP box performance. Demanding that the business “controls data volume” is unfortunately more common these days than you think.
For another example, a consulting company used the pre-delivered forecasting value in the algorithms. This made the client responsible for why so many beverage products and ingredients were over-forecasted in the USA and Brazilian plants. Management concluded SAP IBP could not do the job and prefer to upload or input the forecast data manually.
Winning the Imitation Game with SAP IBP
During World War II, Alan Turing joined England ‘s cryptography team on a top secret operation for the allies in Bletchley Park. The task was to decode the messages generated using the “Enigma” machine. For the first time humans competed against a machine in order to shorten the war and save human lives with a code considered to be unbreakable created by Arthur Scherbius a German Electrical Engineer. The problem was the Enigma machine had 158,962,555,217,826,360,000 (nearly 159 quintillion or about 67 bits) combinations that changed daily, meaning next morning’s code combinations will not be the same as the previous day’s code. The Enigma machine managed all military communications including U-boats, aircraft, attack ships, tanks, and more. Cracking this code will save thousands of lives since the allies could anticipate enemy movements.
Turing was the first person in history to realize that only a machine can defeat another machine, and humans are incapable of resolving extremely complex problems in a short time.
In supply chain we have a similar task: bring your operations to a cloud solution that has good data. Certainly, top management would be skeptical of a machine making decisions. In this case, the task was how a company using Excel sheet planning with multiple versions spread across finance, supply chain, inventory, and marketing can be beaten using SAP IBP Yes, this is what makes me happy. On top of that, two Big Four consulting firms failed to resolve this. As shown in Figure in 2, the initial results after consolidating and evaluating the Actual vs Forecast values with a difference of over 7 million units on an over-forecasting cost of $85 million for 2023 across the world while consolidating over 100 MS Excel sheets, since of course that’s the best way for the client today.
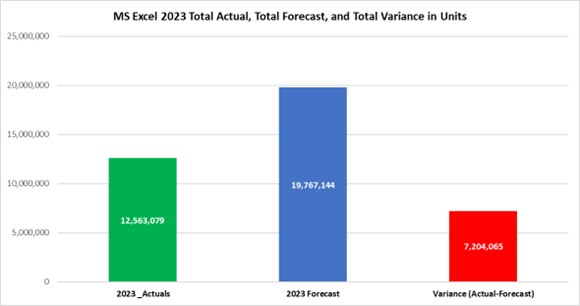
Figure 2— MS Excel Sheet evaluation of Over-Forecasting
As shown in Figure 2, clearly the client had a serious problem. They were aware of it, but they had no trust in forecasting algorithms and the performance of SAP IBP in the past was not satisfactory. The Director of Marketing was open to the idea of data science and utilizing a platform to resolve this complex imitation game, with a system more user friendly than Python since ultimately the end-users expected MS Excel sheets, and not Google Sheets. In addition, we used the WMAPE error measure since it is highly used in operations to manage variables that can be zero and it is way better than MAPE due to the infinite error (divide by zero) is removed.
Another possible option is the SPEC error measure. It considers the costs that may arise from errors in the forecast, as a forecast that is too low may result in understocking and potential losses of sales, while a forecast that is too high may result in overstocking and unnecessary stock-keeping costs.
We chose WMAPE and Figure 3 shows the overall total forecast WMAPE value for all MS Excel sheets consolidated Actuals vs Forecast. As shown in Figure 3, the overall company WMAPE 95% error is just alarming. After we finished our optimization models with SAP IBP, we integrated the different areas with a single Key Figure that stored all the actuals and another Key Figure for the Forecast, plus many hours data cleansing, validation, and yes mathematical wizards did something incredible… we were able to achieve an overall company WMAPE of 12% or 1-Wmape = 88% accuracy!
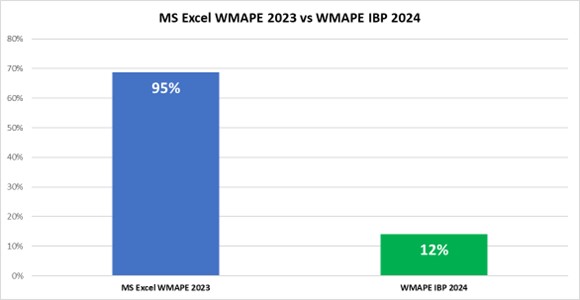
Figure 3— Overall company WMAPE using MS Excel vs IBP WMAPE
On top of this, we focused to beat the current “machine” which was the MS Excel process, and Figure 4 was created to analyze the top five key scenarios the client wanted to evaluate and compare the WMAPEs by Product Categories with MS Excel. If Figure 3 did not catch the attention of top management, certainly Figure 4 did. Scenario 1 shows that group of algorithms is the one represented in Figure 3. We were looking to optimize other algorithms to focus to reduce other areas of variability to increase the accuracy at different reporting dimensions. Notice in Figure 4, the red represents the current WMAPE per Product Categories in MS Excel, and using a chart we can analyze the impact of different groups of algorithms to reduce the WMAPE value with Scenarios. Remember the lower the WMAPE value better or more accurate your results are, and this is a leading indicator not the only one.
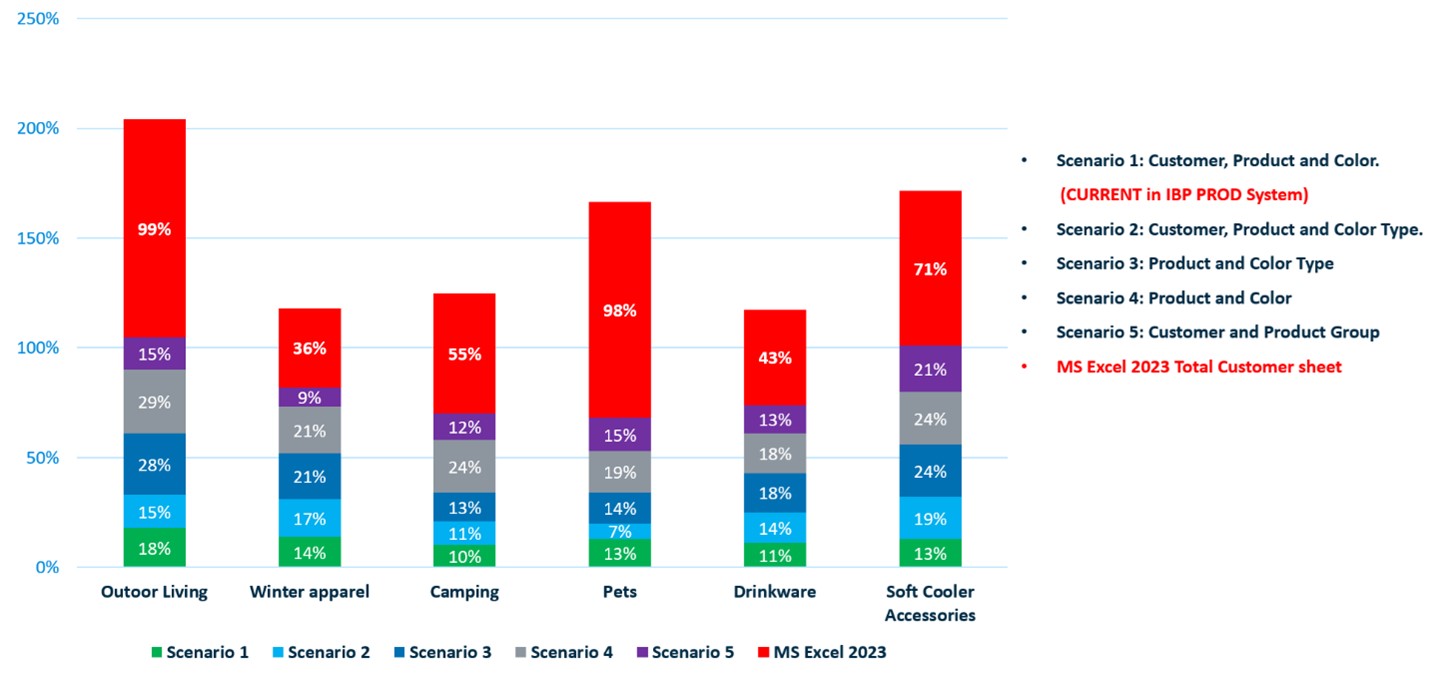
Figure 4— Evaluating Algorithms per Product Categories SAP IBP vs MS Excel
As we continue the work, and the analysis we were able to reach specific product level combinations as shown in Figure 4, and with implementing different algorithm parameters and combinations we were confirming that our algorithms were tracking, responding, and adjusting to changes of seasonal demands. We focused on the star products to have early wins with managements the ones with more revenue or volume or both. Remember, we are still trying to prove SAP IBP capabilities vs MS Excel manual planning, and charts truly help, and again I recommend explore SAP IBP Analytic Stories. I wrote an article about it here.
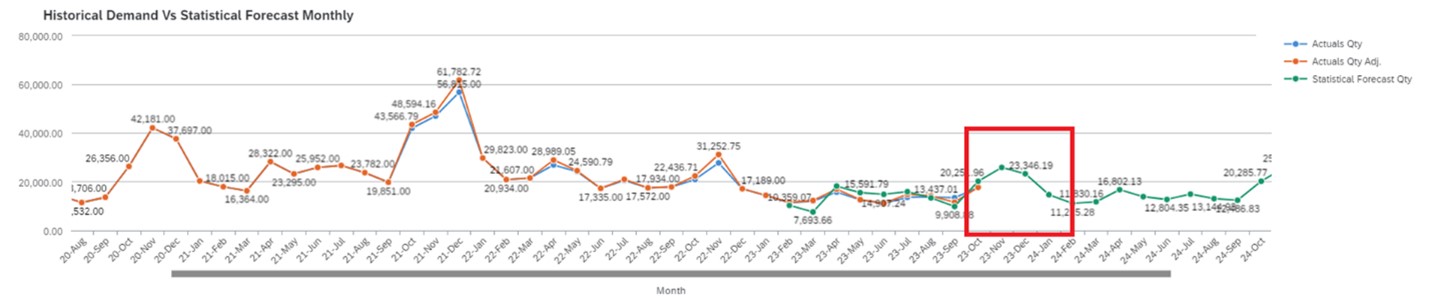
Figure 5— Analyzing Algorithms by Product
Algorithms do not always perform as expected for all product combinations, since the time series and behavior changes. The algorithms needed to be more focused and the patterns that required controlled were more sophisticated as shown in Figure 5. Data quality was an ongoing issue, since not all POS Customer data was reliable, but if we had reliable data and major forecasting gaps, we had to find a solution and new mathematical analysis was required and implement it to resolve the discrepancies.
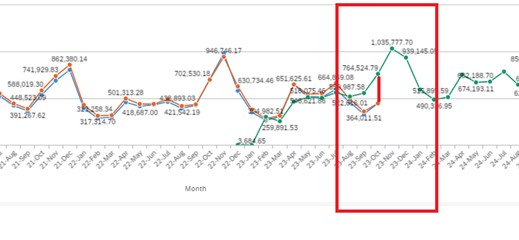
Figure 6— Identifying Algorithms inconsistencies.
Finally, Figure 6 provides a complete view for the European Region and how all the different forecasting values from all the algorithms contributed to a more efficient forecasting engine using SAP IBP. Notice that we have a limited time period that the algorithms must be trained, with zero and negative values, and the seasonality is massive as well. We are extremely pleased that we have reduced Actual vs Forecast differences to less than 3% for European region so far. We also implemented a series of reports to track seasonality trend changes per product, and ABC/XYZ segmentation reports including new product introduction, active and end-of-life products.
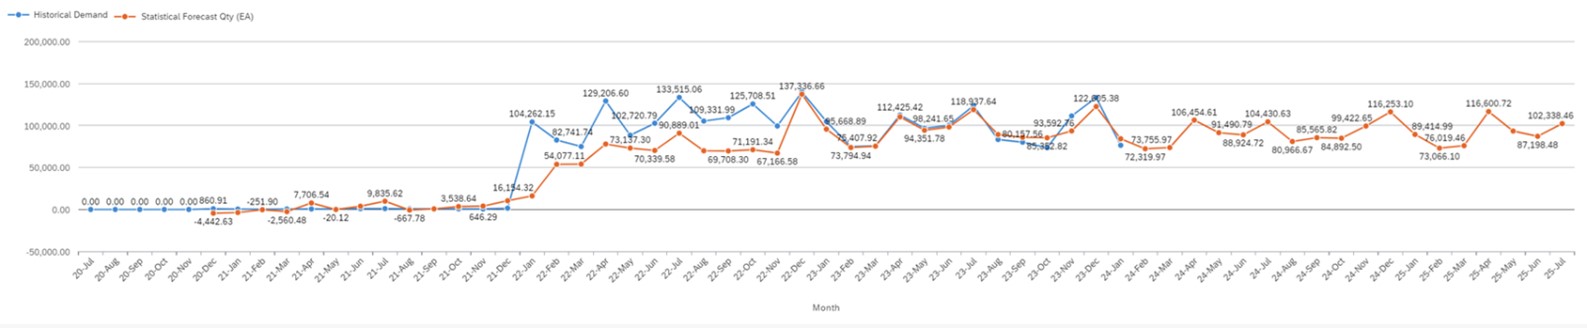
Figure 7— Overall European Region Demand Actual vs Forecast.
The secret sauce
At this moment, our team has completed the initial stage of algorithm optimization, and we were extremely impressed with the results achieved. I never expected the improvement to be so significant, but I was confident we could deliver the project based on our experience working SAP IBP best of breed algorithms. Here is where I cannot tell you the secret sauce, what algorithms and their parameters or strategy used to achieve these results since certainly it is where many implementers fail. You can reach out to Arellius Enterprises and see if we can work our magic and help you to achieve something similar.
However, I can say that SAP IBP Forecasting algorithms supported as of Q1 2024 are the ones listed below. Their efficiency and accuracy not only depend on WMAPE values among other factors and combining them can also provide mixed results. SAP is introducing the XGB algorithm in Q1 2024 to provide an alternative to extreme gradient boosting with machine learning capabilities for short term planning at the week level, and many other algorithms are being enhanced with a confidence interval so you will have a forecasted value within a confidence interval based on historical data. The complete list of SAP IBP algorithms available and additional capabilities with external systems such as Amazon or FB Prophet are listed below:
- Adaptive-Response-Rate Single Exponential Smoothing
- Auto-ARIMA/SARIMA
- Auto-ARIMAX/SARIMAX
- Automated Exponential Smoothing
- Brown’s Linear Exponential Smoothing
- Copy Past Periods
- Croston Method
- Daily Disaggregation Optimization
- Croston TSB Method
- Demand Sensing with Multiple Linear Regression (Full)
- Demand Sensing with Multiple Linear Regression (Update)
- Demand Sensing with Gradient Boosting
- Double Exponential Smoothing
- External Algorithm
- Gradient Boosting for Decision Trees
- Multiple Linear Regression
- Seasonal Linear Regression
- Simple Average
- Simple Moving Average
- Single Exponential Smoothing
- Triple Exponential Smoothing
- Weighted Average
- Weighted Moving Average
- Demand based Curve Forecast
- XGB- Extreme Gradient Boosting Algorithm, as of SAP IBP 2402
- API Interface- using open-source algorithms real-time integration. Example: FB Prophet running Amazon AWS, Rstudio, and Python
Conclusion
I am super excited to deliver massive results to a client that struggles with its planning and cost management, which is what technically SAP IBP has been created to do – to make your work and life better not worse. This case is so new at the time of publication in Q1 2024, we are still creating more detailed algorithms by product, region, product category, product family, customer, and customer segments. That way, we can improve the numbers reviewed by Marketing, SAP IBP Supply and Inventory modules, and Finance with best of breed algorithms and lots of math and charts. Now SAP IBP has become their “Christopher,” or the name Alan Turing called the machine he created to decode the Enigma and secretly win the war.
We are saving a client millions of dollars by improving their forecast accuracy and helping them gain control of their supply chain with advanced machine learning methods, and yes statistics.
Our algorithms manage over $2.5 billion us dollars per year in revenue with 12% error, or 88% accuracy! With product, market, segment, product type, and other secret criteria to focus and improve the behaviors of the time series identified. Again, these numbers must be monitored and evaluate how the different products are affected for changes in seasonality, end of life, data quality per customer but it is way better than before when planners were scrambling to come up with an estimated value to plan the future. That’s what makes me wake up every morning with exciting problems to resolve, and that’s why SAP software is so good at when used correctly.
We have improved accuracy significantly from a Revenue Planning perspective to provide more reliable Demand Forecast which is the key indicator from a financial perspective since any other modules in SAP IBP and their values do not make it to financial planning. Yes, demand quantities certainly impact taxation, revenue, COGS, COGM, Supply, Inventory, headcount, production, and much more. Reach out to Arellius Enterprises to know more, and we will be happy to help you to address your complex data science needs, and Big Four companies yes we are here to help you also we always do.
More Resources
See All Related Content
From Protocol to Patient: How UST Is Supporting Clinical Supply Chain Modernization with SAP ICSMClinical supply chain management in life sciences demands real-time alignment between protocol-driven trial activity and SAP-based supply execution. UST implemented SAP Intelligent Clinical Supply Management (ICSM) at PTC Therapeutics, integrating IRT data with SAP S/4HANA to create a unified planning environment that reduces manual intervention and improves global site-level visibility.

AI Is Moving Supply Chains from Reactive Execution to Autonomous OrchestrationAt SAPinsider Las Vegas 2026, Hernan De la Torre from KPMG US discussed how AI is transforming supply chain operations from reactive systems to Neural Supply Chain Orchestration (NSCO), emphasizing the need for coordinated, real-time decision-making across connected systems rather than isolated technology deployments.
5 minute read

Balancing Demand Volatility with SAP IBP Dynamic Planning CapabilitiesRetail demand volatility is making traditional historical forecasting obsolete, and SAP IBP helps retailers respond with unified dynamic planning, real-time demand sensing, scenario modeling, and cross-functional alignment across demand, supply, inventory, and finance.
3 minute read