Manager
Set up Business Process Monitoring in SAP Solution Manager specifically to monitor batch jobs logs of exceptions and errors.
Key Concept
SAP batch jobs can play a very important role in making business processes function well. It is important to know all batch job exceptions, not just batch job cancellations, but also any other errors. Using Business Process Monitoring in SAP Solution Manager, it is possible to be alerted to these batch job exceptions.
Batch jobs are vital for those of us working in IT. Preventing errors and providing fast resolution in case of errors can be key. Using Business Process Monitoring (BPM) in SAP Solution Manager gives you several options to monitor business processes. One of these options is related to monitoring batch jobs. Even within that area, you have several options, including monitoring of batch job duration, out-of-time window, start delay, cancellation, and job log content.
In this article, I’ll focus on the monitoring of job log messages using BPM. Such monitoring allows you to save time and money by reacting quickly to batch job problems, which are key in supporting your business processes. I’ll start by discussing the prerequisites that need to be met before you can set up BPM. Next, I’ll show you how to set up BPM to enable monitoring of batch job log errors. Finally, I’ll show you how batch job monitoring works and what it looks like in operations mode.
Prerequisites to Using BPM
To be able to use BPM, you need to:
- Create a new user
- Create a new Remote Function Call (RFC) connection
- Create business processes in a new solution
Create a New User
To enable the use of BPM in SAP Solution Manager, you need to create a new user in SAP Solution Manager. I’ll use an example system user called SM_BPMO. This user needs the following authorization, so you need to copy the following SAP standard roles to customer-specific roles via transaction PFCG, and assign those to the user via transaction SU01:
- SAP_S_CSMREG
- SAP_SUPPDESK_CREATE (required for automatic creation of Service Desk messages)
- SAP_IDOC_EVERYONE (required to trigger automatic notifications, such as emails)
Ensure that this user’s personal time zone corresponds to the system time zone. To do this, use transaction SU01, go to the Defaults tab and then go to the Personal Time Zone of the User field.
Create a New RFC Connection
You create a new RFC connection by using transaction SM59 (Figure 1). Before moving forward, however, let’s go over the technical background information from an SAP perspective.

Figure 1
Example of new RFC connection
SAP Technical Background
Data collection monitoring in the satellite systems is triggered by the AutoABAP program SAPMSSY6. It runs in client 000 of SAP Solution Manager and is executed by the standard user SAPSYS. This user is not authorized to call other systems by RFC, and cannot collect data in parallel by RFC, so use the RFC destination BPM_LOCAL_500 (created during BPM setup in SAP Solution Manager). This RFC destination points from client 000 to client 500. The task of calling the satellite system and triggering data collection here is transferred to the user maintained in the RFC destination BPM_LOCAL_500. This user must have the necessary authorization (profile S_CSMREG).
Create Business Processes in a New Solution
To create a new solution, use transaction DSWP (Figure 2). Click the Create button to bring up the screen in Figure 3.

Figure 2
Overview of existing solutions

Figure 3
Create a new solution
Use transaction SOLMAN_DIRECTORY to add business processes (Figure 4). Alternatively, you can copy processes from a project into the newly created solution. The Status of the business processes should be Production so you can use them in BPM.

Figure 4
Business processes set up in a solution
Set Up BPM
Now I’ll go through separate steps to show you part of the setup of BPM.
Part of a Solution
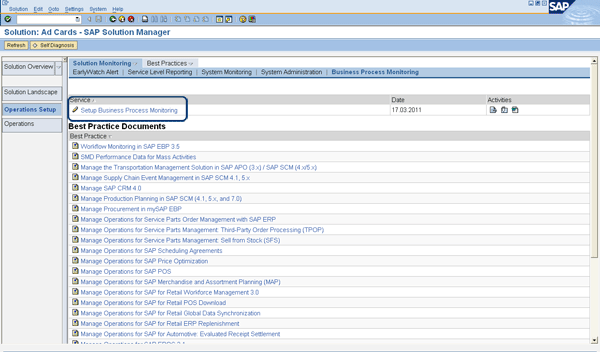
First, use transaction DSWP and select a solution in which the BPM is needed (Figure 5). Then click the Setup Business Process Monitoring link (Figure 6). This brings up the screen in Figure 7.

Figure 5
Select a solution to start setup of BPM

Figure 6`
Click Setup Business Process Monitoring to start the setup

Figure 7
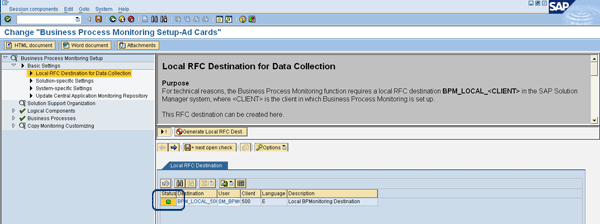
Check if the RFC connection is working
Basic Settings
In the beginning, you added the RFC connection with the appropriate user, so in the screen in Figure 7 you need to check that the green light appears. Click the System-specific Settings text on the left to see the help text on the right (Figure 8). For certain BPM scenarios (e.g., if you require different periodicity of data collection), you might need to make changes here, so make sure you read the help text.

Figure 8
Check if you want to change the default System-specific Settings
For this example, you do not need to load the monitors from the managed system in the Update Central Application Monitoring Repository (Figure 9).

Figure 9
Check if you need to load the monitors from the managed system
Solution Support Organization
Click the Solution Support Organization node to see the screen in Figure 10. You do not define a Solution Support Organization yet, because it is not necessary for the functioning of this example. In reality, you might want to store this information here, to guarantee a swift and sound follow-up on alerts.

Figure 10
Define a Solution Support Organization
Logical Components
Then click the Logical Components node (Figure 11). Selection of the logical component is not relevant for this scenario, but make sure you read the help text at the top of the screen.

Figure 11
Check if the selection of the logical component is relevant for your scenario
Business Processes
Click the Business Processes node on the left to bring up the screen in Figure 12. Select the business process for which the monitoring needs to be set up (e.g., 10.0 Reusable Processes).

Figure 12
Select the business process for which the monitoring needs to be set up
Monitoring Type
Scroll down on the left to the node (45) 10.0.29 Store Details for Reporting [Z_SAP_CRM_BPM], for example (Figure 13). (The name of the node differs based on your business processes that are defined and used.) On the right, select the type of monitoring. In this example, you select Background Processing.

Figure 13
Select the type of monitoring you want to set up
In Figure 14 you see the screen for the Background Processing node. Add the batch jobs you want to monitor. Type the name of the batch job (e.g., Z_CRM_SRFCRM03) in the Object Identifier field.

Figure 14
Add the batch jobs you want to monitor
Then click the Z_CRM_SRFCRM03 node (Figure 15). Add the batch jobs you want to monitor also in the Job Name field. It is possible to monitor a specific ABAP program or job step, but you don’t need that here. This is only needed when you want to monitor part of a batch job rather than the whole job.

Figure 15
Add the batch jobs you want to monitor in the Job Name field
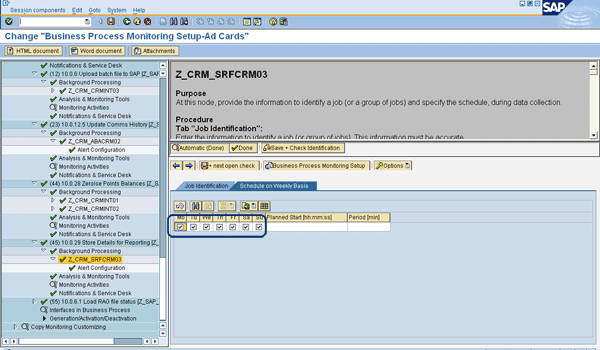
Next, select the days the job runs (Figure 16). Click the Schedule on Weekly Basis tab and select the days you want. On these days, BPM runs the checks.

Figure 16
Next, select the days the job runs
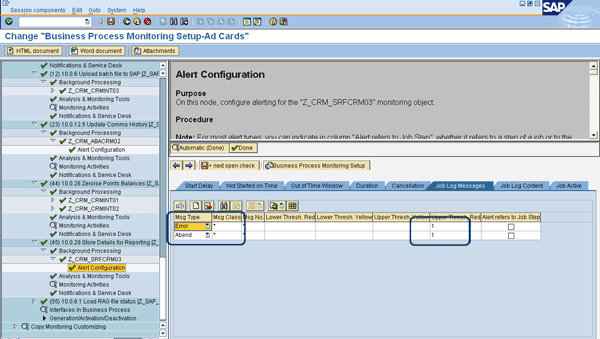
In the Alert Configuration node, go to the Job Log Messages tab (Figure 17). This allows you to monitor the messages written to the job log when the job is running. If the number of messages in the job log reaches the upper or lower threshold values, an alert is raised. The rating of the alert depends on the yellow and red thresholds.

Figure 17
In the Alert Configuration node, set up the Job Log Messages monitoring
Specify the parameters message type (Msg Type), class (Msg Class), and number (Msg No.). Set the threshold values for yellow and red (Lower Thresh. Red, Lower Thresh. Yellow, Upper Thresh. Yellow, and Upper Thresh. Red). Wildcards (*) can be used, but not for all three parameters. Specify at least the message type or message class. If you do not want to receive yellow or red alerts, leave the fields in the corresponding columns blank.
In this example, I define that I want to have alerts for both message types (Error and Abend [abnormal end of the batch job]). I enter 1 in the Upper Thresh. Red field.
Analysis and Monitoring Tools
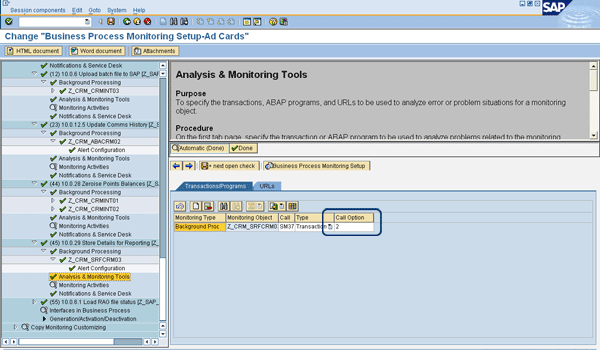
In the Analysis & Monitoring Tools node, specify the transactions, ABAP programs, and URLs to be used to analyze error or problem situations for a monitoring object. Later I’ll show you how you can use these transactions, programs, and URLs to help solve the problem. Here you use the default transaction SM37.
On the first tab, Transactions/Programs, specify the transaction or ABAP program to be used to analyze problems related to the monitoring objects. For some monitors, the F4 input help may suggest transactions. You can accept the proposed transaction codes (if available), or specify any other transaction or ABAP program.
If you want to specify several transactions or programs for a monitoring object, create a new line and choose the monitoring object from the input help.
Indicate where the transaction or program is to be called:
- Call option 1: Locally in the SAP Solution Manager system
- Call option 2: Externally, in the connected system (ABAP based)
On the second tab, URLs, specify the URLs for monitoring objects (Figure 18).

Figure 18
How to analyze error or problem situations for a monitoring object
Monitoring Activities
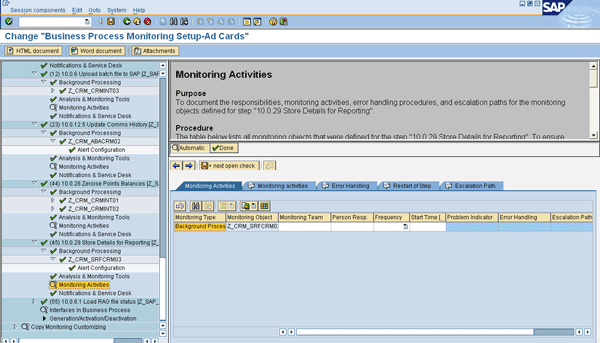
In the Monitoring Activities node, you can document the responsibilities, monitoring activities, error-handling procedures, and escalation paths for the monitoring objects (Figure 19). The table on the right in the Monitoring Activities tab lists all monitoring objects that were defined. To ensure effective monitoring and efficient problem resolution, you need to make sure responsibilities are assigned, and that problem resolution procedures are defined.

Figure 19
In the Monitoring Activities text field, describe additional monitoring tasks related to the step
In the Monitoring Activities table, assign each monitoring object to the relevant team and contact person responsible. Specify how often the person responsible is to carry out the required monitoring activity in the Frequency column. In the Start Time column, you specify at what time the monitoring activity needs to take place.
Give brief and concise descriptions for the following:
- What indicates a problem or error (in the Problem Indicator column)
- How to react to or solve the problem or error (in the Error Handling column)
- What should be done if the person responsible cannot solve the problem (in the Escalation Path column)
In the Monitoring activities text field, describe additional monitoring tasks related to the step. If necessary, describe further error-handling procedures in the Error Handling text field. In the Restart of Step text field, describe necessary actions for restarting the step (job in this case). You can add comments regarding escalation in the Escalation Path text field.
You do not need to set a manual rating. The rating is set automatically when you save the data. The rating Done is only set if you have assigned a team as responsible. In this example, I did not fill in all these details. You should for your situation so you know what to do if a specific error applies.
Notifications & Service Desk
In the Notifications & Service Desk node, you perform the configuration for automatic creation of alert-related notifications (such as emails) or Service Desk messages for the monitoring objects defined for the step.
To set up these automatic notifications, specify the sender (an SAP system user name up to 12 characters), recipient address, and type (such as email or SAPOffice mail). You can enter recipient addresses directly, or choose from the F4 input.
Specify the threshold values for the number of yellow and red alerts that can be issued before an automatic notification is triggered. Once the maximum waiting time (in hours) has elapsed, a notification is created, even if the thresholds are not exceeded. To restrict this mechanism to red alerts only, set the indicator in the Red Only column. All unconfirmed yellow and red alerts are reported in the notification.
If you require more detailed text in emails or SAPOffice mails, choose Detailed. To activate the automatic creation of notifications set the flag in the Auto. Notif. Active column.
You can define a pattern for the subject of a standard notification in the Subject Text column. Supported placeholders are:
- $SID$ for the system ID
- $SOL$ for the name of the solution
- $BUP$ for the name of the business process
- $MOB$ for the name of the monitoring object
An example is: System $SID$ — Alert for $MOB$.
The subject text is restricted to 50 characters. You can add additional long text to the standard notification. Double-click the icon in the Long text column and maintain the text in the pop-up. This long text is only included in the notification if you have chosen the Detailed option. The value in the Doc. Type field is the format of the notification.
If you want to include a URL link to the Alert Inbox, set the flag in the Alert Inbox Link column. Including a link allows you to jump from the notification to the alert inbox. This link is only included in the notification if you have chosen Detailed.
If the notification standard text does not comply with your requirements, you can create an implementation for Business Add-In (BAdI) BADI_BUILD_MESSAGE, in which you can build the subject and the text for the notification, according to your needs. You can create multiple BAdI implementations. Specify the filter value to identify the correct implementation.
As an alternative to the standard notification via SAPconnect (email), you can trigger any customer-specific auto-notification mechanism in an implementation for BADI_CUSTOM_MESSAGE. Specify the filter value and set the flags in the Auto. Notif. Active and Auto. Custom. Notif. Active columns.
Here are a few things to keep in mind during the setup of notifications:
- The user specified as the sender must exist in the client of the SAP Solution Manager system in which you have configured BPM. This user must have an email address that is recognized by the mail server used.
- Only one entry can be made for each monitoring object. It is not possible to add new lines to the tables. To send notifications to several recipient addresses, use distribution lists in the SAP Business Workplace (transaction code SBWP), or in your office software.
- The user used in the internal RFC destination BPM_LOCAL_<Client>, normally SM_BPMO, must be authorized to create notifications (send orders) in SAPconnect (transaction SCOT).
- The F4 input help for the recipient address contains information from the contacts maintained for the solution (follow menu path Solution Landscape Maintenance > Contacts).
- If the Auto. Notif. Active flag is not set, no notifications are sent.

Figure 20
Configuration for automatic creation of alert-related notifications
In this example, the recipient type is C, which is a shared distribution list. You can use a shared distribution list here to prevent maintenance of email addresses in the monitoring detail settings (Figure 21). You can use transaction SBWP to maintain distribution lists, but exactly how to do this is outside the scope of this article.

Figure 21
Set up a shared distribution list
The last step is the activation of the monitoring. See the Generation/Activation/Deactivation node (Figure 22). Here you can deactivate or activate what you have set up, as needed.

Figure 22
The last step is the activation of the monitoring
Use BPM
In this case the real use of BPM starts with receiving a notification via email (Figure 23).

Figure 23
Example of a notification received via email
As a next step, you access BPM in SAP Solution Manager using transaction DSWP. Look at the applicable Solution and click the red icon that shows the number of business processes that are producing errors (Figure 24).

Figure 24
Example of BPM situation for a solution
Next, click the business process (red icon) for which you want to access the alerts (Figure 25).

Figure 25
Example of BPM situation for a solution: which business process to analyze
You can see the applicable alerts (Figure 26). You can also see the Analyze and Monitoring tools, specified above. Click the SM37 button to analyze the jobs executed in the managed system.

Figure 26
Example of BPM situation for a solution: the Analyze and Monitoring tools
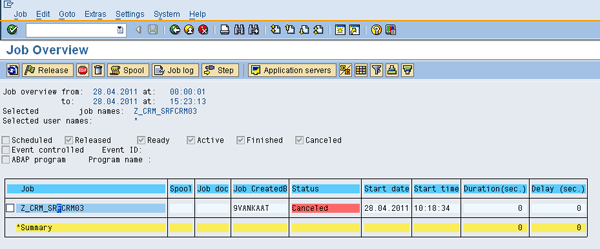
Look for the job that has been cancelled (Figure 27). You can filter by selecting different check boxes under Job status. Then click the Execute button to bring up the screen in Figure 28. You can perform analysis on batch jobs that meet your selection from the previous screen.

Figure 27
Analyze cancelled batch jobs in the managed system — selection

Figure 28
Analyze cancelled batch jobs in the managed system
Select a batch job in Figure 28 and the screen in Figure 29 allows you to study the job log for the cause. This is also what you saw in the email notification, but in the system here you can do further analysis to assess what the cause is and how to resolve it.

Figure 29
Batch job error log
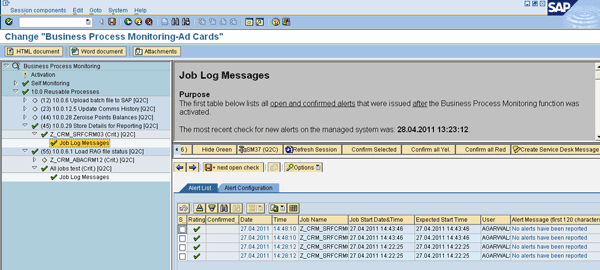
Click the back icon to go back to Figure 26 (which is shown again in Figure 30). If you have dealt with the alert, confirm it by clicking the Confirm all Red button. As shown in Figure 31, you won’t see the alert anymore.

Figure 30
Alert confirmation

Figure 31
Alert confirmed
Note
This is just one example out of the manyscenarios that can be used within BPM in SAP Solution Manager. I hope you agree that setup is quite easy, and the resulting benefits can be significant.
Theo van Kaathoven
Theo van Kaathoven is a senior SAP Solution Manager consultant who has worked as an independent consultant for more than 15 years. He has a master’s degree in business administration, and prior to that he finished an IT education on a bachelor level. He is specialized in SAP Solution Manager use for both projects and application management (and their integration). He performed a complete implementation of many of the existing SAP Solution Manager functionality from scratch, up to and including support, for several large companies.
You may contact the author at tovankaathoven@certifica.nl.
If you have comments about this article or publication, or would like to submit an article idea, please contact the editor.


