Hone your ability to view financial data in an SAP system by using the SAP Business Explorer (BEx) Query Designer features and functionality in the SAP Enterprise Performance Management (EPM) add-in. Then view several financial reports to see the functionality in action.
Key Concept
The Enterprise Performance Management (EPM) add-in is known for its ability to read and use information from the SAP Business Warehouse (SAP BW) InfoProviders. However, there are other options such as using the underlying SAP Business Explorer (BEx) Query Designer definition for supporting the EPM add-in reporting. Therefore, you can increase your ability to access information from BW InfoProviders by using and creating BEx Query definitions on top of the SAP BW InfoProviders. This allows you to access InfoProviders that are not naturally accessible to the EPM add-in, but if you create a query definition using the BEx Query Designer on top of the InfoProvider, you can easily get to the data. This can offer a number of advantages, including but not limited to the use of calculated and restricted key figures, filtering features, hierarchies, and other options. One of the more significant aspects is that you can leverage the work done in the Query Designer against the flexibility of the EPM add-in and therefore offer the business user additional functionality. The EPM add-in became available at the same time as SAP Business Planning and Consolidation (BPC) 10.0 came on the scene. This was in the spring of 2011 and is currently only available via the EPM suite of products, but this year it will be integrated into the Analysis for Office Excel and therefore will be available as a standalone. For this to work, you will need to be on at a minimum the BEx Query Designer version 7.0 or above.
I review and show examples of some of the features and functionality of the EPM add-in that set it apart from the other reporting components in an SAP Business Intelligence (BI) system and make it a strong option in the analysis reporting area. As with other reporting components that are available in the SAP BI space such as SAP BusinessObjects Web Intelligence and SAP BusinessObjects Analysis for Office and Crystal, you have the option to use the Business Explorer (BEx) Query Designer definition as a source of information. This goes for the EPM add-in as well.
I describe the additional features available via using the BEx Query Designer definition as a source for the EPM add-in versus using SAP BW InfoProviders directly. Using the EPM add-in as a reporting component with the BEx Query Designer definition as a source outside of the BPC area is a very new and not well understood or known approach to reporting from the native BW providers. The features to be highlighted are the use of the calculated key figures (CKFs) and restricted key figures (RKFs), hierarchies, filters, central control of sensitive calculations, and other features available in the BEx Query Designer that you can support in the EPM add-in. I also explain some reports that are the result of building them from the EPM add-in with the BEx Query Designer definition as a source, but the real strength of this reporting component comes with the flexibility and functionality that’s available once the report is complete.
BEx Query Designer
The SAP Business Planning and Consolidation (BPC) version 10.1 embedded version supports the use of the BEx Query Designer definition in reports and input templates in a way that is very similar to how SAP BI Integrated Planning (BI-IP) was using it. (The BEx Query Designer is the toolset, and the BEx Query Designer definition is the resulting object.) You can also see that in the BusinessObjects space, there has been a shift from the focus on having a Universe as a source of information for the BusinessObjects reporting components to the BEx Query Designer definition as a go-to source for data.
The BEx Query Designer has been around for quite some time, and is a tried-and-true option for report building. Of course, there are different pros and cons regarding using the BEx query as a reporting toolset, but when it comes to the BEx Query Designer, there are many more pros than cons. I highlight the different features and functionality of using the BEx Query Designer to help improve the reporting view to the business users and how it can be used to supplement or complement the robust features available via the EPM add-in.
This overview reinforces the concept of using the EPM add-in as a reporting toolset with standard BW InfoProviders. The EPM add-in is the front end of the EPM suite and can connect to all the objects within these components. However, I want to emphasize the use of the EPM add-in with the core SAP BW objects and the fact that it should have a place alongside the BusinessObjects reporting toolsets during analysis of reporting needs.
Currently, the EPM add-in is only available if you purchase something in the EPM suite. This will change in 2015 as the plan is to integrate the EPM add-in with Analysis for Microsoft Office Excel. This is something that is a long time coming because some of the functionality overlaps and I am looking at two Excel-based reporting tools. These two tools should be combined to take the best of both worlds and make an Excel-based best-of-breed reporting tool.
There are two aspects of this approach I want to cover. First, I explain the benefits of using the BEx Query Designer as a source for information versus other providers. Second, I describe the benefits of using the EPM add-in rather than using something from either the standard BEx components or the BusinessObjects suite.
Note
I reference the features and options available via the EPM add-in Support Package 18. There are differences in the Support Package levels in the EPM add-in, and therefore, it is important to take this into account during the analysis of using the EPM add-in versus other BI reporting components.
EPM Add-in Features
Why use the EPM add-in versus other Excel-based toolsets for reporting purposes? This toolset is focused on those business users who are looking for the ability to use Excel features or functions in conjunction with the robust features of an SAP-based reporting tool. Of course, financial users are definitely one of the groups that would be looking for this type of functionality, but you can also start to incorporate more groups—overall anyone who is interested in using Excel features such as Visual Basic for Applications (VBA), macros, Excel formulas, Excel comments, native Excel worksheets, and any other options available in Excel for analysis and processing.
However, you need to realize that you would be restricted when it comes to using any web-based reporting options. There are some web-based features that can be used, but overall, the EPM add-in is focused on Excel users. Table 1 lists some of the features of the EPM add-in.
Feature
|
Description
|
Member recognition
|
This enables the business user to type in the technical names of master data and the system automatically recognizes the values and syncs the value up with the appropriate value from the master data. For example, if you type in a company code in one cell (a row, for example) and then type in a period or year in another cell (a column, for example), the system automatically recognizes the two values and generates the key figure that’s the intersection of the two master data values. Although other reporting tools can also do this process, this is the SAP-based approach to being able to create a report on the fly (ad hoc) from master data typed into an Excel spreadsheet.
|
Excel formatting
|
The EPM add-in can accommodate both the EPM formatting template (or a template of your choice) and Excel-based formatting. Whatever formatting you set up in the report or workbook is available for you once you re-execute the report. Any formatting is accommodated by the EPM add-in.
|
EPM functions
|
The use of standard-delivered EPM functions. There are more than 125 EPM functions. Some are to be used for easier access to EPM features on the EPM ribbon or EPM options, and others support additional features, such as allowing an additional column for descriptions or more calculations. One that supports improved capabilities would be EPMComparsion, which allows the setup of a B/W (Better/Worse) column. It uses the account types from general ledger (G/L) accounts or the account type attribute from the account characteristic. This allows the system to identify what is better or worse based on the fact that the G/L account is an income, equity, liability, or expense account rather than having to incorporate coding to make this alignment of better or worse based on the report.
|
Signage
|
This is one of the other areas in which there seems to be a difference between what the analyst versus the business user wants in a report. That would be the display of the data from a report. Should the values be reflected using a report signage or natural signage from the underlying data in the InfoProvider? The EPM add-in can accommodate both automatically and with standard features rather than having to set up logic within the report or coding during the report execution.
|
Comments
|
Excel-based comments are available using standard features or having comments appear within the report itself based on an additional comments column.
|
Formulas
|
The use of global formulas for calculations allows the user, not just the query developer, to develop formulas that can be shared across reports and source systems so that standard formulas can be shared.
|
| Distributions and collections |
Distribution and publishing features that allow the user to schedule, automate, and manage the distribution process for the reports. |
| Connections to multiple source systems |
Direct connections with the source system. The EPM add-in has connections to multiple different source systems to access data from the SAP system or non-SAP systems. It can connect to HANA-level source tables. |
| Multiple reports on one worksheet or one workbook |
This feature enables you to have multiple reports from multiple source systems (both SAP and non-SAP systems) being created and fully functional in the same worksheet or workbook in the EPM add-in. These reports can be stored in a Sharepoint site or drive and shared with others as long as the other business user has all the appropriate system connections available. |
| Excel features or functions |
This reporting component is the most natural Excel-based reporting toolset that I’ve used from the SAP reporting solutions, including BusinessObjects-, BEx-, and SAP ERP Central Component (ECC)-specific reporting options. It enables you to do just about whatever you can do in Excel in terms of formulas, VBA, macros, sheet references, formatting, and others can be accommodated by the EPM add-in. |
| Report types |
The business user can adjust the report to accommodate different types of reports, such as a report with both profit and loss (P&L) and balance sheet information showing in the same report with standard features. For example, you can create a report with the controlling master data in the center of the report flanked by key figures showing actual and plan data on the left and right of the accounts. Some of these report types are more difficult with other reporting components, such as the BEx Analyzer. |
Table 1
Some features of the EPM add-in
Table 1 lists only a few of the additional features that are available using the EPM add-in versus other Excel-based reporting tools. There are other areas that are improving as each of the Support Packages are published, such as the ability to use the drill-through feature that allows the user to jump from one report to another report for more detailed analysis. This feature is available, but it’s very basic and allows only one jump through to a column-based report in a natural Excel screen. This is improving, and with some of the other features that are being improved, will probably be as functional as any other drill-through process very shortly.
The use of variables is not available in the EPM add-in. This is based on the definition of how a variable would be displayed. For example, a variable within a report would be called a run-time variable, and in this case, the run-time variable would appear as a pop-up screen prior to the report being executed. This would allow the user to add filters to the report prior to the execution of the report and show specific values once the initial view of the report is shown.
This can be accomplished by the EPM add-in (by using the navigation pane defaults and the variant concept within the EPM add-in), but not in the same manner as a true variable. This could definitely be changing because the EPM add-in, in conjunction with the BPC 10.1 embedded version, is using the standard types of variables during execution. With the integration with Microsoft Analysis coming, this could be a standard feature. Based on a review of the different functions available via the EPM versus other reporting components, the two items referenced above (variables and drill-through) are the two cons that I would see as the most significant.
Advantages of Using the EPM Add-In with BEx
Assume, based on your needs, that you have accepted the approach that you will be working with the EPM add-in for all your financial reporting needs and there has been due diligence around picking this specific component to support all of those important financial analysts during the month, period end, and any other ad hoc reporting needs that they want and require. Now, the question is, why use the BEx Query Designer versus just linking it to a basic SAP BW InfoCube or other InfoProviders? In this case, there are definite advantages to using this approach versus others. Some of the additional features available via the BEx Query Designer are listed in Table 2.
| Feature |
Description |
| CKF and RKF |
The first and probably the most important is the ability to use the RKF and CKF features available in the BEx Query Designer. This allows the central control of specific formulas (such as net income) for distribution to the users. Therefore, the critical key performance indicators can be centrally managed, and if necessary, with the EPM add-in functionality, the business users can also develop their own formulas via the CustomMember Formula. In terms of the use of the CKF and RKF, you would now be able to add more important indicators or calculations to the base data available in an InfoProvider. This also helps control the critical key performance indicators (KPIs).
|
| Restrictions of characteristics and key figures |
Normally, when using the EPM add-in on an InfoProvider, you see all the characteristics and key figures as well as navigational attributes. Many of these might not be required or necessary. Using the Query Designer, you can filter the characteristics and key figures you see in the EPM add-in. You only see the ones that you move into the columns, rows, or free characteristics fields of the Query Designer. Also, characteristics such as Controlling Area can be restricted and hidden from the EPM add-in by using the characteristics restriction component of the Query Designer. |
| Variables |
In the future the EPM add-in may be able to use the Query Designer variables—similar to what the current BPC 10.1 embedded version can offer. |
| Navigation attributes |
During the setup of the connection between the source system and the EPM add-in, you can activate the use of navigation attributes from the SAP BW InfoProvider by selecting the Use Navigation Attributes check box. This action allows the business user to access the navigation attributes added to the Query Designer components. |
| Performance |
Performance can be managed using the Query Designer definition as well. Because of the ability to restrict the total characteristics and use of the CKF and RKF architecture, you can support improved performance of the EPM add-in against the BW InfoProviders. |
| Access to all SAP BW InfoProviders |
Currently, the local connection can only connect to a limited set of InfoProviders, including InfoCubes and Multi-Providers. By using the Query Designer as the source of data, you can then connect to all the InfoProviders that SAP BW offers. This adds a significant number of different tables available to the EPM add-in, including HANA type views and tables. |
Table 2
Features of the BEx Query Designer available via the EPM add-in
Even if you are thinking about using the EPM add-in against an SAP BW InfoProvider, reviewing the benefits of adding the Query Designer definition to this architecture is definitely worth a discussion and maybe a prototype demo. You can then make a decision as to whether or not you like the additional features that this combination gives you.
What I suggest is that you can have the best of both worlds by using both the Query Designer, which is a tried-and-true source for information from all SAP BW InfoProviders, and the additional features available from the EPM add-in that allow the business user more flexibility and functionality than most other SAP reporting components within the Excel area. Before I describe a couple of examples of these features, I review some reports that are the end results of the EPM add-in structure using the BEx as a source.
Figure 1 shows a basic Monthly Trial Balance report. This report is significant for validation of the data once either a financial or consolidation close occurs. In this case, several functions or features are being used:
-
The formatting uses the EPM formatting template for highlighting the TIME and BALANCE characteristics to show the business user what filters should be changed
- The information in column B is basic Excel information. The information in column C is specific to the InfoProvider being used, but the column B descriptions are typed into the report and are available each time the report is executed.
- Grouping across columns E through H and E through K (cut off the report). In my example, I use the standard grouping feature for Excel. This standard grouping allows you to manage the data you currently see.
- The balance found in column D and the value monthly in column E. This process uses standard Excel formatting as well. Cut or paste the information to the columns or locations in which you want to see it. This information is available whenever the report is executed, and it does not move from those cells.
- Formatting in column D. The $ or USD can be used in this case. In my example, I use the EPM formatting template to support the $ being in the basic values cells. However, as you can see, the last line of the report doesn’t have a dollar sign. Therefore, within the EPM formatting template, the option to allow the dollar sign to be included in the cell was not turned on. I could have done this either via the EPM formatting template or basic Excel formatting.

Figure 1
A Monthly Trial Balance report
Figure 2 displays a basic currency translation adjustment (CTA) Validation report. This report is a control type of report in which you want to make sure that the currency translation executed by the system is consistent with what is expected. In my example, I can use both the EPM and Excel features to accommodate this requirement. In this case I used:
-
Similar formatting approaches as in the report in Figure 1. I show the fact that I use the EPM formatting template (see the first tab labeled EPMFormattingSheet).
-
Notice the second tab, USER NOTES. This tab is used to include information for the business users and what definitions and step-by-step activities are required.
-
Notice the USD and CAD validation tabs. These are reports that show the company codes that are either USD or CAD (as the tabs mention). The final tab (no description) has another report showing the exchange rates for specific months and in this case the month is SEPT 2014.
-
The Local Currency column shows the values from the source Query Designer or InfoCube. The US Dollar column is a calculation based on the exchange rate that the final tab has for USD (in this case it would be 1.00, but in the case of CAD, it would be the exchange rate for CAD by USD) multiplied by the group currency within the system. This is using an Excel reference from sheet 3 to sheets 1 and 2.
-
The CTA Impact column shows the difference (there should not be any difference). If there is a difference, then there might be an issue with the calculation of the CTA process within the system. This is using an Excel-based calculation that I then converted to a Customformula.

Figure 2
CTA Validation report for analysis and confirmation of currency translation processes
A final sample in Figure 3 is of a generic income and balance sheet statement. This shows that with the EPM add-in, you can take information that would naturally be in a columnar format and switch the view into a standard format expected by the business users for Income and Balance Sheet statements. This is a basic cut or paste process to accomplish this realignment of the display of the data.
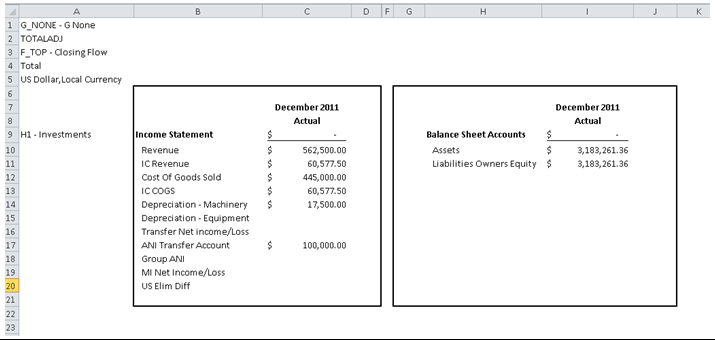
Figure 3
Income and balance sheet statement
Now I review some of the setups and basic architectures behind the scenes for this to occur. Figure 4 shows the basic SAP BW InfoCube that was used in this example. In this case, I have a standard InfoCube and have switched on some navigation attributes and have one key figure.
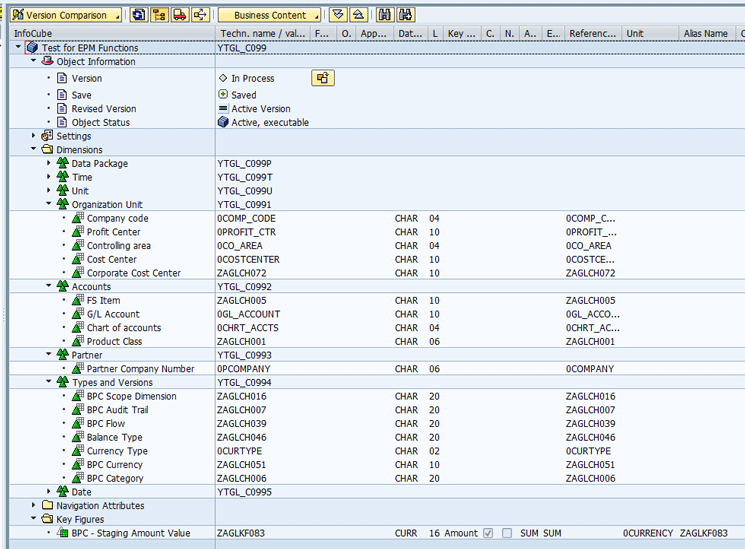
Figure 4
BW InfoCube with hierarchies, navigation attributes, and one key figure
Now I view the navigation attributes (Figure 5) that are available based on the InfoObjects being used within the SAP BW InfoCube. In this case, I focus on the navigation attributes used for the G/Laccount (0GL_ACCOUNT) in the reports and those available have the parameter checked off. In the case of the G/L account, these attributes are the Balance Flag (0BAL_FLAG) and Income Statement Flag (0INCST_FLAG).
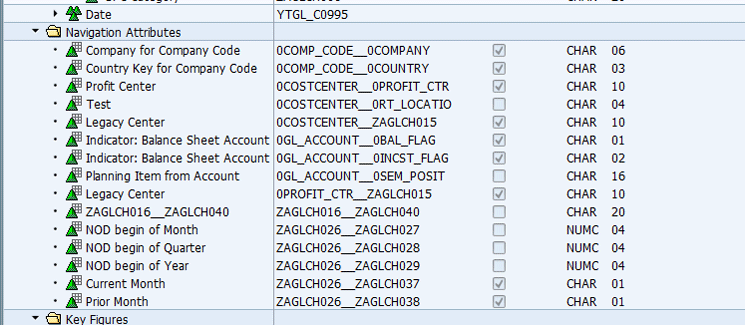
Figure 5
Navigation attributes available based on the InfoObjects in the BW InfoCube
After you take the next step to create a basic query in the Query Designer (Figure 6), note that I have several characteristics and the one key figure assigned. Nothing is complex here as I want to offer an example of some of the features mentioned above.
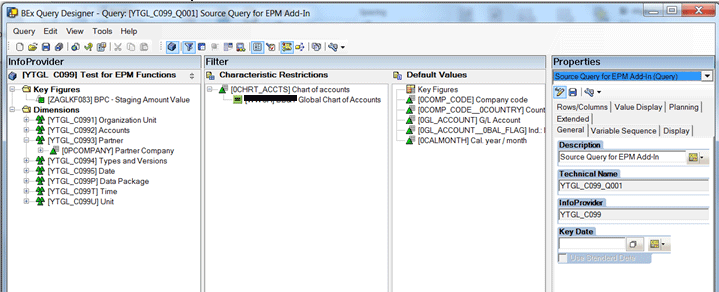
Figure 6
BEx Query Designer: Created basic query
Figure 7 shows the basic Columns and Rows that I have set up. In my example, I have 0CALMONTH, and the one key figure in the Columns and the Rows is made up of Company Code, Country, GL Account, and the Navigational Attribute for the Balance Sheet indicator.

Figure 7
Query Designer definition
The one parameter you need to make sure that’s turned on is the parameter found in the Properties screen of the Query – Extended. In the Release for External Access section, select the By OLE DB for OLAP indicator (Figure 8). This parameter allows the EPM add-in connection process to read the query created via the Query Designer.
Figure 9
-
Select the Do Not Load Members at Connection indicator, which supports performance improvements
-
Select the Use Navigation Attributes indicator, which allows me to use the navigational attributes within the Query Designer
-
Use the BAPI provider for SAP BW NW so that I can use this approach with business users who don’t have the SAP GUI loaded onto their laptops. Therefore, this offers the option to have a thin client for the business users who are going to use the EPM add-in.
- Create the report that is entered in the last field. Note the technical name/ID. If you are going to share this report with others, you want to make sure that the connection name is consistent among all the different users of this report. This means that you would have to share this exact connection with all the users via some Sharepoint approach or based on adding this connection to the other users’ files.

Figure 9
EPM Connection screen for the Query Designer report definition
Once this is complete, you move to the EPM add-in to view the information based on the Query Designer definition. After the connection is complete, you can log on to the EPM add-in (Figure 10).

Figure 10
The EPM Data Connection screen
Figure 10 shows the initial report layout information based on the Query Designer definition. In this case, you can see that I include several items:
-
The Company code, G/L Account, and Cal year/month – characteristics in this list
-
LEGALENTITY, MGMTREPENTITY, and ACCOUNT – hierarchies for the characteristics
-
Country and Ind.: Bal.Sheet Acct – navigation attributes included the report definition
In the Reports section of the EPM ribbon, you access the EPM – Report Editor screen (Figure 11). In this screen you can build a report, and in this case, the differences are a bit clearer. The navigation attributes are in italics, the hierarchies are in upper case, and the characteristics are the normal type. Regarding the Key Figure value, this supports all Key Figures that you might have. Therefore, if you have five Key Figures, they would be master data of this Key Figure item shown in Figure 11.
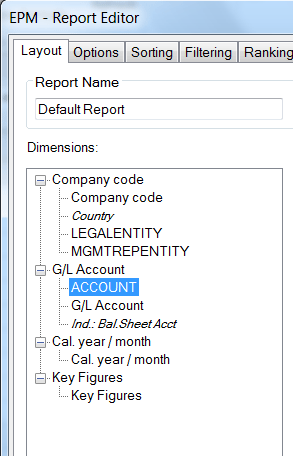
Figure 11
The EPM Report Editor showing the dimensions or characteristics available for reporting
Figure 12 shows the Member Recognition portion of the user options screen in which you turn on this feature. This can be found in several locations in the EPM add-in, but normally, you use the User Options, found in the tools section of the EPM Ribbon, to turn this feature on.
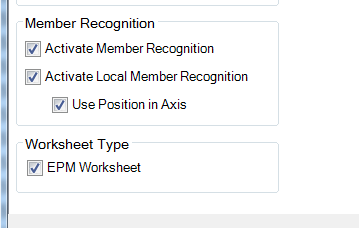
Figure 12
Member Recognition activation in the EPM options screen
In Figure 13 I show a report based on the use of the member recognition, but this is difficult. Generally speaking, you would type in one master data value such as 101010 as a G/L account and then using that as the initial value, use the Excel function to scroll down the EPM screen. The values would show up based on descending order as in the report. Then you would type in 10.2013 and scroll across the top of the columns. Once this is complete, the system automatically recognizes the intersections and fills in the values consistent with what is available in the source table. In this case, that would be an SAP BW InfoCube via the Query Designer definition.
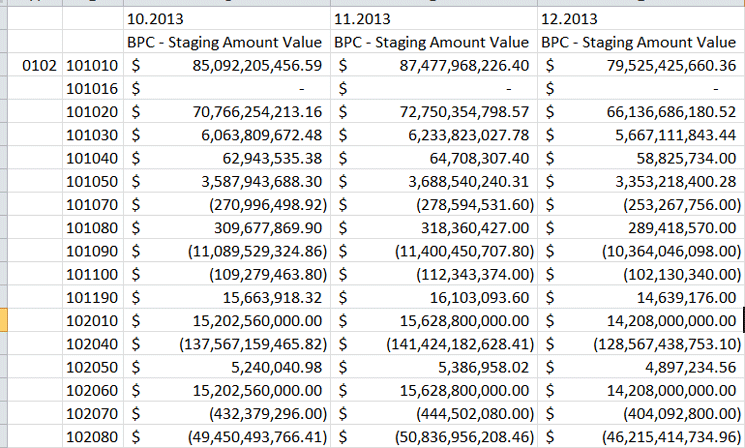
Figure 13
Report created using member recognition to populate the report
Now go back and look at setting up an RKF so that you see this feature in the EPM add-in. Figure 14 shows the creation of the RKFs for each of the months. This is a basic RKF with the combination of the BPC value plus the month itself. You can do as complex CKFs or RKFs as needed, which would include nested formulas, RKFs being used in CKFs, user exit formulas, and reference formulas. There’s no limitation on the combinations you can use for these formulas and they are available in the EPM add-in.
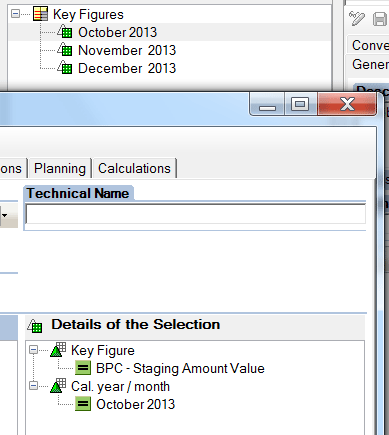
Figure 14
Create an RKF for each month
Figure 15 shows the final view of the RKFs now available within the Query Designer.
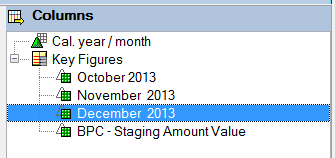
Figure 15
View of finished RKFs
Now, you can execute and create a report using these three RKFs directly in the EPM add-in. Rather than building the values (Key Figure plus characteristic for monthly data) within the report, you use the centrally controlled setup via the Query Designer and the RKF process. Figure 16 shows the results. They are not any different than the results from before but with RKFs, versus building the values within the EPM add-in.

Figure 16
Using RKFs within the EPM add-in report for displaying the monthly values
Taking this example a step further, you then use basic Excel formula building to create a local member. In this case, use =C2+D2+E2 (Figure 17) to create the quarterly value for Q4, 2013. Notice the header (fn) Position Local member. In this case, you then take this local member and turn it into a Custommember.

Figure 17
Create a local member using the Excel formula process
Once this process is complete, you can see the local member view by going to the EPM-Report Editor screen (Figure 18) and in the Local member tab viewing the value and the formula. In this case, you change the Name to Q4 2013 so that you can understand what the results are in the report. You also see in the values =EPMPOSITION(1)+EPMPOSITION(2)+EPMPOSITION(3) in the formula field. In this case I use the EPM recognition for Position (refer back to Figure 12) rather than the raw Excel values. Both generate a similar result, but with the position approach, you create the results based on the column position versus the cell position.
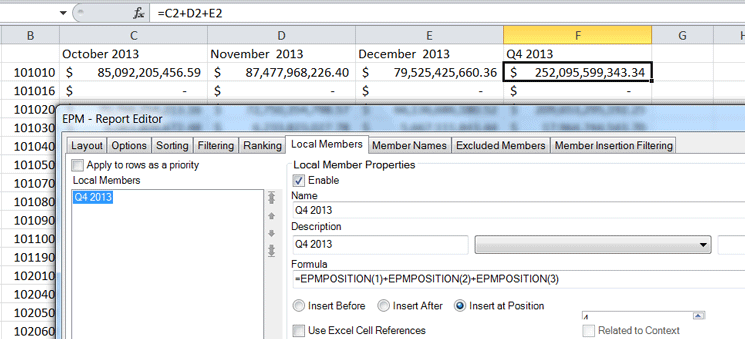
Figure 18
EPM – Report Editor: Local members value
Now, you put all of this together in the report and add one of the navigational attributes into the rows. Use the Bal Sheet Account indicator to show this feature. Figure 19 shows the additional of this navigation attribute to the Row Axis. You also add the navigation attribute for the Company Code currency to the report as well.

Figure 19
Add the navigation attribute bal. sheet acct to the rows of the report
After executing the report (Figure 20), you see the two characteristics in the rows plus the navigation attributes of the Bal Sheet indicator and the Company Code currency, which are an X and USA, respectively.
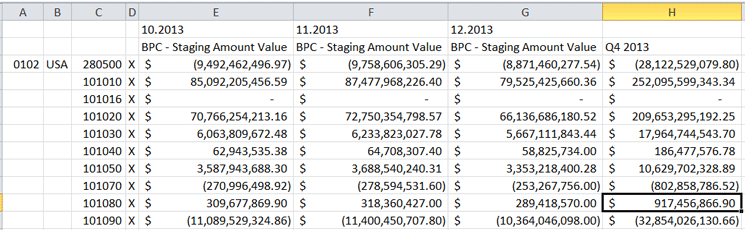
Figure 20
A report with multiple characteristics and navigation attributes plus the local member formula
Now you switch the local member formula to a custom member formula. Right-click the Local Member column. Now when you view the context menu, you see the local member converted to a custom member option. This can be seen in Figure 21.
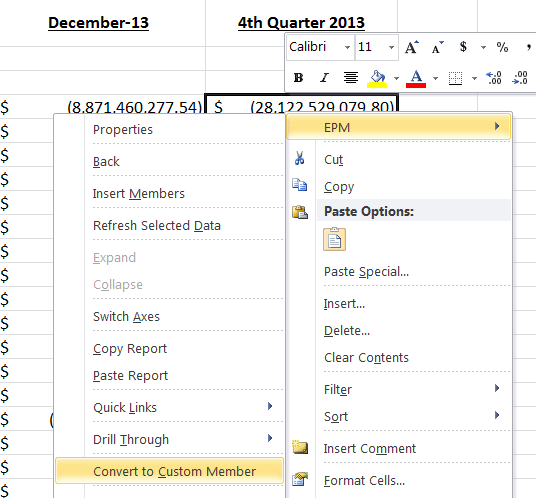
Figure 21
Convert a Local Member to a Custom Member
This allows you to use these formulas on multiple reports by the use of Export and Import of Custom Members buttons. This can be seen in Figure 22.
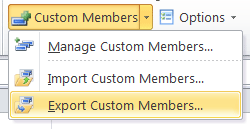
Figure 22
Import and Export Custom members
In this case, you are saving an XML version of the Custom Member and you can Import it into any reports you would like. Of course, the core information has to be similar to allow the custom member to be active. Figure 23 shows the initial connection of the Custom Member to the source, and in this case, it’s the Query Designer definition.
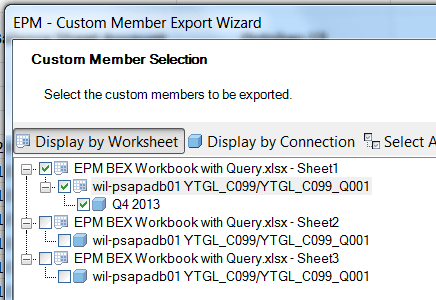
Figure 23
Custom Member import based on an XML image
One final feature that is relatively new to EPM is the use of the Context Favorites. In Figure 24 you see the creation of the variant to be used in the report. In this case rather than having the business user fill in the values, after the execution of the report, the users can create their own Context Favorites and can then use them during the execution process. These context favorites show up on the Context menu within the report and the business user can select them so that the values can be automatically filled in versus having to manually fill them in each time. This is useful for business users and any other times when specific values are required during the execution of the reports, such as during the testing process.

Figure 24
Creation of the Context Favorites for use in a report execution
The final result would be a report (Figure 25) with the use of multiple EPM and Excel functions that complement each other and offer the business user a wide array of features, functions and flexibility.
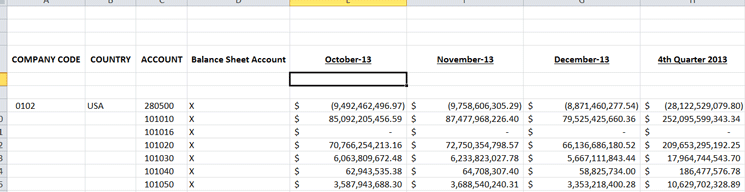
Figure 25
Report using EPM and Excel functions
Using the EPM add-in against standard BW objects as well as incorporating the BEX Query Designer component as a source for the EPM add-in could be something to look into, especially if your end users are using Excel spreadsheets for reporting and analysis and need the full functionality of Excel features.

Peter Jones
Peter Jones is a business intelligence solution architect in the areas of CO, EC, SAP BW, BI, BusinessObjects, Planning and Consolidation (BPC), and SEM for MI6 Solutions. He is certified in all these areas and is a subject-material expert for SEM, CO, BI, and BPC, with over 14 years of experience in these areas working for SAP and MI6 Solutions. Currently, he is involved in projects incorporating SAP BW 7.4, HANA, BPC 10.0, and EPM 10.0. He has consulted in all those areas for the last nine years. Peter was an SAP instructor for seven years and has written several books about SAP NetWeaver BW, FI/CO, and has recently revised his book about BPC Implementation to version 10.1. He is a contributor to Best Practices for Financial Reporting in SAP, an exclusive anthology of articles that delivers unparalleled guidance on how to optimize financial reporting processes with SAP applications.
You may contact the author at peter.jones@mi6solutions.com.
If you have comments about this article or publication, or would like to submit an article idea, please contact the editor.