Manager
Step through the process of creating two custom metrics: one within Computing Center Management System (CCMS) and one in SAP Solution Manager 7.1 Technical Monitoring. These metrics work together to monitor the transmission of faxes and emails. The integration of the two metrics allows for an alert to be sent when failed transmissions are detected.
Key Concept
To successfully implement this process, you must understand the key components used to complete the activation of the monitor: SAPconnect, Computing Center Management System (CCMS), and Technical Monitoring. SAPconnect provides an interface for external communication; it supports sending transmissions via fax, text messages (pager/SMS), email, and X.400, including sending to printers. It allows for external communication components to be connected to a SAP system. CCMS is the original method for monitoring components within a SAP instance. CCMS uses monitoring tree elements (MTEs) to collect data on the current status of a key component. CCMS resides on the specific instance that requires monitoring and requires any desired monitoring to be configured on that instance. Technical Monitoring is the latest monitoring solution via Solution Manager 7.1. It allows for the monitoring of key components across an entire SAP landscape. Solution Manager uses a similar tool: a metric. It includes alerts via email as well as a mobile monitoring app, providing a quicker response to issues.
The successful transmission of emails is an integral part of any business. If a company doesn’t receive an invoice or a supplier doesn’t receive an order, it can cost a business thousands of dollars. The activation of a custom monitor allows for immediate response to the failure of vital business transmissions, providing an indispensable recourse to ensure the communication between customers and vendors remains operational. I’ll show you a step-by-step process for creating two metrics using two systems, Computing Center Management System (CCMS) and SAP Solution Manager 7.1 Technical Monitoring, so you can be alerted when there are failed transmissions.
To perform this process, you need to be running a Solution Manager 7.1 system.
Step-by-Step Process
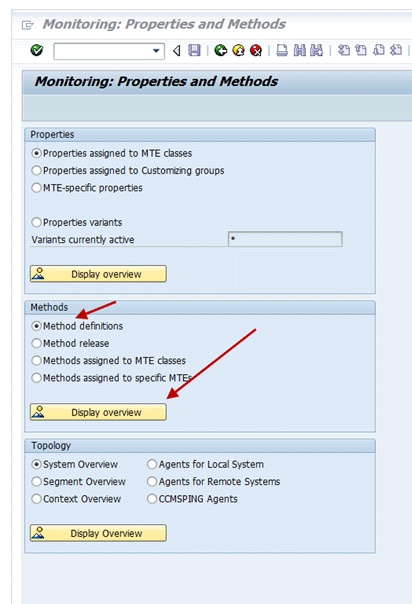
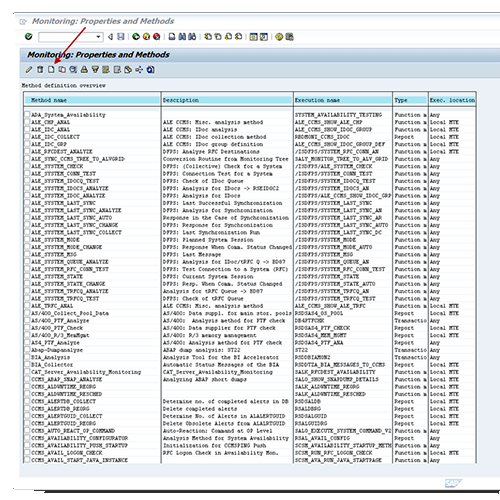
Step 1. Create an SAPconnect method using transaction code RZ21 (Figure 1). Select the Method definitions radio button and click the Display overview button in the Methods section (on the server that needs monitoring). In the resulting screen, click the create icon (Figure 2).

Figure 1
Create two SAPconnect methods: data collection and analysis

Figure 2
Create the data collection method
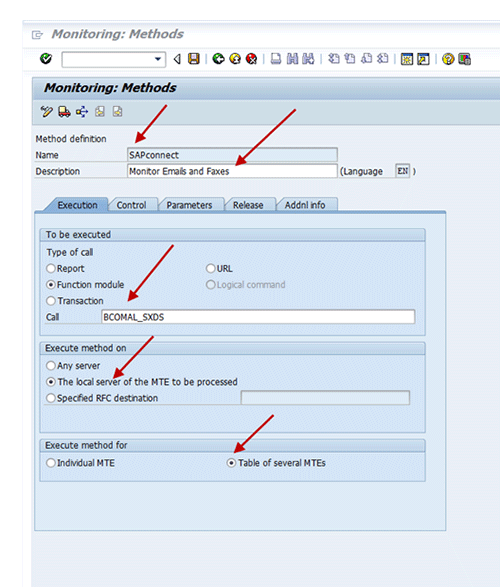
Step 2. In the resulting screen, you need to maintain a number of elements in the Execution tab (Figure 3). Enter SAPconnect as the Name along with an appropriate Description (e.g., Monitor Emails and Faxes). Select the Function module radio button and enter BCOMAL_SXDS in the Call field. Then select the options The local server of the MTE to be processed and the Table of several MTEs.

Figure 3
Select the method options
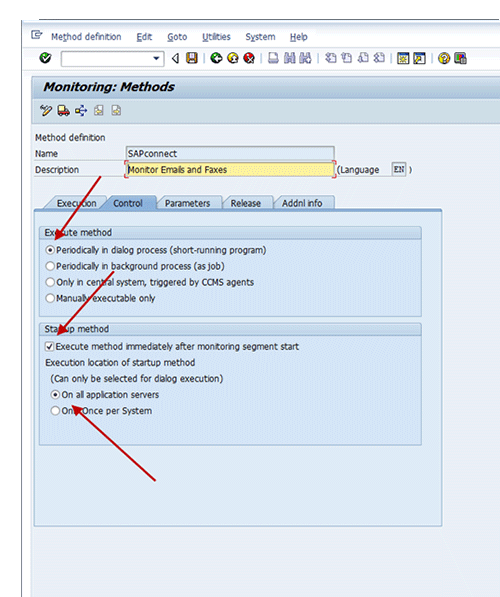
Step 3. Maintain options on the Control tab (Figure 4). Under the Execute method section, select the Periodically in dialog process (short-running program) radio button. Under the Startup method section, select the Execute method immediately after monitoring segment start check box and the On all application servers radio button.

Figure 4
Select options on the Control tab
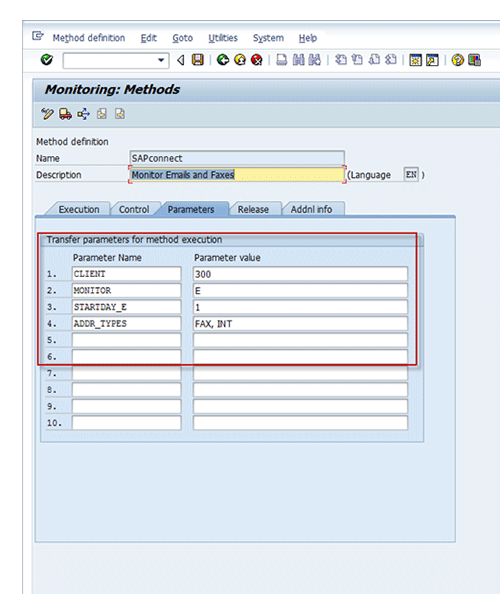
Step 4. Maintain options on the Parameters tab (Figure 5). In line 1, type CLIENT in the Parameter Name column and 300 in the Parameter value column. This number represents the client that you want to monitor. If you want to monitor multiple clients, use multiple lines. If you do not specify, the default is to monitor all clients.

Figure 5
Enter parameters
In line 2, for the Parameter Name type MONITOR and for the value use whatever combination of values you want to monitor from the following values: Waiting (W), Error (E), Transfer (T), Nodes (N). If you want to monitor errors, transfers, and then waiting, type ETW. In line 3, type STARTDAY_E and enter 1 as the value. This starts monitoring at the beginning of the days measured. In line 4, type ADDR_TYPES and for the value enter FAX, INT to represent faxes and emails (INT represents emails). Other options include text messages and SMS (PAG), remote mail for SAP-to-SAP communication (RML), sending data to printers (PRT), and sending via X.400, which is the original method for sending emails but is no longer common (X40).
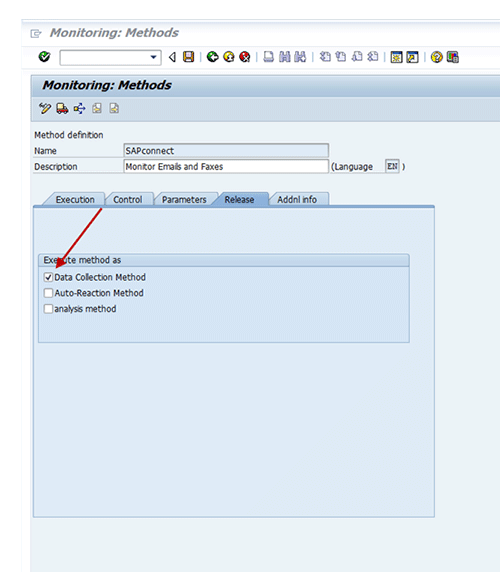
Step 5. Maintain options on the Release tab (Figure 6). Select the Data Collection Method check box and save the method.

Figure 6
Enter release parameters
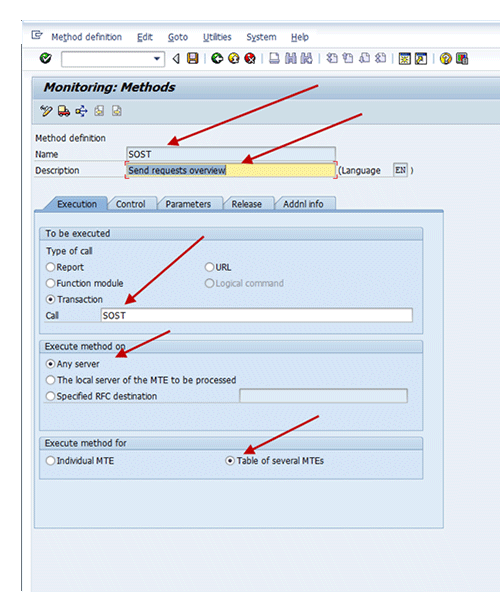
Step 6. Create an analysis method called SOST. In the screen in Figure 2, click the create icon to bring up the screen in Figure 7. Transaction code SOST displays an overview of all the send requests and allows you to manage all messages sent using SAPconnect. This method analyzes all the requested transmissions. Enter SOST as the Name and Send requests overview as the Description. Select the Transaction radio button and enter SOST in the Call field. Then select the Any server and Table of several MTEs radio buttons.

Figure 7
Create the SOST analysis method
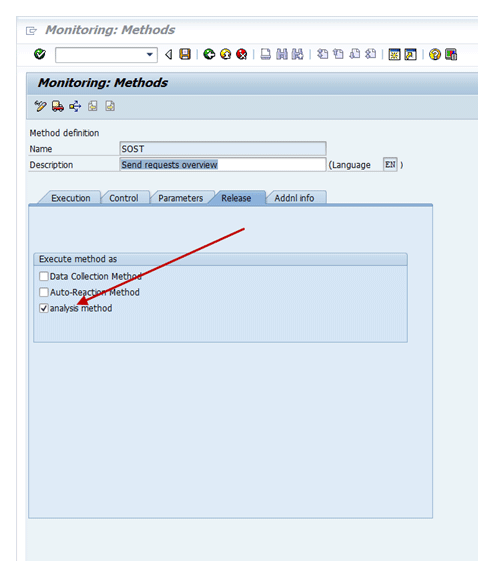
Step 7. Go to the Release tab (Figure 8). Select the analysis method check box and save the method.

Figure 8
Check the analysis method option
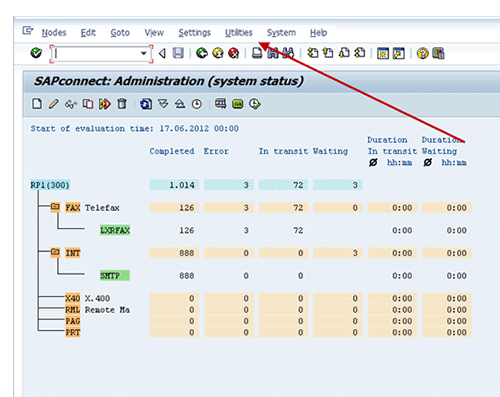
Step 8. Activate the new methods. Use transaction code SCOT (Figure 9). Follow menu path Utilities > Alert Monitor > Start Data Collection. Depending on the number of methods created, it can take five to 10 minutes for the new methods to appear within transaction code RZ20.

Figure 9
Activate the new methods
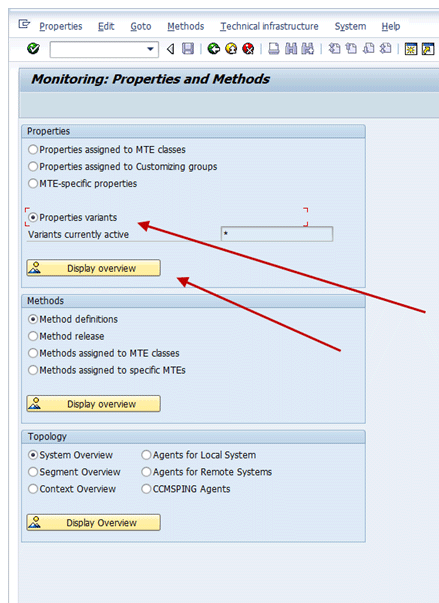
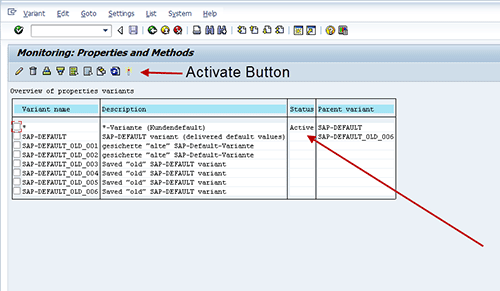
Step 9. Ensure there is an active variant using transaction code RZ21 (Figure 10). Select the Properties variants option and then click the Display overview button. Then look for an active variant (Figure 11). If one is not active, the method will not be operational, so click the activate icon to activate one.

Figure 10
Make sure there is an active variant

Figure 11
Look for an active variant
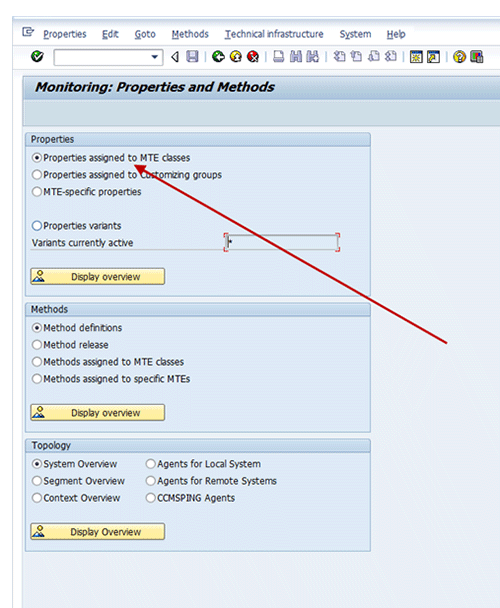
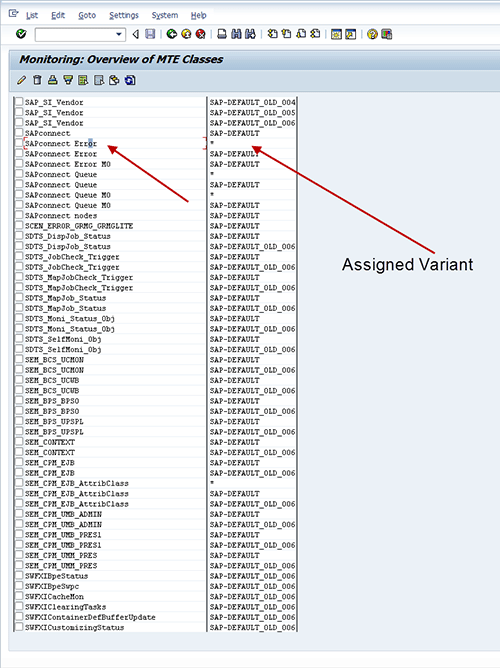
Step 10. Ensure the SAPconnect Error MTE is assigned to an active variant via transaction code RZ21 (Figure 12). Select the Properties assigned to MTE classes radio button and click the Display overview button. Look for SAPconnect Error and look for the assigned variant to ensure the SAPconnect Error MTE is assigned to an active variant (Figure 13). The SAPconnect Error MTE must be assigned to an active variant. The SAPconnect Error MTE is directly connected to the newly created methods. Without activation, the monitor does not function properly.

Figure 12
Select properties

Figure 13
Verify that the variant assigned to the SAPconnect Error MTE is active
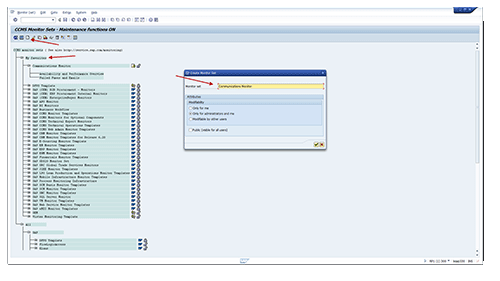
Step 11. Create a monitor set (Figure 14). Use transaction code RZ20. Select Extras > Activate Maintenance Functions, which allows you to make changes to monitors. Then click the create icon and in the pop-up screen enter Communications Monitor as the Monitor set field and select the Only for administrators and me radio button.

Figure 14
Create a monitor set
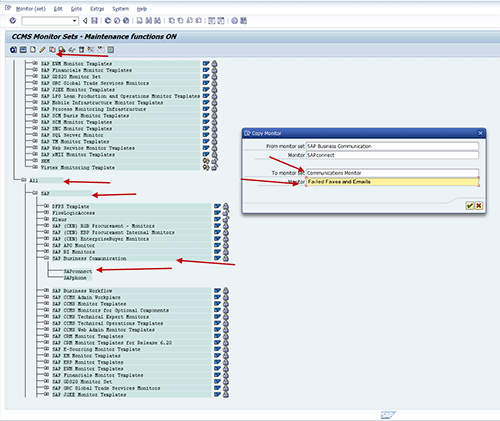
Step 12. Copy the SAPconnect monitor to the Communications Monitor set (Figure 15). Follow menu path All > SAP > SAP Business Communication > SAPconnect. Click the copy icon. Enter Communications Monitor in the To monitor set field and Failed Faxes and Emails in the Monitor field. Click the green check mark icon.

Figure 15
Copy the monitor
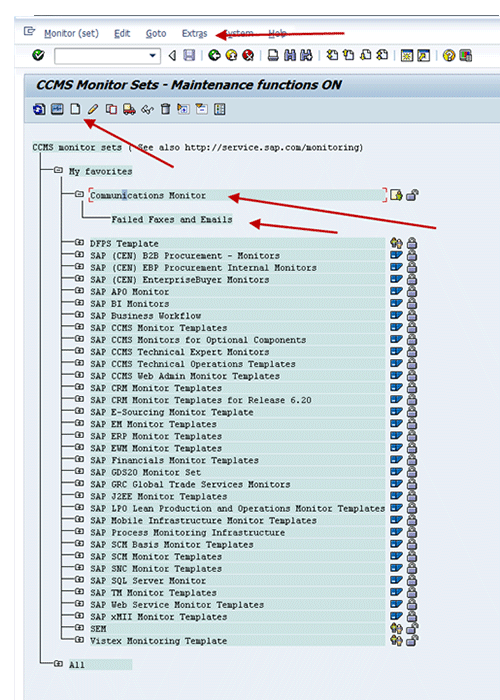
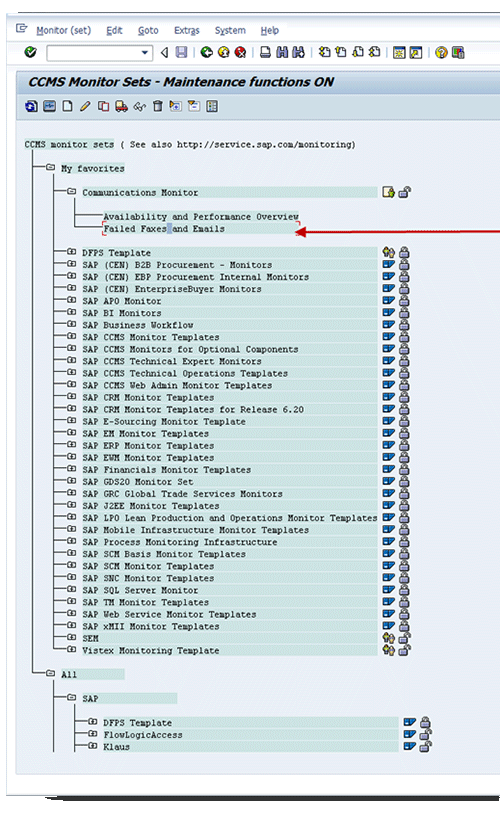
Step 13. Create the Failed Faxes and Emails MTE (Figure 16). Follow menu path My Favorites > Communications Monitor > Failed Faxes and Emails and click the create icon.

Figure 16
Create the SAPconnect MTE
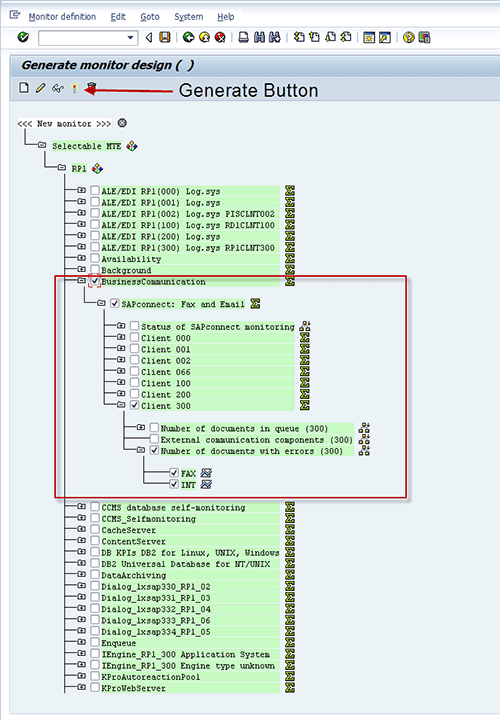
Step 14. Create the SAPconnect MTE (Figure 17). Follow menu path Selectable MTE > BusinessCommunication > SAPconnect: Fax and Email > Client 300 > Number of documents with errors. Select FAX and INT. Select all the check boxes that are selected in Figure 17 and click the generate icon.

Figure 17
Select the FAX and INT options
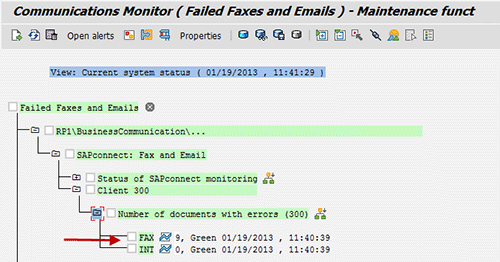
Step 15. Double-click Failed Faxes and Emails (Figure 18). Expand all the way down to the lowest point. Select the FAX or INT check box and then select the Properties button (Figure 19).

Figure 18
Select Failed Faxes and Emails

Figure 19
Select FAX or INT
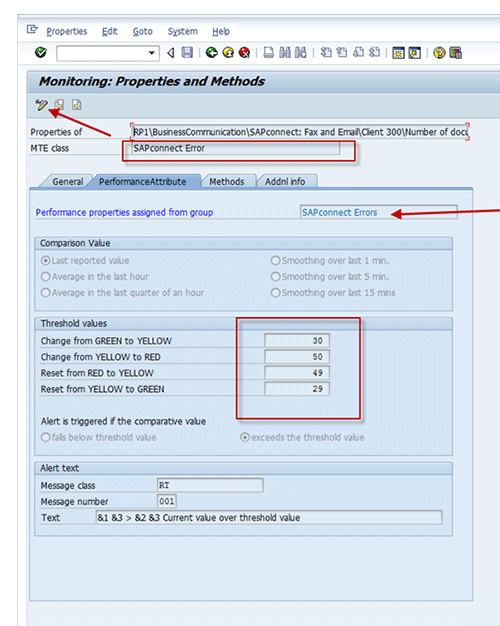
Step 16. Change the threshold values. Click the change icon (Figure 20). Under Threshold values, adjust the values to the desired range. Note the MTE class name is SAPconnect Error. You need it later when creating a metric in transaction code SOLMAN_SETUP.

Figure 20
Change the threshold values
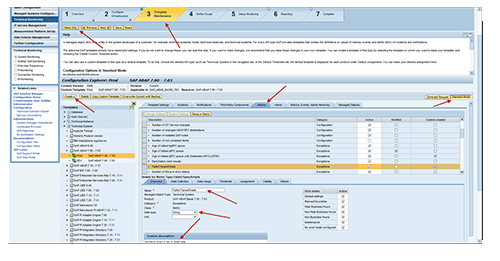
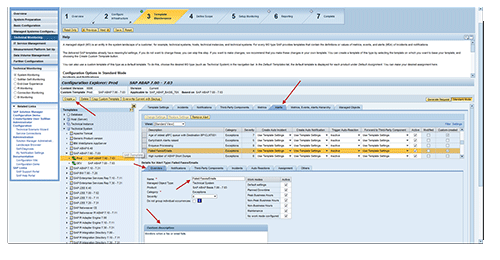
Step 17. Create a metric in transaction code SOLMAN_SETUP (Figure 21). Go to step 3, Template Maintenance. Click Edit and then Expert Mode. Under Templates, expand Technical System and select the appropriate version of SAP NetWeaver. Then Select Production. Click the Create button and then click the Metrics tab. In the Name field, enter Failed FaxesEmails. In the Category field, select Exemptions, in the Class field, select Metric, and in the Data type field, select String. Under Custom description, enter Monitors when a fax or email fails.

Figure 21
Perform template maintenance
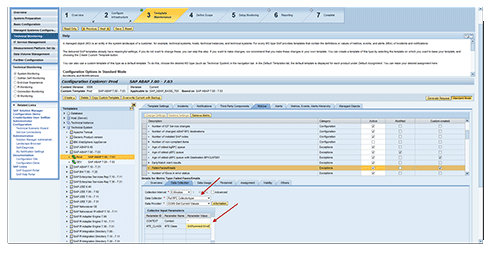
Step 18. In the lower section, click the Data Collection tab (Figure 22). In the Collection Interval drop-down select 5 Minutes. In the Data Collector drop-down select Pull RFC Collectortype. In Data Provider, select CCMS Get Current Values. In Collector Input Parameters, under Parameter Value put *. And in the Under MTE_CLASS row, enter SAPconnect Error.

Figure 22
Enter data collection settings
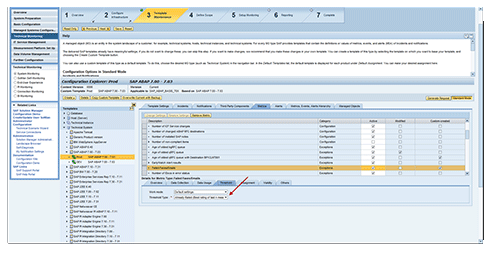
Step 19. Click the Threshold tab and select Already Rated as the Threshold Type (Figure 23).

Figure 23
Select the threshold type
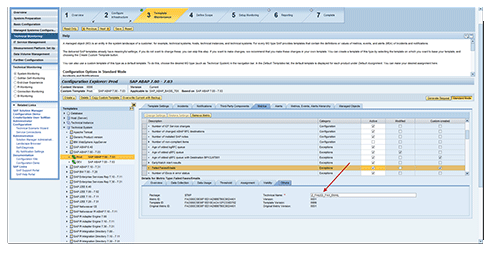
Step 20. Go to the Others tab (Figure 24). Enter Z_FAILED_FAX_EMAIL as the Technical Name. This names the attached document that is sent with the alert. Save.

Figure 24
Enter the technical name
Step 21. Create the alert (Figure 25). Click the Create button and click the Alerts tab. Then click the Overview tab and input the name Failed FaxesEmails. In the Category field select Exemptions and for the Custom description enter Monitors when a fax or email fails.

Figure 25
Create the alert
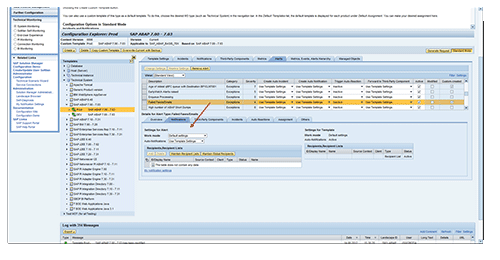
Step 22. Click the Notifications tab (Figure 26). Select Use Template Settings in the Auto-Notifications field, or add a specific recipient. Use Template Setting refers to step 2.4, where the default notification list for all templates is configured. To add a specific set of recipients beyond the default, select Active in the Auto-Notifications field. Then add the recipients that need to receive the alert.

Figure 26
Select notification settings
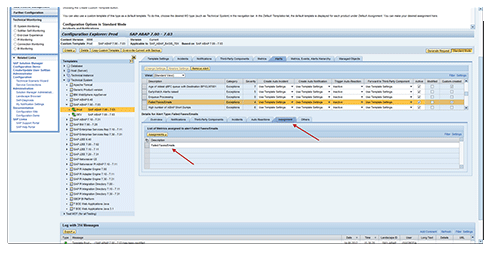
Step 23. Click the Assignment tab. Select the metric you just created — Failed Faxes/Emails (Figure 27).

Figure 27
Select assignment settings
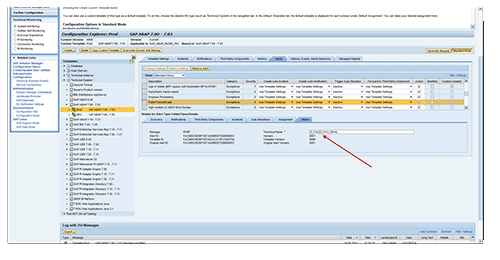
Step 24. Click the Others tab. Enter Z_FAILED_FAX_EMAIL in the Technical Name field and save (Figure 28). When asked which transport to save, use ZSOLMAN.

Figure 28
Save the transport
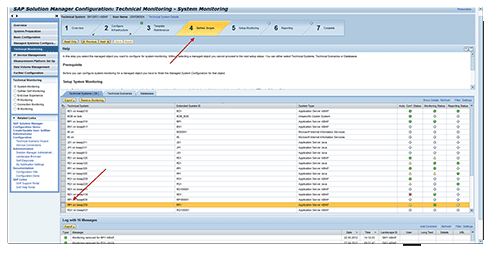
Step 25. Go to step 4, Define Scope (Figure 29). Select the technical system or systems to which you want to assign the template. Keep in mind only systems with the custom MTE can be monitored with this custom metric.

Figure 29
Assign the template to a technical system
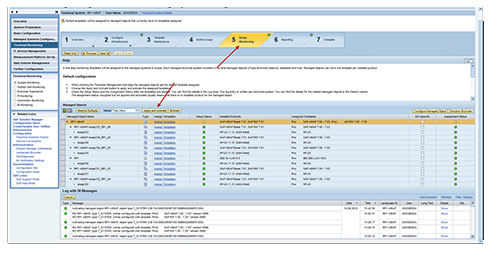
Step 26. Go to step 5, Setup Monitoring (Figure 30). Click the Apply and Activate button. This step pushes out the assigned template. Keep in mind, this can take five to 30 minutes depending on the number of systems that are activated.

Figure 30
Select Apply and Activate
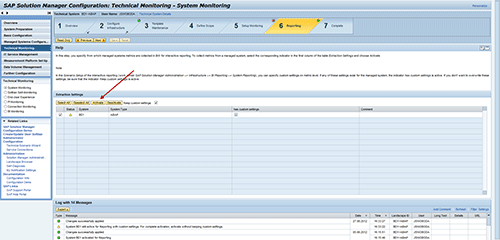
Step 27. Go to step 6, Reporting (Figure 31). Click the Activate button. The actual activation of the monitors can take up to 30 minutes.

Figure 31
Activate the monitors
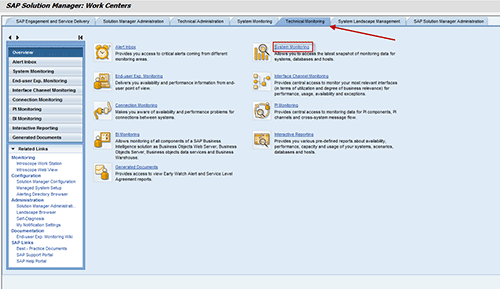
Step 28. Verify that the custom monitor is active via transaction code SOLMAN_WORKCENTER. Select the Technical Monitoring tab (Figure 32).

Figure 32
Select System Monitoring within the Technical Monitoring tab
Step 29. Select the system to which the metric is assigned. Select the System Monitoring button and within the drop-down select Start New Window (Figure 33).

Figure 33
Select the assigned system
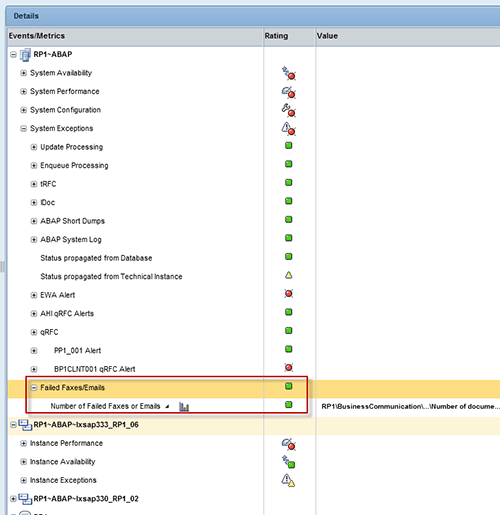
Step 30. Verify the status of the custom metric is green (Figure 34).

Figure 34
Verify the status of Failed Faxes/Emails monitor
Jereme Swoboda
Jereme Swoboda is an experienced SAP Solution Manager and NetWeaver consultant focusing on proactive technical monitoring of SAP and non-SAP systems, supporting critical business processes. He has tremendous experience pairing real-world scenarios with Solution Manager’s Technical Monitoring capabilities. He is an expert at collecting requirements, creating a monitoring strategy, and then putting that strategy to work for SAP customers. Jereme has had the opportunity to work on a variety of platforms for companies large and small integrating Solution Manager 7.1.
You may contact the author at jereme.swoboda@benimbl.com.
If you have comments about this article or publication, or would like to submit an article idea, please contact the editor.
