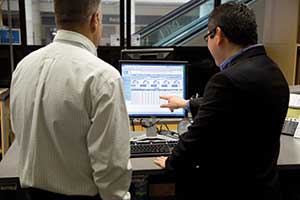
If you’ve walked into a FedEx Office center in the last 18 months, you may have noticed an improved customer experience. Perhaps the center manager greeted you at the door, steered you toward the service you needed, and stayed with you throughout the process to make sure your questions were answered and the quality of your product met or exceeded your expectations.
Formerly known as Kinko’s, FedEx Office is the retail front for FedEx Corporation. Customers can visit one of approximately 1,800 FedEx Office center locations to ship or receive a FedEx package, as well as complete any number of copy and print services such as newsletters, business cards, proposals, or photo printing.
Establishing more of a personal connection with customers, however, wasn’t necessarily the goal of a customer relationship management (CRM) initiative, but rather an end result of its SAP BusinessObjects Dashboards project completed in April 2012, after a six-month effort. FedEx Office pursued the project for several reasons, but the most noticeable benefit of company-wide dashboards from a customer standpoint was center managers’ increased availability; an offshoot result of these managers being freed up from having to prepare and study an array of center-specific diverse reports.
While many of the reports on center manager desks were funneled through SAP BusinessObjects Web Intelligence, regional and district offices also created their own reports on Microsoft Excel, which they would then email to the center offices under their purview. There were also organizational reports to study, which at times highlighted different initiatives than those created at the center, regional, or district levels.
"There were too many different reports being prepared for center managers," says Andy Mills, FedEx Services Business Intelligence and Data Warehouse Manager. (FedEx Office and FedEx Services, the corporate service branch, share an IT group.) "In our diverse landscape, data wasn’t readily available to center managers in a way that was easy to use."
Cooling Off with 'ICE'
With the 1,800 center managers each having a unique reporting structure and interpreting those reports differently, business goals were often prioritized out of sync with district or regional goals. Conversely, even if goals were aligned, it took a lot of manpower to arrive at that conclusion. FedEx Office noticed something else happening as well: Center managers who built usable reports would often be tasked with building dashboards on a district or regional basis. And these dashboards lacked oversight processes to know which reports were winding up with which center.
"In the end, you could have 1,500 different views of how the business was running, which runs counter to trying to improve the organization by increasing revenue in certain areas," says Mills. "While everyone was working on building revenue and quality, they were doing it differently, which wasn’t the most time efficient and raised the potential for lost revenue."
This was the overarching impetus for FedEx Office’s "In-Center Excellence," or "ICE," project, which began in mid-2011 when business and IT teams, which included Gary Pinkerman, FedEx Office Manager for Operations Analytics and Reporting, started taking a close look at its existing business intelligence (BI) approach. While FedEx Office was an existing SAP BusinessObjects customer and had already purchased SAP BusinessObjects Dashboards (formerly called SAP BusinessObjects Xcelsius), the business had never actually used the solution.
"The first step was to build a simple dashboard that we integrated into Microsoft SharePoint to see how it would work," Mills explains. "We had several meetings up through senior management before we were comfortable presenting it to our COO and CEO." Soon, Mills, Pinkerman, and the budding ICE team were able to convince the C-level executives that they could build a solution using existing tools, maintain it on-premise, complete the project in six months, and stay within budget.
ICE Sculpture
With approval, the core ICE team was expanded to include business partners from the head office, as well as regional, district, and center managers. Anticipating that change management would be important to the project, the team also included representatives from FedEx Office learning and development teams as well as an external BI systems integrator (Pixstar, Inc.). The core group met every afternoon for a progress review during the development of the project.
While the technical aspects of the project would, of course, take some time, the core team members also had to design the look and feel of the dashboards they wanted to implement with predefined key performance indicators (KPIs). "The teamwork brought everything together, and we couldn’t have been successful without our partners out in the field," Pinkerman says. "That feedback and input from district and center managers really helped us fine-tune the dashboards."
As an existing SAP BusinessObjects customer, FedEx Office had somewhat of a head-start in meeting its ambitious six-month timeframe, but a company-wide transformation of its front-end BI system wasn’t without some challenging technical considerations. One concern was that its dashboard solution would have to significantly improve the reporting time from standard SAP BusinessObjects Web Intelligence reports, where a 30-second or so wait for results isn’t unusual. This meant changing the data warehouse fields, aggregating the data to address the preset metrics for each KPI. Before, transactional data was kept at the transactional level and available to the center that needed it in raw form. By changing the fields, queries in SAP BusinessObjects Dashboards could then query multiple records at the aggregated level, significantly speeding up reporting.
Of course, this improved performance also necessitated a restructuring of the FedEx Office server environment to support SAP BusinessObjects Dashboards, as opposed to the previous scenario where the web intelligence tool was in place.
"Because SAP BusinessObjects Dashboards is very process-heavy in terms of running a lot of processes at once, we spent a lot of time tuning our servers," Mills explains. "When we started to perform load testing to get it up and running for 2,000-plus people, the test system crashed with the first load. We had to learn as we went along how to structure it, and we worked with SAP to adjust the environment to get it right."
ICE Results
As defined by the ICE team, increased server performance would process metrics surrounding five predefined KPI groupings: Revenue, Payroll, Shipping, Service Quality Index (SQI), and Voice of the Customer.
As the dashboard design evolved throughout the six-month project, IT would continually re-architect the data warehouse environment to make sure that data was aggregated in a way that would support the visual within a six-second reporting window. By design, the architecture also had to support the visual for multiple interfaces. Mills says that the ICE team determined that the best way for FedEx Office managers to derive actionable intelligence from the dashboards would be to organize them in split-level views. At the first level, a center manager could look at a dashboard to see the center’s performance — basic sales, revenues, payroll, etc. The second level, though, could allow for a drill-down at the product level, provide detail on shipping volume, or even look more closely at quality metrics.
"The intention was for the first level to provide views on things that could provide immediate impact, while the next level could allow you to look at information in greater detail for trending analysis," says Mills. "This may have been something that centers did on their own, but we never had this as a reporting tool. Organizing it like this has been an effective way to increase both awareness and revenue moving forward."
The secondary dashboard was also built to include links to more standard reports, so a manager wanting additional information would know precisely where to look. And because these standard reports are accessed through the dashboard, the intention is for them to now carry more context for a center manager having already looked at the dashboard, even though the information they provide might not differ from before.
Refreshing Change
Approximately six months after the April 2012, launch date, FedEx Office conducted an initial project evaluation and discovered that with the new dashboards, center managers were spending roughly 10% less of their time pulling, analyzing, and creating reports than in the previous landscape.
"We’ve since found that this free time has been spent productively in both opening up more available facetime with customers, which drives revenue, and allowing more time for team coaching, driving upsell opportunities," Pinkerman says. "It’s not labor savings, because we didn’t reduce staff. But we converted that time to revenue-generating activities."
Revenue opportunities also increased, Pinkerman says, by the simple fact that center managers now have a clearer picture of the overall organizational goals. Not only do they have additional time to spend on the floor, but they know how to best utilize that time as they interact with customers. As Pinkerman explains, "Now, our center managers can look at a report and know exactly where their center is at compared with other centers, and how what their center is doing fits in with the performance of their district, region, or the company as a whole."
This newfound capability is also proving beneficial to district managers and C-level executives who make frequent site visits, giving them the ability to pull data on a particular center prior to a visit. This is one reason why a future consideration is to extend SAP BusinessObjects Dashboards on a mobile platform, giving the traveling executives data on the go.
Mobility, though, isn’t a prerequisite for the overall success of ICE. "We delivered on-time and under budget," Mills says. "If we compare revenue to overall cost, we really hit it out of the park with this ICE project."