SAP HANA (BW on HANA, BW/4HANA, S/4HANA) system provides several system views to capture deeper insights and information about HANA. System views can be used (manual data preview) to evaluate the amount of memory used by individual tables, out of memory dumps (OOM), authorization overview and other such parameters. My
last article was on the basics of HANA calculation views. This article focuses on HANA authorization, OOM/SQL analysis, finding HANA system views and using them with calculation views to enhance organization’s monitoring capabilities.
HANA authorizations
When using HANA SQL script and calculation views, the invoker’s rights, in semantics view properties, should be selected (Figure below.)

The default is definers rights, but this grants developer rights to whoever executes the view later. This can create problems if the reporting user is not allowed to see data. Using invoker rights will display the expected results related to proper authorization of the reporting user but the system will display an error message if executing a view with insufficient rights (Figure below.)
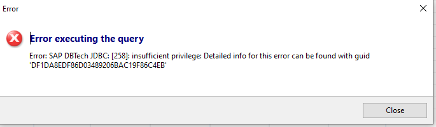
The below SQL statement can be used to get details about the problem (xxx need to replaced by the displayed GUID as shown above).
CALL SYS.GET_INSUFFICIENT_PRIVILEGE_ERROR_DETAILS ('xxx',?)

In the above image, the problem is a missing analytical privilege. Although transactions details and other information can be accessed to view the privileges a specific a user is granted, an overview of role authorizations or specific users is hard to establish. But, this can be changed by customer calculation view.
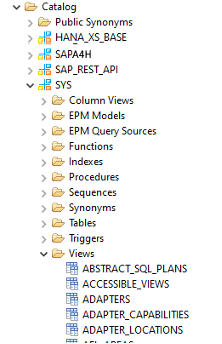
SAP provides system views (most of them) in schema SYS (authorization is required to read the schema) and underneath the views folder (see figure below.)
In calculation view, we will use the below:
- GRANTED_PRIVILEGES
- Display of each privilege (analytical etc.) per user
- GRANTED_ROLES
- Display of all roles assigned to user
If needed, table USR02 [SAP Application user (not HANA user)] can be added. The below image shows what the complete model looks like.
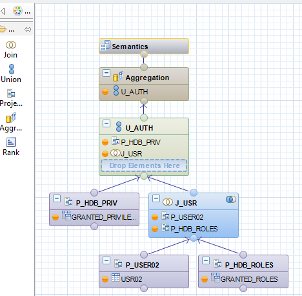
The mapped table columns of the user/roles ‘Join’ and ‘Union’ and counter based on aggregation can be seen below.
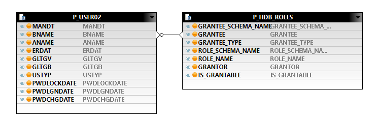 Join - J_USR
The is defined as left outer on USR02.BNAME to GRANTED_ROLES.GRANTEE (Grantee is the HDB user)
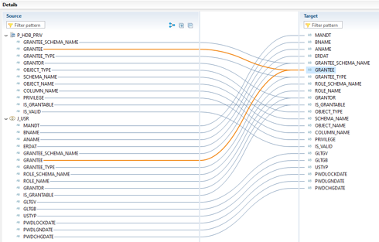 Union U_AUTH
All related (used) table fields are connected and the columns GRANTEE, GRANTOR and IS_GRANTABLE are mapped to both input sources. In aggregation, two calculated columns (based on BNAME (user) and role (ROLE_NAME) can be defined to count the objects.
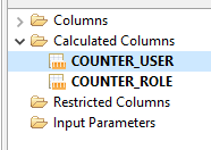 Aggregation
Users/Roles for missing or falsely assigned values can be analyzed by looking at the result of calculation view in HANA Studio or Analysis for Office. Information can be retrieved through the following:
- Who (User/Grantee) can access which schema

- What User/Grantee has privilege for specific analytical objects

Out of memory (OOM) SQL analysis
Each HANA process (SQL query statement) uses as much HANA hot memory as needed.
A safety stop for each memory to reduce the maximum usage to the desired value should be set up. A threshold for a 2 TB could be set to 400 GB. In case any process reaches this threshold, it will be stopped by the system to ensure the system stability. Further information can be found in SAP KBA
1999997 - FAQ: SAP HANA Memory. An example of 350 GB threshold is displayed below.
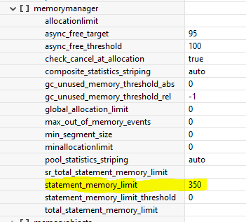
To create such a threshold, the *.ini files via GUI can be changed or SQL statement can be run —
alter system alter configuration ('global.ini','SYSTEM') SET ('memorymanager', 'statement_memory_limit') = '350' with reconfigure;
In case a HANA process uses more memory that is defined or (without threshold) available, an Out of Memory (OOM) event will be raised and the process will be stopped. Details of OOM can be accessed through HANA system views in schema SYS:
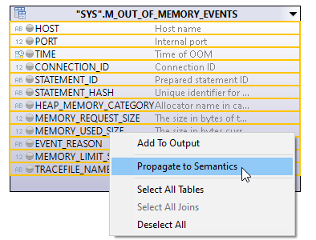
- M_OUT_OF_MEMORY_EVENTS
- Displays information about last twenty (can be adjusted) OOM’s occurred
The below figure shows OOMs that occurred in a live system (memory display in bytes.)

In the above, there is no valuable information beside when an OOM occurred, the memory limit, and the SQL accessed memory (MEMORY_USED_SIZE). Information about what SQL query created the OOM dump is hidden within the STATEMENT_HASH entry (GUID).
Because all executed statements are using HANA PLAN_CACHE (to ignore optimizer for performance reason), the plan cache information can be used as well. System views are (schema is named before view name separated by dot):
- M_SQL_PLAN_CACHE
- HOST_SQL_PLAN_CACHE
Entering the STATEMENT_HASH value provided by the view M_OUT_OF_MEMORY_EVENTS, will unveil the used memory size and display what user fired the OOM event and what statement (STATEMENT_STRING) caused it.

A calculation view can be generated for this.
Quick Tip: It is easier to propagate fields to semantics than adding them to individual steps (this can be done by selecting the desired fields by right clicking on it and selecting “Propagate to Semantics”)
System views can then be added by projection to calculation view.
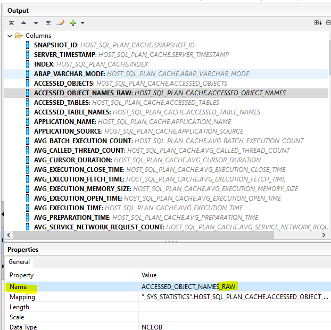
Hint: If columns from HOST_PLAN_CACHE are used, they must be redefined as NVARCHAR (type NCLOB is not usable in analytic frontends):
- ACCESSED_OBJECT_NAMES
- ACCESSED_TABLE_NAMES
- STATEMENT_STRING
To reuse the original field name, like ACCESSED_OBJECT_NAMES, it can be changed to xxx_RAW.
As shown in figure below, the original field name is changed to ACCESSED_OBJECT_NAMES_RAW and by doing so the original field name can be used for the new defined column name.
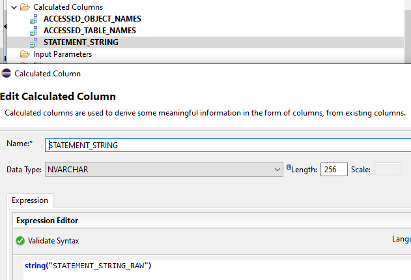
(HANA features like ALIAS in SQL Script can be used to change the original format. Output column can be selected and the name can be changed in properties to the desired name as shown below.
To use the NCLOB columns in Analysis for Office, string can be restricted to 256 characters (as done in the example) MS-Excel displays up to 1024 characters in a single cell and characters are viewable in formula area as shown in the figure below.)
To connect the two system views, join (inner) condition is used to show only OOM relevant information on HOST, PORT and STATEMENT_HASH columns. NCLOB columns should be removed to activate the calculation view (renamed to xxx_RAW in example).
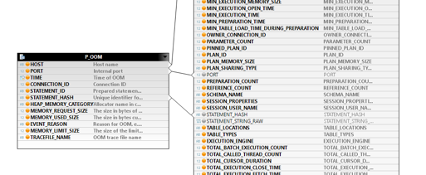
In the last part before activation, RANK object needs to be added due to multiplying lines of JOIN functionality and lines (based on STATEMENT_HASH) need to be restricted to one single line (as displayed in image below.)

Out of Memory (OOM) calculation view show the number of OOMs that occurred, the users who created them, and the application that was causing OOM and the SQL statement.
 Conclusion
System stability and customer satisfaction can be enhanced by using the calculation view irrespective of lines (for example, in broadcast functionality, BIAnalyst provides a simple Analysis for Office Broadcasting tool.) By analyzing the problematic SQL statement in the view, problems can be identified, and based on this, SQL statement can be rearranged to reduce memory problems and exhaustion.