SAP Analytics Cloud – Enhancements to Improve User Experience
Leverage the Latest Features of SAP Analytics Cloud
Meet the Experts
Meet the Authors
SAP Analytics Cloud has been available for a few years now, with many customers using the product or thinking about implementing it. Perhaps you’re using SAP Analytics Cloud for analytical scenarios or planning scenarios, and are aware of the enhancements being delivered each quarter. In this article, we’ll focus on a set of critical enhancements to SAP Analytics Cloud that have been delivered in the last few months.
New Look and Feel and Simplified Navigation
Starting with the Q3 2021 release of SAP Analytics Cloud, you will find an improved user experience and an easier and simpler navigation across all the different elements of SAP Analytics Cloud.
Figure 1
Explore related questions
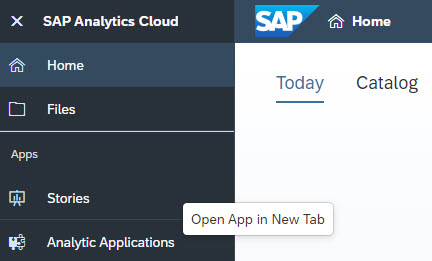
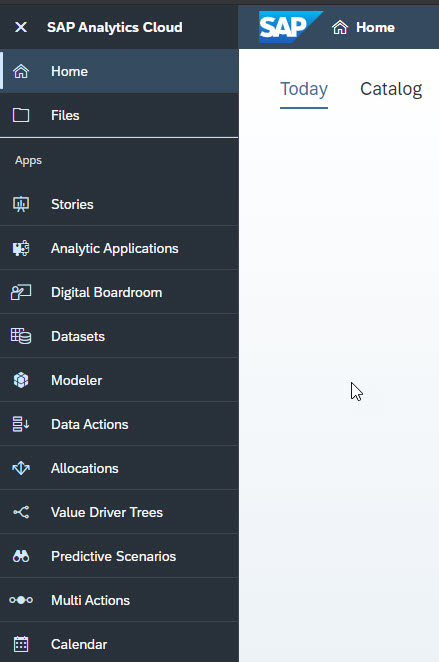
Upon logging in and updating SAP Analytics Cloud, you will notice the side panel (see Figure 1), which allows you to navigate to the most important elements of SAP Analytics Cloud. Also, you can also use a right-click navigation and open the menu option — for example the menu Stories — in a new tab without closing your current tab (see Figure 1).
Figure 2
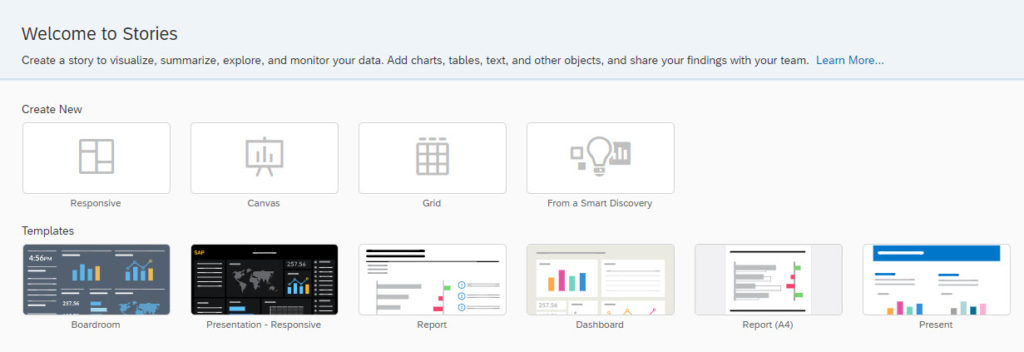
In addition to the simplified navigation bar, the starting pages for each area — see Figure 2 for the Stories — now provide a consistent experience and access to the option to create new assets, leverage templates, or access the most recent files.
Figure 3

Another very useful simplification, is the available breadcrumb navigation (see Figure 3), which allows you to quickly recognize the complete file path of your assets as well as the option to navigate to any part of the file path with a single click.
Figure 4
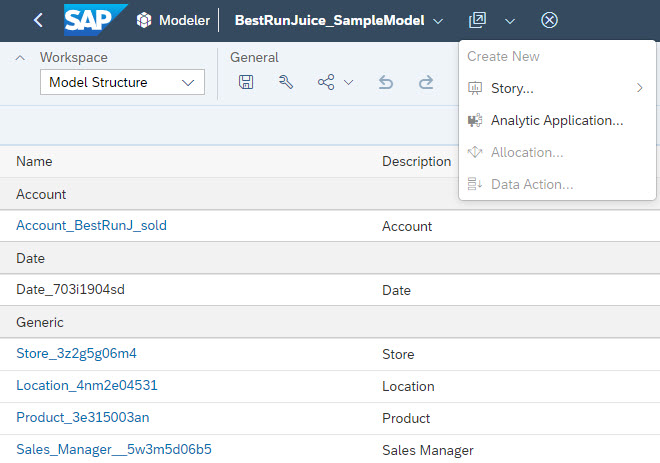
And finally, you also have a new Actions menu available, which provides a set of shortcuts depending on where you are in SAP Analytics Cloud. For example, in a situation where you open a model, the Actions menu gives you access to the option to Create a new Story or to create a new Analytical Application based on the model that you have in front of you (see Figure 4).
In case you are interested in the complete details on the Design Changes for SAP Analytics Cloud, follow this link for more details: https://help.sap.com/doc/ef88477ad0a34fcbb4a9090ab5c985a9/release/en-US/79b1bfad130f402ab08ffaf0d8d6dc28.pdf.
New Model
Following the changes in the navigation and the additional options, such as the Actions menu, you will notice that SAP Analytics Cloud also gives you the option to leverage a new Model type and the option to choose between the new model or the classic account model (see Figure 5).
Figure 5
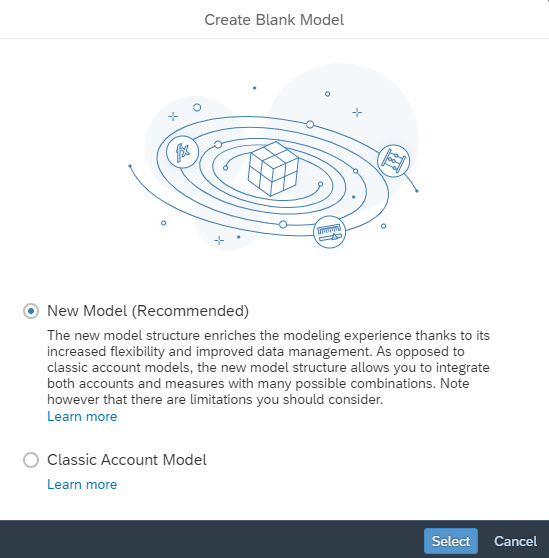
So, what are the benefits of the new model?
- What is known from the previous model as Account Dimension is now optional and you have accounts as well as measures available as part of the new model.
- You now have the option to define explicit data types, such as integer or decimals, which helps to avoid incorrect data, such as decimals, when planning headcounts.
- You can now add measure calculations to your model and make them part of your model, allowing you to share those calculations across stories and analytical applications.
- You now have the option to add multiple base currencies to your model and the required currency conversions.
- With the new model, you can also use the advanced expressions that have already been available as part of the data wrangling process for datasets.
But the new model still has some limitations, such as:
- Currently, Value Driver Trees are not supported
- Complex time dependent options, such as Year-over-Year (YoY) or Compound Annual Growth Rate (CAGR) are not supported
- Geo dimensions are not supported
- The Rebuild Model option is not supported.
You also have the option to migrate an existing classic model to the new model, but there are some restrictions on the migration. Please follow this link for further details:
Optimized Story Viewing
Some of you might already experience this option, but for others this is still a new capability. SAP Analytics Cloud is now offering an Optimized Story Viewing experience, which helps to improve the performance and also provides usability improvements. Currently (Q3 2021), not all features of SAP Analytics Cloud are available as part of the Optimized View mode, so you have to carefully evaluate your existing SAP Analytics Cloud Stories to see if the Optimized View mode should be enabled. An important note is that these limitations will be removed over time.
In addition to the performance improvements, here are some of the usability improvements.
- View Time Undo/Redo. Viewers of your SAP Analytics Cloud Stories now have the option to use Undo and revert specific actions, such as selecting a filter value or defining a Top 10 ranking.
- Loading Indicator. Charts will now show a loading indicator while the data is being retrieved.
- Tooltip Improvements. The Tooltip of a specific data point and the interaction menu are now displayed together.
- Input Controls. The width of Input Controls has been expanded, providing more space for elements, such as long customer names, in case of filter values based on a Customer dimension.
- Hierarchy Interaction. Hierarchies will now load the child values of hierarchy nodes on-demand, leading to overall better performance of hierarchies.
Especially on the Optimized Story Viewing, it’s highly recommended going through the material in detail before enabling the option for your existing content. Make yourself familiar with the current limitations:
- Enabling Optimized View Mode:
https://help.sap.com/doc/00f68c2e08b941f081002fd3691d86a7/2021.4/en-US/85de90461cf94b788cef68723ca12057.html?css=https://sap-i819910.us1.projectorca.cloud/sap/fpa/services/rest/epm/feature/css?tenant=2 - Optimized View Mode Limitations:
https://help.sap.com/doc/00f68c2e08b941f081002fd3691d86a7/2021.4/en-US/2d00f5ff0c9245a99a9df96cb83236a9.html?css=https://sap-i819910.us1.projectorca.cloud/sap/fpa/services/rest/epm/feature/css?tenant=2 - Optimized View Mode Improvements:
https://help.sap.com/viewer/DRAFT/b103a251020746f786ec0860fa51a63a/release/en-US/1f0e3adc73384dbb8b1ae05e5753155b.html
Enterprise Reporting
Most of our customers will think of dashboards and ad-hoc analysis when they think about SAP Analytics Cloud, but it now also provides reporting capabilities. In SAP Analytics Cloud, you now have the ability to add Sections to your canvas (see Figure 6).
Figure 6

Sections provides the story designer with the option to break-up the report into smaller parts and have a repeated part based on specific dimension members.
An example is displaying your revenue for the year 2021, but broken down by month and country, You could create a chart showing the revenue by month and filter by country, or you could use a Section in SAP Analytics Cloud and then display an identical chart for each country (see Figure 7).
Figure 7
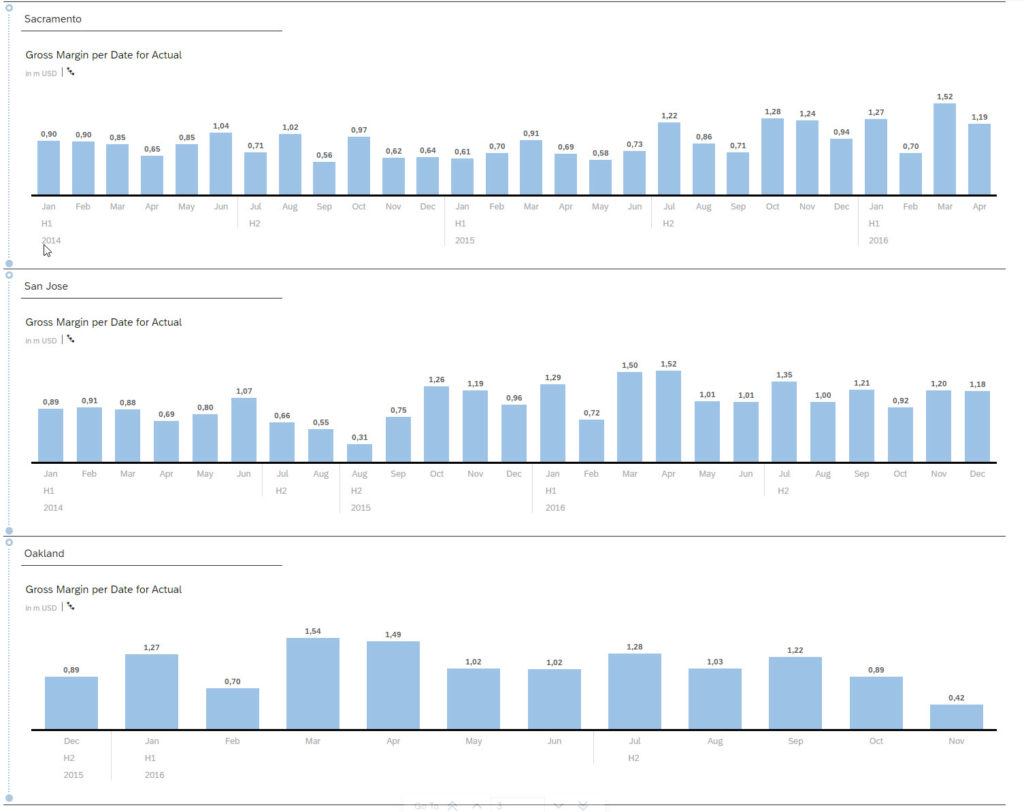
In SAP Analytics Cloud, rather than create and format multiple charts, you would instead create a new Story and add a Section to your Story. In our example, the Section would be based on dimension Country, and each member of dimension Country would then be used as a filter for the section. However, you only define, configure, and format the section once. And when viewing the Story you would see the same Section for each Country member (see Figure 7).
Sections is just a starting point to add more Enterprise Reporting capabilities to SAP Analytics Cloud, so stay tuned for more capabilities in this area.
Data Exploration
Another part of SAP Analytics Cloud is the option to launch the Explorer workflow (see Figure 8). Previously, you had the option to launch the Explorer mode from a specific chart or table.
Figure 8
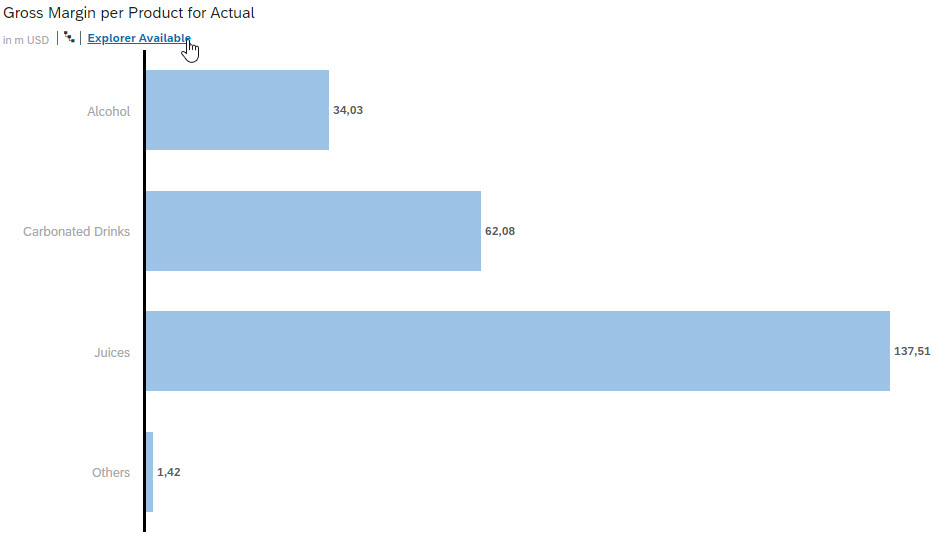
The consumer of the story is then able to launch the Explorer mode and leverage the complete dataset that is the base of the chart (see Figure 9).
Figure 9
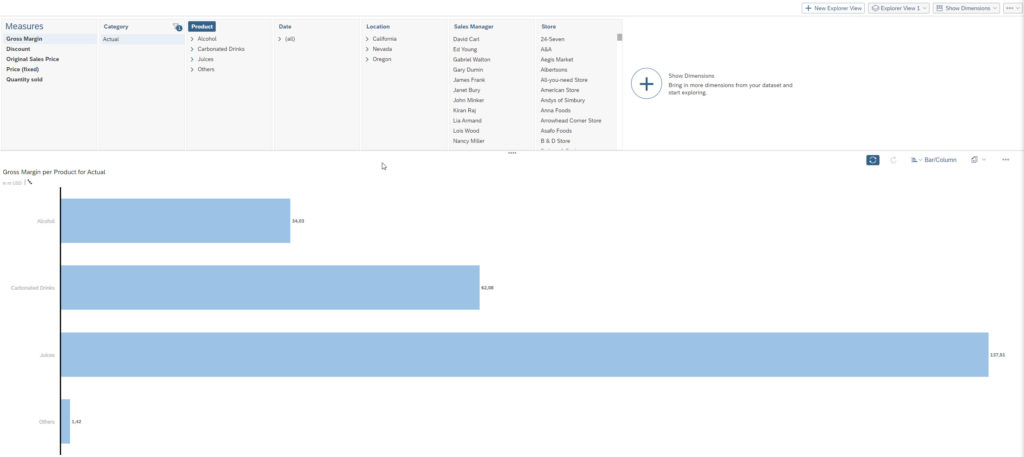
The consumer would then have access to all dimensions, all measures, and has the option to change the visualization and quickly browse through the complete data set, but it always starts with the step to open the Story and launch the Explorer Mode from a specific chart or table.
With the new features, the Story Designer also has the option to configure Explorer as the default mode.
Figure 10
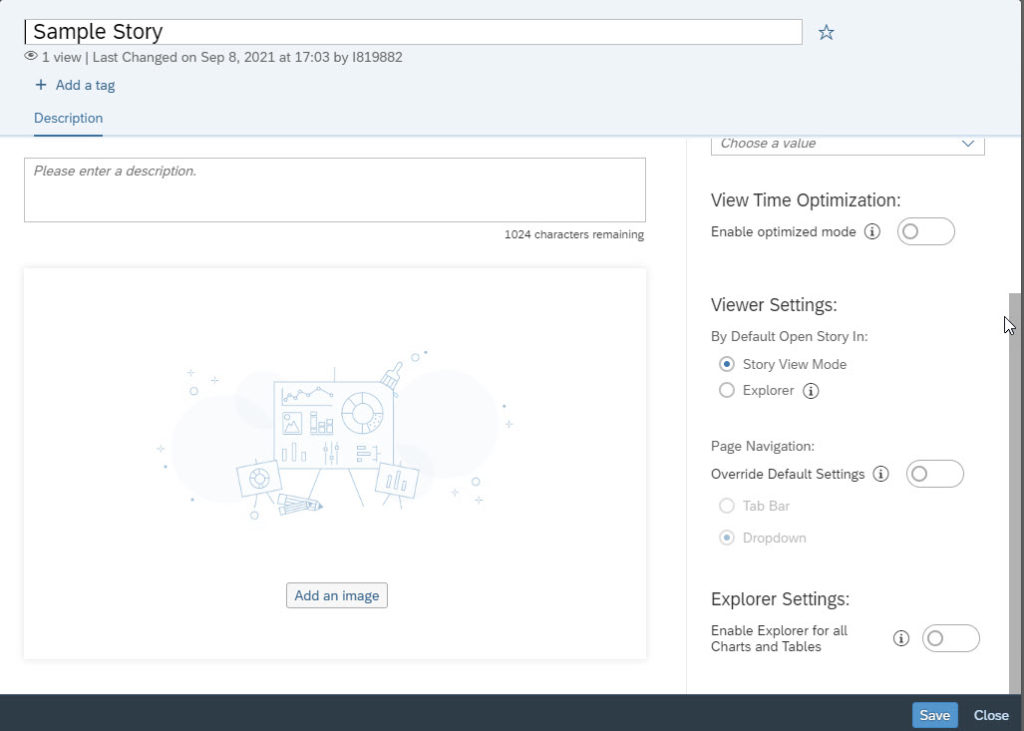
As part of the Story Properties, the Story Designer can configure the default mode, and instead of opening the SAP Analytics Cloud Story, view the chart, and launch the Explorer Mode from the chart, the Story would then open directly in the Explorer Mode (see Figure 10).
- Please note, that there are some limitations with this option:Using the mobile application or when using Safari as the mobile browser accessing SAP Analytics Cloud, the Story View Mode will be used.
- When using the Optimized Viewing option, the Story View mode will be used.
- In case no chart or table has been enabled for using the Explorer Mode, the Story View Mode will be used.
This quick summary includes some of the latest features of SAP Analytics Cloud to help you learn and leverage those options quickly. Watch for the next set of features in the near future.
What Does This Mean for SAPinsiders
• Leverage the new simplified navigation elements of SAP Analytics Cloud. Often, new technology comes with complex menus and navigation. As a forward-looking software solution, SAP Analytics Cloud has simplicity in mind so that users can make the most strategic use of the software right away.
• Experience the new reporting capabilities. SAP Analytics Cloud provides you with more layout control. Using the story designer within Sections, segment your reports into smaller, more digestible parts. Or repeat parts based on specific dimensions (e.g., month and country).
• Capitalize on the optimized story viewing mode to help improve overall performance. Use such features as view time undo/redo, loading indicator, and tooltip improvements for greater performance and usability.


