Improving Supply Chain Resilience with SAP Business Networks – Value Analytics
Disruptions to supply chain metrics are often due to unforeseen events such as natural disasters, global pandemics, or economic downturns. It is essential to look at the most critical KPIs and review how organizations can decrease costs, increase customer satisfaction, and become more agile, responsive, and quicker in adapting to the unexpected challenges.
Insufficiencies in supply chains can occur due to a variety of factors, such as inadequate capacity, delays in transportation or production, or issues with suppliers. Supply chain metric insufficiencies can cause several challenges for businesses. These can pertain to lost sales, customer dissatisfaction, and damage to the company’s reputation.
In addition, supply chain metric inefficiencies can result in higher costs for businesses as expediting orders or sourcing materials from alternative suppliers may come at a higher price. Thus, it is crucial for organizations to continuously monitor and optimize their supply chain metrics to ensure that it is sufficient to meet demand.
Leading vs. Lagging KPIs
When it comes to leading vs. lagging KPIs, the first step is to focus on leading KPIs instead of looking at the classic lagging KPI. Leading KPIs are predictive in nature and help businesses identify potential problems or opportunities before they occur. They are called "leading" because they lead or precede changes in a company's performance.
Leading KPIs are useful for identifying trends and patterns and can proactively help businesses to make changes and improve performance. Examples of leading KPIs include customer satisfaction scores, employee engagement, and on-time delivery.
Lagging KPIs, on the other hand, reflect a company's past performance. They are called "lagging" because they follow or lag behind changes in a company's performance. Lagging KPIs are useful for measuring the results of past actions, but they do not provide insights into the underlying causes of a company's performance. Examples of lagging KPIs include revenue, profit margin, and return on investment.
Both leading and lagging KPIs are important for businesses to track as they provide different types of information about a company's performance. Leading KPIs can help businesses identify opportunities for improvement and take proactive action, while lagging KPIs provide a measure of the results of those actions.
Lead-Time and On-Time, In-Full (OTIF)
Lead-Time and On-Time, In-Full (OTIF) are critical Key Performance Indicators (KPIs) in supply chain management because they can have a significant impact on a business's operations and bottom-line. In today's fast-paced business environment, it is more important than ever for companies to have efficient supply chains that can meet the needs of their customers.
Long lea- times and poor OTIF performance can lead to missed delivery deadlines, stockouts, and overstocks, and can damage a company’s reputation. By monitoring and improving these KPIs, businesses can reduce costs, increase customer satisfaction, and improve competitiveness.
Lead-time and OTIF are also relevant for building supply chain resiliency in addition to improving supply chain efficiency. Organizations can reduce their reliance on a single supplier or transportation route by minimizing lead-time and maximizing OTIF, which can help to mitigate the impact of disruptions.
Additionally, reducing lead-time can help organizations to better manage their inventory levels, which can reduce the risk of stock-outs or excess inventory that may become obsolete. Overall, optimizing lead-time and OTIF can help organizations build more robust and resilient supply chains that are better equipped to weather the storms of volatility.
An increase in lead-time can lead to increased costs by causing an increase in inventory holding costs. If a company has a longer lead-time, it may need to order its raw materials or finished goods farther in advance to ensure that it has enough on hand to meet demand.
This means that the company will have these materials or goods in inventory for a longer period of time before they are used or sold. This can result in increased storage and handling costs, as well as an opportunity cost associated with tying up capital in inventory rather than using it for other purposes.
For example, if a company orders raw materials with a lead-time of four weeks, it needs to have enough of these materials on-hand to meet its production schedule, and orders enough to last eight weeks (two lead-times). This means that it will have the raw materials in inventory for eight weeks before they are used. If the lead-time is increased to six weeks, the company will need to order enough raw materials to last for 12 weeks (two lead-times), resulting in an increase in inventory holding costs.
Supplier Variability
Another critical leading KPI in supply chain analytics portfolio should be the overall supplier variability. Supplier variability refers to the degree of inconsistency or fluctuation in the performance of a supplier. It can be evaluated through a variety of factors, including delivery time, quantity and quality of goods or services, and overall reliability.
High supplier variability can be a problem for businesses because it can lead to disruptions in the supply chain and impact the ability of the business to meet customer demand. For example, if a supplier is unreliable and frequently fails to deliver on-time, this can cause delays in production and result in missed delivery deadlines to the business's customers.
Similarly, if a supplier's goods or services are of inconsistent quality, this can lead to increased costs due to defective products that need to be reworked or returned. Managing supplier variability is, therefore, an important part of supply chain management.
SAP Business Networks – Value Analytics
Monitoring Lead-Time, On-Time, In-Full, and Supplier Variability are critical elements in the journey to create a resilient, agile, and adaptable supply chain. Supplier performance metrics can help in identifying and addressing issues with supplier performance. This is where
SAP Business Networks – Value Analytics can help.
SAP Business Networks – Value Analytics solves several business challenges for organizations that struggle with inbound materials/components in their supply chain:
- Improve supply chain resilience
- Improve value associated with business network initiatives
- Offer quick wins along a continuous improvement journey
- Provide actionable intelligence
- The need for lengthy software implementations
SAP Business Networks – Value Analytics is the combination of SAP Data Warehouse Cloud, SAP Analytics Cloud, and pre-defined Business Content focusing on KPI’s such as Lead-Time, On-Time, In-Full, and supplier variability. You can leverage the predefined business content and source the needed information from your SAP ERP or SAP S/4 HANA environment.
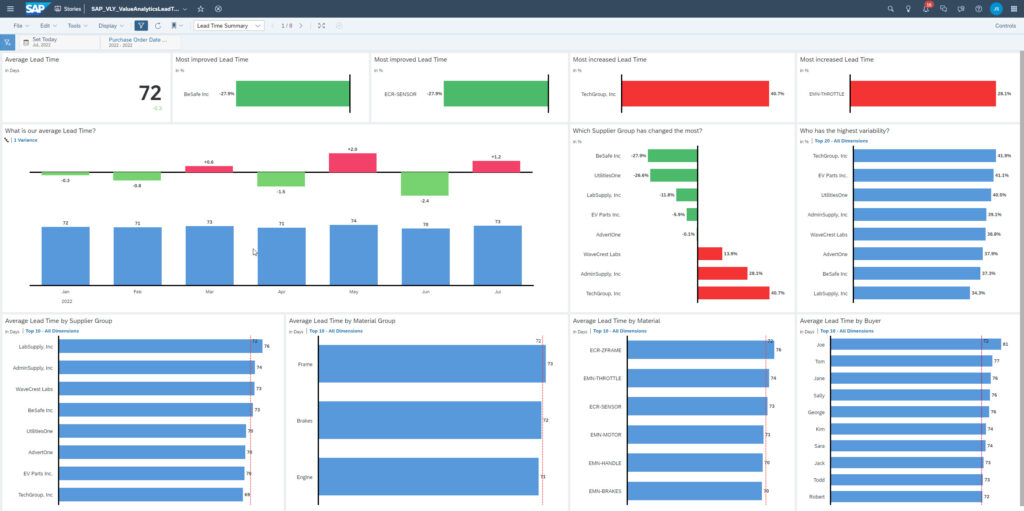
Lead Time Summary
Lead-Time Summary provides a quick overview of the overall Lead-Times for a filtered time period, and focuses on supplier and material that have an increase or decreased lead-time. In addition, it shows which suppliers have improved lead-times for the time horizon and the critical supplier variability.
![]() Lead-Time Analysis
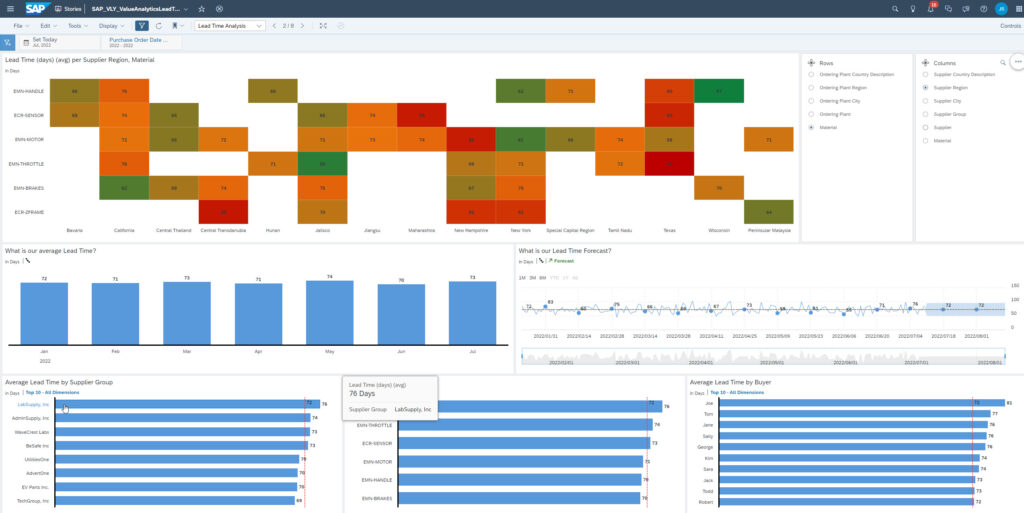
Lead-Time Analysis
The Lead-Time Analysis area gives our customers an option to dynamically analyze the Lead-Time along the most important dimensions, such as material, supplier, and procurement location.
![]() Lead Time Variability
Lead Time Variability
Lead-Time Variability provides a visual overview on the lead-time over time broken down by a dynamically selected dimension. For example, Lead-Times by month can be viewed for all the materials one is responsible for. Because one can view all the materials next to each other, one can quickly recognize trends and spikes and take action accordingly.
![]()
 Lead-Time Outlier
The Lead-Time Outlier visualization allows to dynamically select the dimensions and shows the lead-time band based on all purchase orders for the selected timeframe. This allows for a quick identification of the overall range for the lead-time for a specific material, which can be used to further analyze a supplier with heavy fluctuations in the lead-time.

![]() On-Time, In-Full Summary
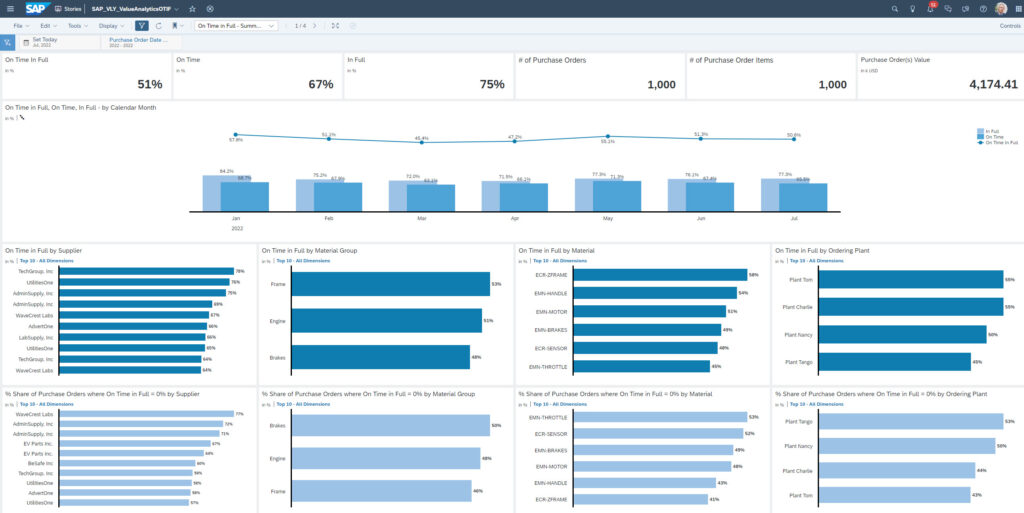
On-Time, In-Full Summary
On-Time, In-Full (OTIF) analysis provides a quick overview on the On-Time, In-Full KPIs over time broken down by dimensions, such as material, supplier, or ordering location.
![]()
 On-Time, In-Full Analysis
Similar to Lead-Time Analysis, the On-Time, In-Full analysis allows customers to dynamically choose the dimensions and see the overall On-Time, In-Full percentages in the form of a heat map to quickly recognize highs and lows, and patterns.

![]() Conclusion
Conclusion
To improve lead-time, supplier variability, and On-Time, In-Full performance, it is critical to start monitoring these leading indicators. SAP Business Networks – Value Analytics can provide a head start to this by delivering predefined business content in form of data models and analytical stories for SAP Data Warehouse Cloud and SAP Analytics Cloud.
- Analyzing Lead-Time can help in reducing safety stock, and an improved Lead-Time will lead to better inventory management and reduced inventory cost.
- Understanding Lead-Time Variability will help in identifying the most reliable suppliers and avoiding stock-out, as well as excess inventory.
- On-Time, In-Full analysis can help in identifying bottlenecks and inefficiencies in your supply chain.
- SAP Business Network – Value Analytics enables you to move from lagging indicators to leading indicators and in creating actionable insights.
Additional Resources
SAP Business Networks – Value Analytics Business Content Details