This is the second of a two-part series on #DukeMBBStats, running on SAP HANA.
Part One focused on the creation and roll-out of the platform.
For the final eight games of the Duke University men’s basketball team’s 2017 season — a stretch that included its victory over Notre Dame in the final of the Atlantic Coast Conference tournament — fans of the team had access to statistics for any player or season in the more than 100-year history of the Blue Devils. These stats were available to fans through #DukeMBBStats (accessible via www.goduke.com), a site that was launched in February 2017. #DukeMBBStats runs on the in-memory SAP HANA database to quickly provide fans with a trove of information related to anything that happens on the Duke University basketball court.
If a fan wishes to know, for example, how many offensive rebounds Jayson Tatum pulled down during the season, or just against conference foes, #DukeMBBStats instantaneously displays the information the moment a fan chooses offensive rebounds from a drop-down menu. Options are seemingly endless; die-hard fans can conceivably keep themselves busy for hours looking for answers to any question that comes to mind. For a change of pace, fans can choose to look at shot chart visualizations that show shots made and missed for each player and for any game.
Insights Delivered by SAP HANA
What holds true for all the available data is that the fan, or any person who chooses to access it, makes the decision about how to query the database. In other words, fans are in the driver’s seat for how they wish to consume the data. But what if the system could provide answers to questions that fans might not even know they had? That thought led Duke to enhance its SAP HANA-powered statistics platform with #DukeMBBStats Insights, which uses advanced computational algorithms developed and implemented by a team of Duke University faculty members and undergraduate and graduate students to provide post-game insights that provide context to performances.
“Say you’re watching a game and Amile Jefferson has five blocks, and you think to yourself that that’s a lot. With #DukeMBBStats, you can easily see how that stacks up against his season or career bests, or even against the all-time marks,” says Ryan Craig, Executive Director of Digital Strategy for Duke University Athletics. “#DukeMBBStats Insights goes further by automatically providing context of that in-game performance across the history of the program.”
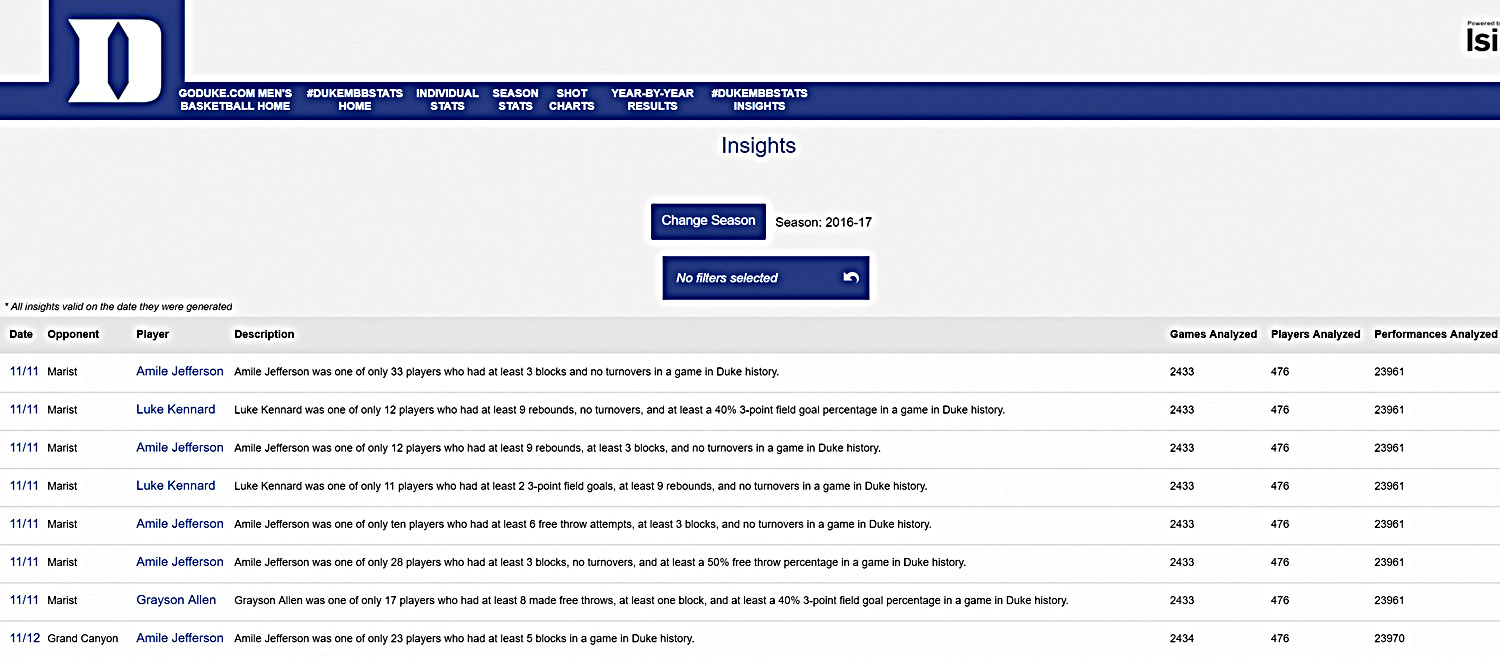
In fact, Jefferson’s five-block night against Grand Canyon on November 12, 2016, was the first insight returned by #DukeMBBStats Insights, retroactive to the 2017 launch: “Amile Jefferson was one of only 23 players who had at least five blocks in a game in Duke history.” Other insights from that game, returned in character strings that can easily be shared via social media in keeping with the platform’s mobile-first philosophy, include the fact that Jefferson was one of only eight players with at least three steals and five blocks in a game in Duke history; it was also only the second time he had at least five blocks in a game. While the algorithm determines the insight, the user can select and narrow which game, player, or combination of players to look at.
The returned insight also reveals how many games, players, and performances were analyzed to generate the information. In the case of Jefferson against Grand Canyon, a majority of the insights related to Jefferson for that specific game were generated from analyzing the 23,970 performances of 476 players in 2,434 games.
“This saves the fan from having to go back over the entire history of Duke Basketball to try to understand how many times something has happened,” says Craig. “Here, the platform not only identifies a superlative for you — it can track when something has happened a minimal number of times — but then it’s doing all the research for you. It’s an amazing wealth of information that is now available to people who otherwise would never have the time to compile the data on their own.”
Jun Yang, Professor of Computer Science at Duke University, spearheaded the creation of the algorithm with a team of students. Originally used in the political realm, the algorithm was integrated into the #DukeMBBStats platform by Nishad Agrawal, an undergraduate student. The in-house effort, according to Craig, embodies the “By Duke, For Duke” approach to community that the university strives for.
“To me, one of the more exciting parts about this project was witnessing the interactions and collaborations between the university’s different departments around the campus,” Craig says.
 The information is intended to be engaging, social, and fun to share. As far as we are aware, this is the first instance of something like this in college athletics and we’re thrilled to have it be part of the #DukeMBBStats platform.
— Ryan Craig, Executive Director of Digital Strategy, Duke University Athletics
Enhancements to an In-Memory Platform
Because the insights are based on game performances, #DukeMBBStats Insights are returned in list form at the conclusion of each game. This, of course, prevents an unofficial halftime statistic from becoming prematurely reported as fact. For the same reason, users are reminded that insights are valid at the time they were generated — meaning that as soon as tip-off of the next game, there is more data to crunch.
There are plans, Craig says, to update #DukeMBBStats Insights to become even more granular, adding filters to return insights beyond contextual analysis of in-game performances to include insights related to, say, frequency of a performance in a certain era. And while current insights are limited to player performances, plans include adding team insights such as providing context for where a comeback ranks in team history, for example.
“The information is intended to be engaging, social, and fun to share,” Craig says. “The insights can be used in game notes, game stories, preview stories, and recaps — anywhere fans go for information about the team. As far as we are aware, this is the first instance of something like this in college athletics, and we are thrilled to have it be part of the #DukeMBBStats platform.”
Future plans also include rolling out a player comparison tool to allow users to compare players of any era — stacking up Luke Kennard against Grant Hill, for example, to see how each player fared in tournaments, or against North Carolina, or in home games. This functionality is currently available on the National Basketball Association (NBA) and National Hockey League (NHL) statistics websites, which are also powered by SAP HANA.
The NBA moving to SAP HANA was partly the inspiration for Duke Athletics to do the same, according to Craig, as was the fact that Duke University has run mission-critical processes on SAP ERP for nearly 20 years. To create #DukeMBBStats on SAP HANA, Duke relied on the expertise of a third-party consultative partner. In addition, Frank Wheeler, Head of Business Development for North America at SAP, was heavily involved with the project. Wheeler was a key figure in the NBA and NHL redesigning their statistics archives on the SAP HANA database.
“This whole project and partnership between Duke, SAP, and our consulting partner started with the realization that an engaging statistical archive was what people wanted,” Craig says. “A player comparison, for instance, is always something that sparks friendly debate and gets people talking. It keeps the conversation going. SAP had just finished with the NBA project, and we looked to that as a first-in-class standard that we could model ourselves after.”