Learn step-by-step instructions for how to use web service connections to connect directly to SAP tables without using a BEx Query connection. Also learn how to use existing dashboard web-service functionality to pull data directly from SAP BW tables, and to read, write, and modify SAP tables via a web service. The benefit of this functionality is that it minimizes the effort, time, and cost required to build SAP BW data flow to acquire the data into dashboards. Using the logic outlined in this article, dashboards can straightforwardly consume data from SAP tables.
Key Concept
SAP BW tables can be connected to SAP BusinessObjects dashboards via web service-based function modules. A customized solution enables a simple function module to perform the logic of reading, writing, and updating the records based on run-time actions carried out in the dashboard. Web service connections can be used to connect SAP BusinessObjects dashboards to SAP BW tables.
My implementation solution enables companies to access data directly from SAP tables in SAP BW. This same web service connection can be used in multiple dashboards, enabling reusability. By using this customized solution, you can make SAP tables a direct part of a dashboard data source, and you can call web service-based function modules to perform different sets of activities (for example, to read, write, and update the data from SAP tables). In addition, the same web service can be used for all the logic used for multiple tables, and multiple dashboards can be connected to multiple tables via a single web service connection.
This step-by-step approach shows how you can connect dashboards directly to SAP BW tables with the following steps:
- Create an SAP table in SAP BW
- Create the function module
- Create the web service
- Bind the web service
- Create a user interface (UI) dashboard and map the connection
- Publish the dashboard
This process is outlined in Figure 1.
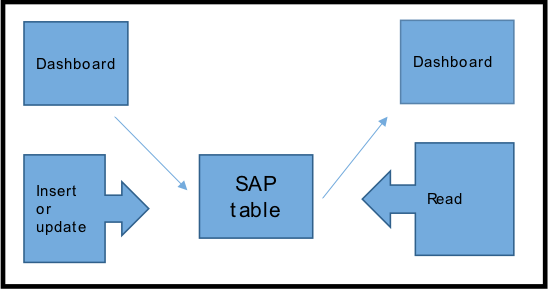
Figure 1
Overview of the process for connecting SAP tables to BusinessObjects dashboards
I cover each of these six steps in detail.
Step 1. Create an SAP Table in SAP BW
Log in to the SAP GUI and execute transaction code SE11. This opens the screen shown in Figure 2. Select the Database table radio button, enter the name of the table (Z0CZ_FILTER, in my example), and click the Create button.
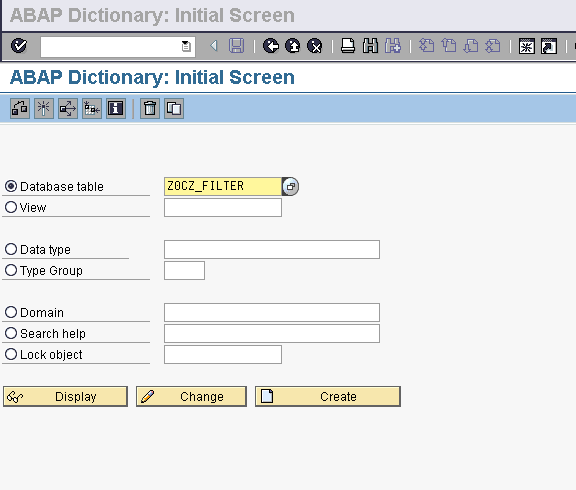
Figure 2
Create a new table using transaction code
In the next screen (Figure 3), open the Delivery and Maintenance tab and enter the description for your table. In this example, the table is for storing the filters selected by the user on the dashboard so I named the description Table for Filters.
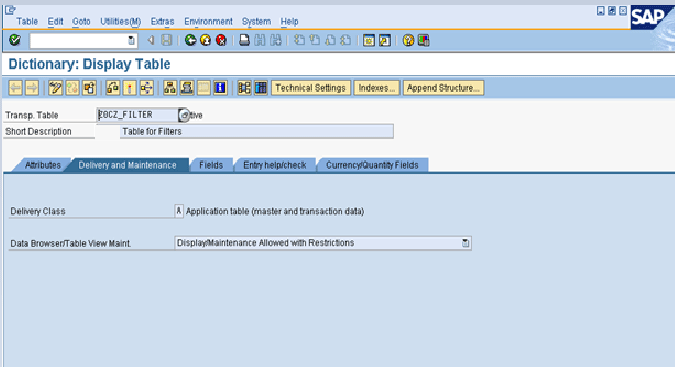
Figure 3
Configure the new table
Select Delivery Class A and Display/Maintenance allowed with Restrictions as the Data Browser/Table View Maint (maintenance). The Delivery Class selection refers to the kind of data that is being used. In this case, selecting A allows both master data and transactional data to be used. The Display/Maintenance allowed with Restrictions option for the Data Browser/Table View Main allows only authorized users to edit the table. Authorizations are given by the security team. Once you’ve made your selections, click the save icon to save your changes.
Next, open the Fields tab where you create SAP table with fields. Select the Key and Initl… checkboxes next to each new key and initialized field you want to add to your table. Enter CHAR in the Data Ty... (type) column and define the length of characters allowed for each new field (up to 255 characters per field).

Figure 4
Select the key fields in the table
Next, click the check icon (highlighted in Figure 4) to check the structure of the table and make sure there are no errors. Once you’ve verified that the table is correct, the system gives you the option to save it. A pop-up window opens (Figure 5); click the Yes button and your new table structure is saved.

Figure 5
Check the table structure and save
The last step in for creating your table is to activate it in the system. Click the activate icon (highlighted in Figure 6) to activate the filter table. When it has been activated, you receive the message shown in Figure 7, indicating the successful creation and activation of the new table.

Figure 6
Activate the table structure

Figure 7
Message that table is created successfully
Step 2. Create a Function Module
The next step is to create a new function module. Execute transaction code SE37, which results in the screen shown in Figure 8. Enter the name of new function module (any name can be given according to your company standards) and click the Create button.

Figure 8
Create and name the new function module
Under the Attributes tab in the screen that opens (Figure 9), select the Normal Function Module and the Start immed. radio buttons. The other fields are auto-populated. Then open the Import tab (Figure 10), where you select all the fields that should be taken from the dashboard and stored in the table.
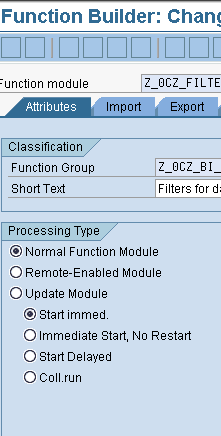
Figure 9
Select the processing type for the function module
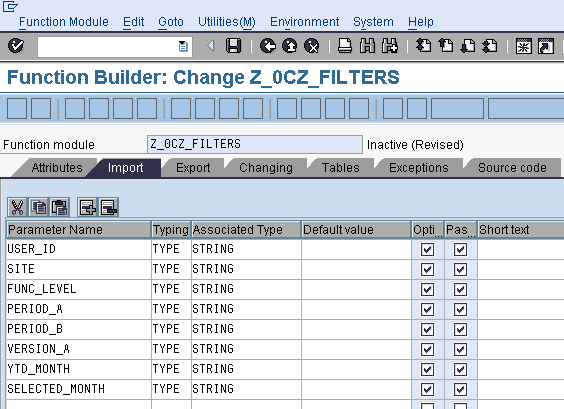
Figure 10
Set up the import parameters
These parameters (the values that are input from the dashboard) typically consist of all the table columns created in step 1(Figure 3). The screenprint in Figure 10 shows the input parameters that act as input variables in the dashboard. There are two check boxes associated with the parameters: Opti… (optional) and Pas… (pass). In this case, select both check boxes so that these fields will be optional and available for navigation.
In the same way that you created the import parameters, now you create the export parameters under the Export tab (Figure 11). This tab refers to the parameters that show the stored values or output values from the function module.
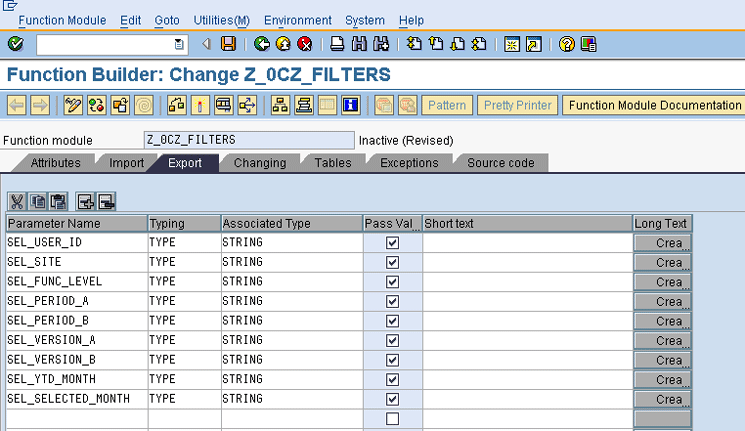
Figure 11
Set up the export parameters
Note
The input values from the dashboard equal the import parameters, and the
output values to the dashboard equal the export parameters.
Figure 12 shows an example of the source code to be written for importing the input variables, the declaration of the output variables that are used in the dashboard, and basic functionalities (like read, insert, and update the data in the table). This code should be written in the Source code tab.
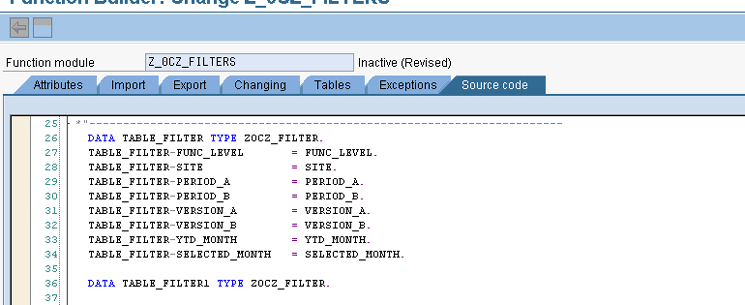
Figure 12
The declaration code
The following case statements can be used to create the following commands:
- Case 1: Read the input parameters to this function module from the SAP table.
- Case 2: Insert and update the input parameters to this function module to the SAP table.
Following are the details of the required steps for each case.
In the first case, you want to store all the user-selected filters on the dashboard. Insert the code for reading those filters, as shown in Figure 13.
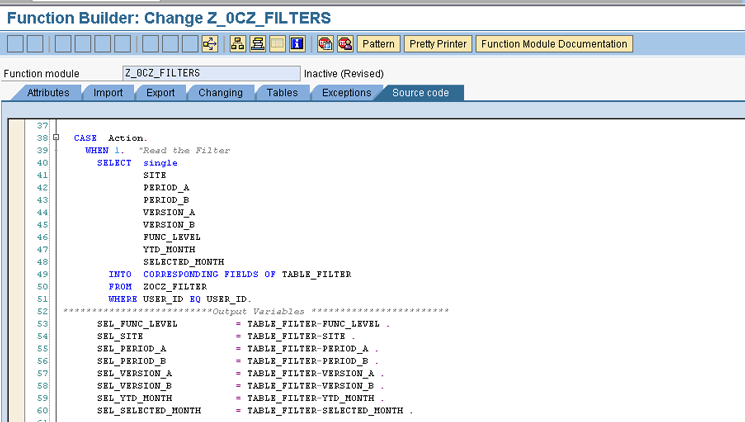
Figure 13
Case 1: insert the code to read the input parameters from the SAP table
In the second case you want to insert a filter for updating the user-selected filters in the dashboard. Use the code shown in Figure 14 (click here for a copy and paste version: Case 2 code).
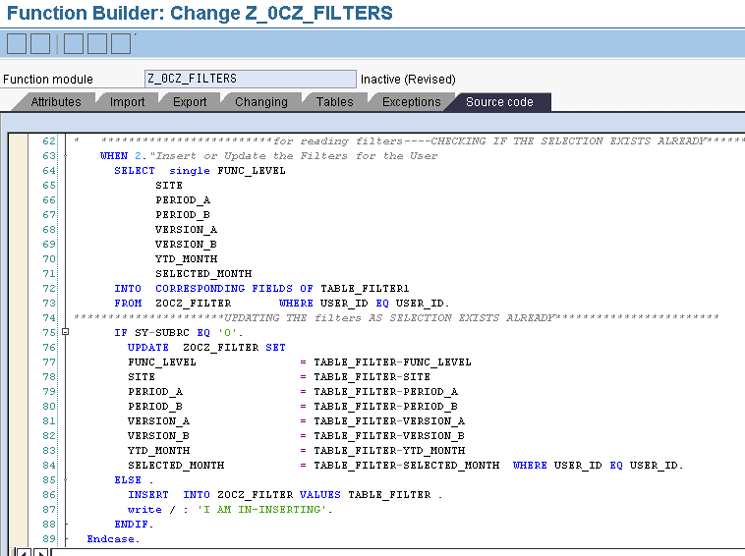
Figure 14
Case 2 code for inserting or updating the input parameters from the table
Click the check icon (not shown) to check the function module for syntax errors. Then click the save icon (highlighted in Figure 15) to save all your changes to the code.
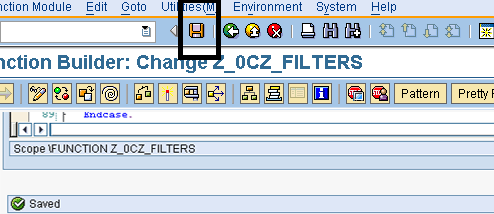
Figure 15
Save the code
The last step for creating the function module is to activate it by clicking the activate icon (Figure 16).
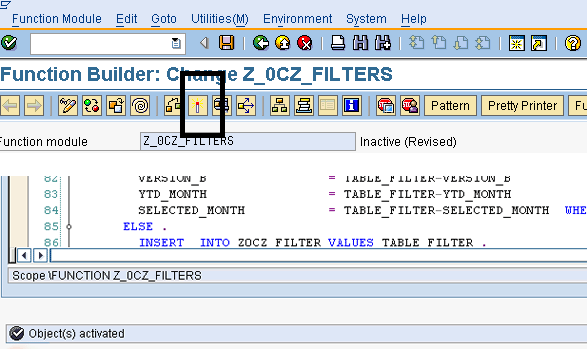
Figure 16
Activate the code
Step 3. Create a Web Service
The following steps show how to create a web service-based function module that you can access through a URL. First, execute transaction code SE37 in SAP BW. Open the function module for which the web service is to be created, and follow menu path Utilities > More Utilities > Create web service > From the Function Module.
This opens the web service wizard (Figure 17) where you enter values in the fields for the Service Definition and Kurzbeschreibung (German for short description). Then click the Continue button.
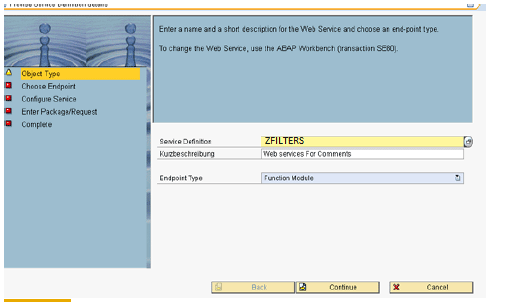
Figure 17
Enter the object type details
On the next screen (Figure 18), type in the name of the function module or use the Search feature to search for the name of function module. Check the box for Mapping der Namen (mapping the names) and click the Continue button, which opens the screen in Figure 19.
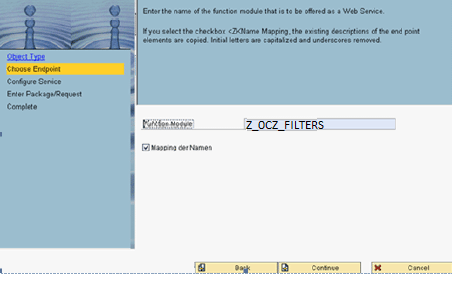
Figure 18
Find the name of the function module to map
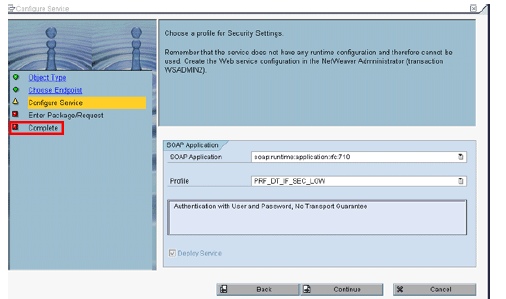
Figure 19
Map the names and create the new function module
Under the SOAP Application tab, select PRF_DT_IF_SEC_LOW from the Profile field drop-down options (Figure 19), and click the Continue button. Then click the Complete option on the left (highlighted in the figure) and the new function module is created.
Step 4. Bind the Web Service
To bind the web service, you use the Service-Oriented Architecture (SOA) Management tool. Execute transaction code SOAMANAGER in SAP BW. The SOA Management screen opens in the web browser (Figure 20). Under the Application and Scenario communication tab, click the Single service administration link; this opens the screen shown in Figure 21.
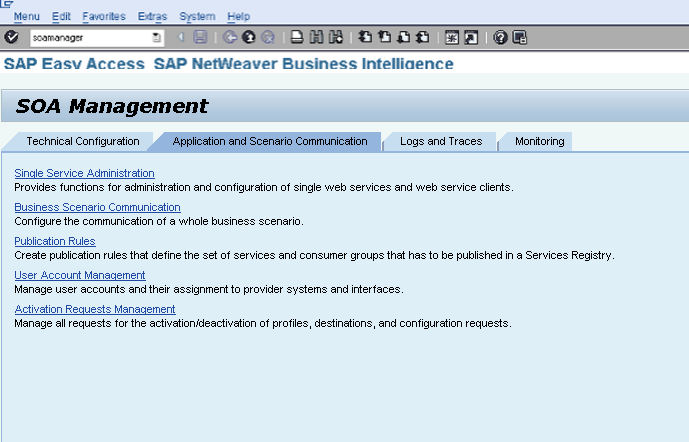
Figure 20
Application Scenario and Communication tab details
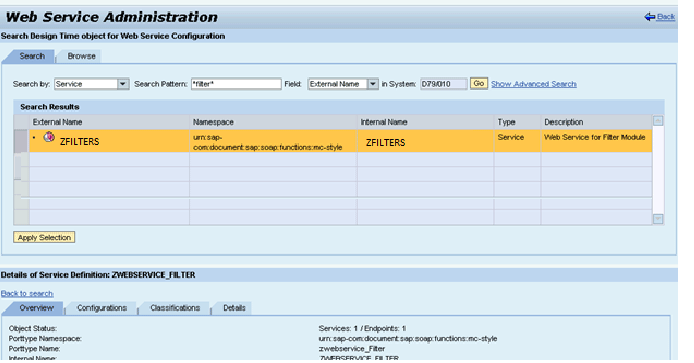
Figure 21
Select the service in Web Service Administration
The screen in Figure 21 shows a list of the available services. Choose a service from the drop-down options in the Search by field and click the Apply Selection button. This opens the dialog window shown in Figure 22, where you enter the parameters for the binding configuration as follows:
Service Name: ZFILTERS
Description: Web Service
New Binding Name: ZFILTERS
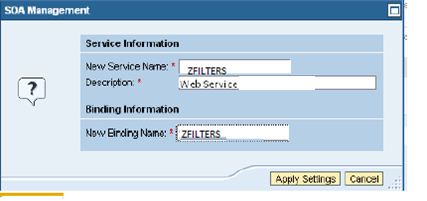
Figure 22
Enter the details for binding
After providing the details, click the Apply Settings button, and the system returns you to the prior screen (Figure 23).
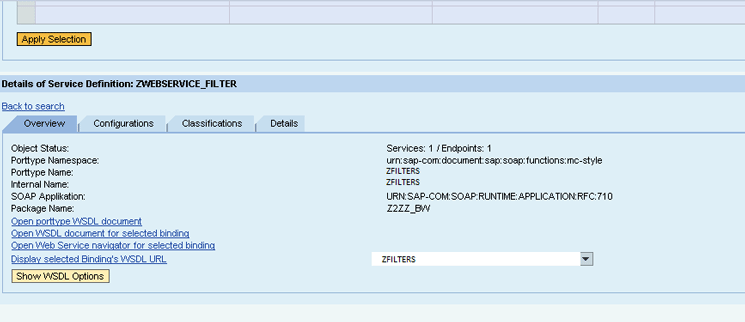
Figure 23
The web service configuration
Under the Overview tab (Figure 23), the web service name (ZFILTERS) is now visible. Click the Open WSDL document for selected binding link, which opens the WSDL document (Figure 24). The WSDL document page provides the WSDL binding link in the address bar. This link needs to be used in the next step (step 5) as input to the SAP BusinessObjects Dashboards web services connection.
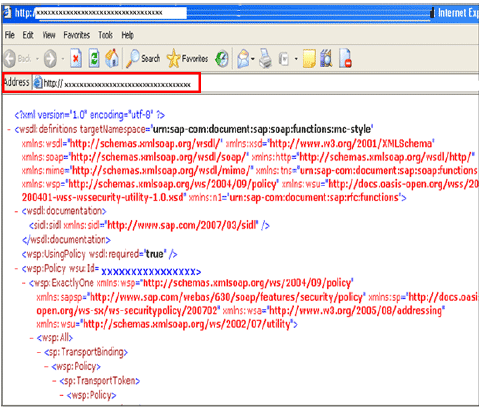
Figure 24
The generated web service URL address
Step 5. Create the UI of Two Dashboards and Map the Connections
As a prerequisite to this step, you need to create a dashboard layout using SAP BusinessObjects Dashboards (formerly Xcelsius), which is a typical activity for dashboard designers. You can create the UI and map its components as shown in Figure 25. In the View menu, open the Components tab and add a Combo Box and a Connection Refresh Button (as shown in Figure 25). (A Combo Box is the input field from the dashboard.) Label the Combo Boxes with the field names for your business requirement (for example, Period A and Period B), and drag a Connection Refresh Button to the screen on the right and rename it Update.
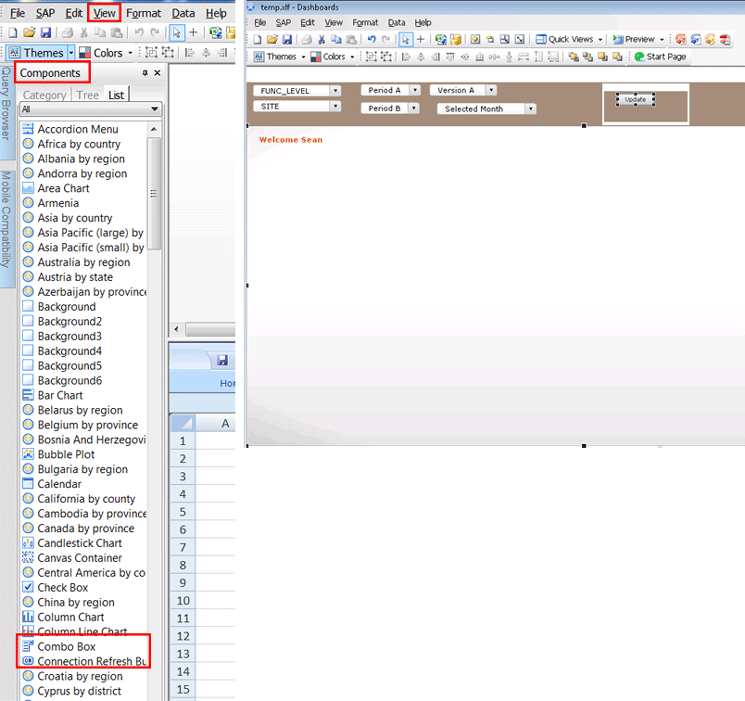
Figure 25
Dashboard layout
In the dashboard designer, every input parameter is sourced through Excel, so the next step is to map the parameters to Excel. Mapping to Excel should be done for each Combo Box, as shown in Figure 26. Each Combo Box is designated to one cell as a destination for selected data. Right-click a Combo Box (in this example, Selected Month) and then select the Properties option from the context menu. This opens the Select a Range dialog window. Select Sheet3$A3 and click the OK button. In the same manner, map the other Combo Boxes to Excel as well. In this way, every Combo Box drops its data into its respective Excel field, which will be further used to map the input field from the web service connection.
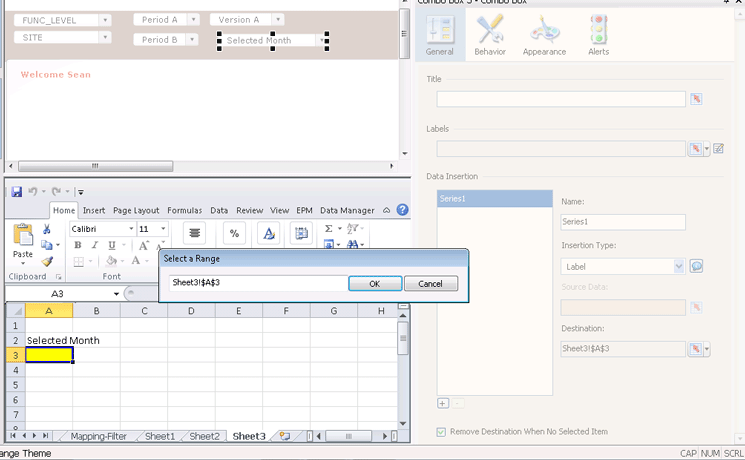
Figure 26
Map to Excel
The next step is to add connections. In the dashboard design screen (Figure 27) create a web service connection and name it Read Filters from table. To create the connection, click the data manager icon in the ribbon of the screen (highlighted in Figure 27). This opens the Data Manager dialog window (Figure 28).
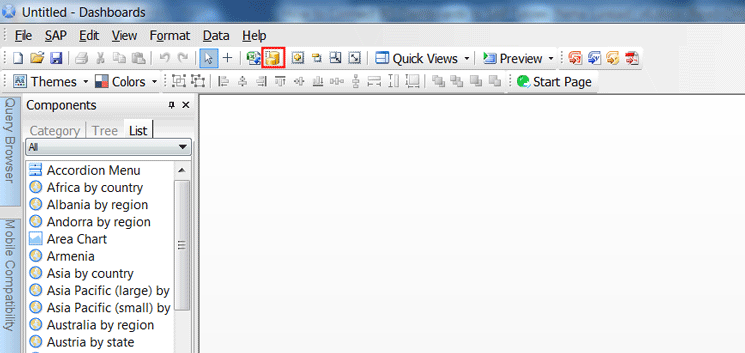
Figure 27
Create a web service connection
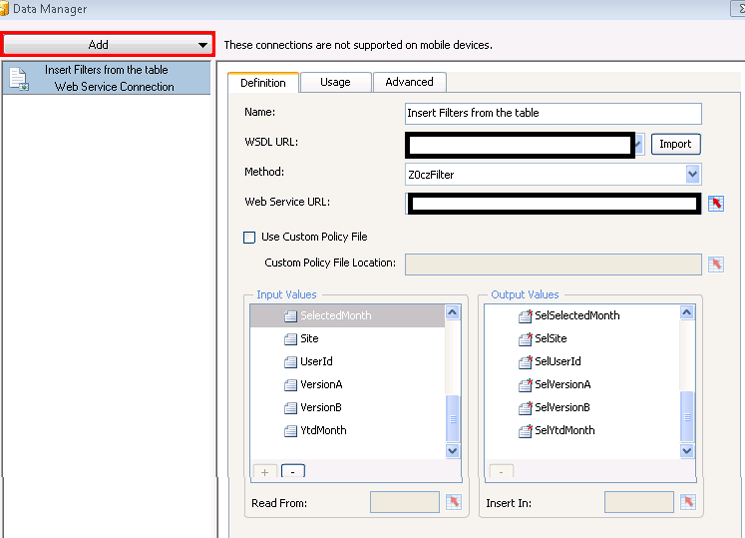
Figure 28
Configure the web service connection in the dashboard
Click the Add button and select Web Service Connection on the left of Figure 28. Then, in the right pane of the screen, open the Definition tab and assign a meaningful name to the web service connection in the Name field (in this example, Insert Filters from the table). Copy and paste the binding URL (from Figure 24) into the WSDL URL field and click the Import button. Once the Import button is clicked, the input and output parameters are automatically populated in the Input Values and Output Values panes as shown at the bottom of the screen.
In the web service connection Definition tab each input parameter and output parameter should be mapped to the corresponding Excel destination for their respective Combo Box. For example, Selected Month should be mapped to the corresponding Combo Box destination Selected Month. In this case, the Selected Month is Sheet3!A3 (Figure 26).
Next, you need to configure the input values (Figure 29). These values become the input parameters of the function module, and you must configure the input parameter Action (the last parameter in the input pane) to pass the appropriate value to the function module Z_FILTERS. In the Input Values pane, hard-code the input Action parameter to 2 at the Sheet3!A!3 location as expected by the function module. The purpose of passing the 2 value in Action is to execute the code in case 2 as coded in the function module. This Action is responsible for executing the code written in Figure 14.
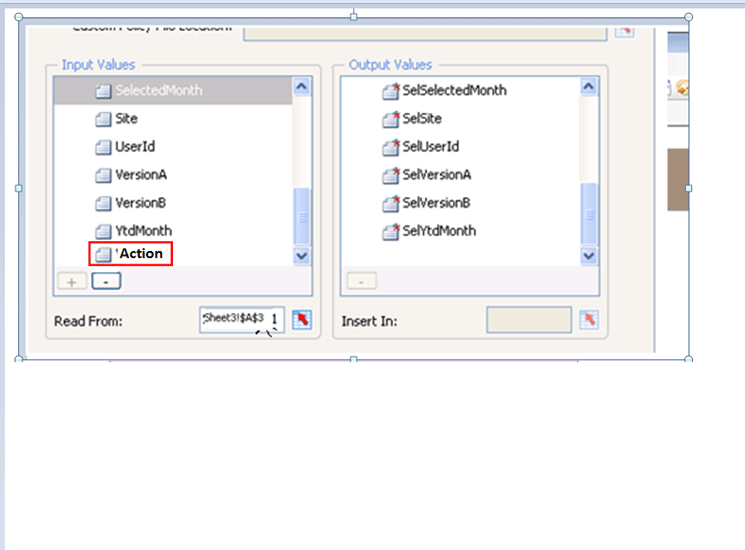
Figure 29
Map the Input Values to their Excel destinations
The next step is to trigger this connection, which is triggered when the user clicks the Update button on the dashboard. To configure this trigger, close the Data Manager window (Figure 28), which returns you to the SAP BusinessObjects Dashboard design screen (Figure 30). Hover over the Update button, right-click, and choose Properties from the context menu. This opens the pane on the right of the screen in Figure 30.
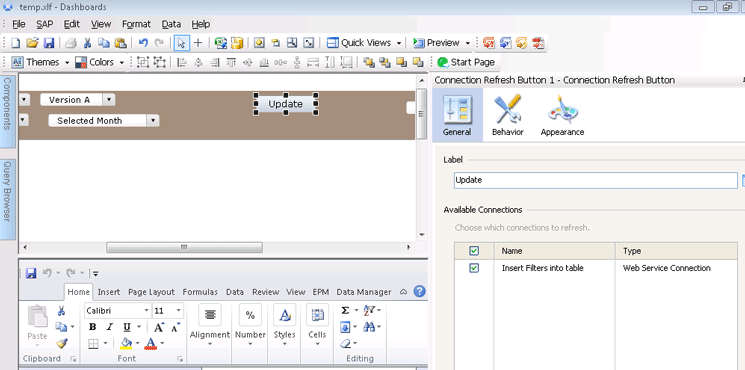
Figure 30
Configure the web service connection in the dashboard
Select the Insert Filters into table checkbox, which triggers the connection for inserting filters in table connections as shown in Figure 30. After the web service connection is defined, it is important to specify how and when to trigger this connection. Under the Usage tab (Figure 31) select the Refresh Before Components Are Loaded check box and click the Close button (not shown). This option triggers the Read Comments connection before the dashboard loads and ensures that filters are already fetched at the time of the dashboard load.
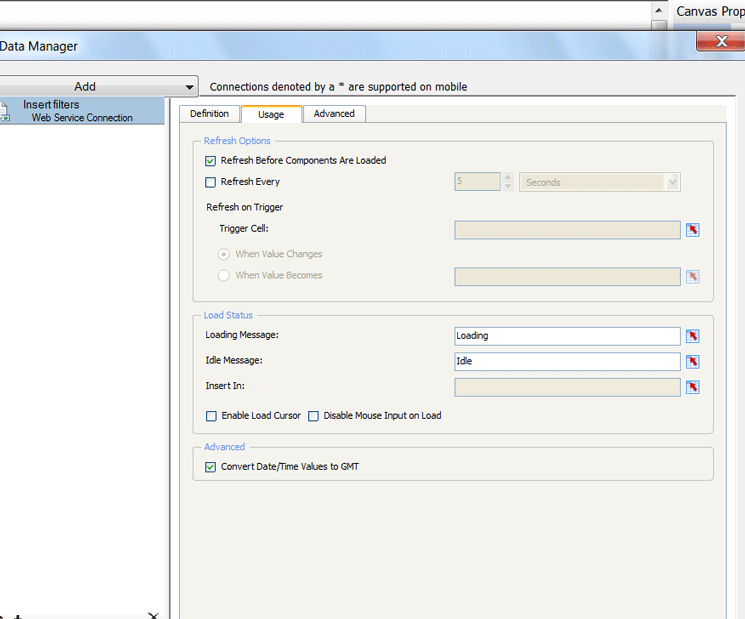
Figure 31
The Usage tab configuration for the web service connection
Step 6. Publish the Dashboard
The final step is to publish and launch the new dashboard. Click SAP in the ribbon in Figure 32 and select Publish from the drop-down options. After the new dashboard is published, click SAP again and select Launch to launch the new dashboard. A new browser screen opens with the new URL entered and the new dashboard appears. The web service connection is executed, as shown in Figure 33, and the stored values appear in Combo Boxes pulled from the SAP table.

Figure 32
Publish and launch the new dashboard
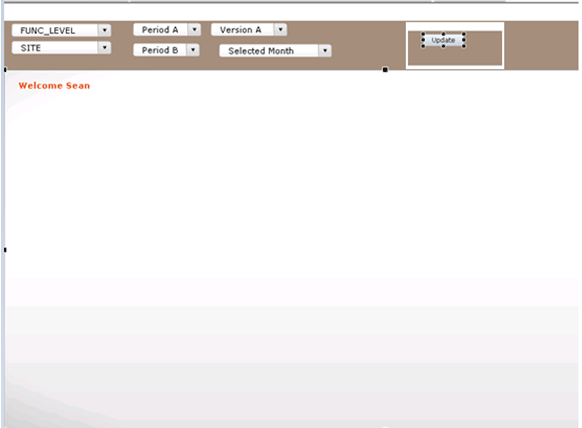
Figure 33
The new web service connection is created to update the SAP table
In the screen in Figure 33, the filters appear with their stored values. Change the filters and click the Update button in the dashboard to execute the new web service in the background, and your selections are stored in the SAP table. The dashboard fetches all the input variables from the Excel worksheet and the insert filter web service launches.
Neha Lunkad Lodha
Neha Lunkad Lodha is the Team Lead for SAP BusinessObjects and SAP NetWeaver BW at Infosys, in New Jersey. She specializes in SAP NetWeaver BW and reporting using SAP BusinessObjects toolsets and BEx Query.
You may contact the author at nehalunkad87@gmail.com.
If you have comments about this article or publication, or would like to submit an article idea, please contact the editor.


