Create an Excel spreadsheet to view and compare payroll result differences after every configuration change to minimize errors.
Key Concept
Parallel testing is one of the most effective ways to test configuration and rules prior to a payroll go-live. Parallel testing is the phase in an SAP implementation in which HR professionals compare the payroll results from the legacy system to what they’ve configured in SAP. It is usually the last phase of an implementation before converting the data to production. In my experience, it is the most effective testing that you can perform to test the accuracy of pay results. There is no substitute for comparing employees’ payroll data and being able to match gross and net pay.
When making a configuration change in your live SAP Payroll system, it’s a good idea to confirm that this modification will not adversely affect your payroll results. You might need to make configuration changes such as updating pay scale groups or levels, adding a new medical plan, or changing an employer contribution on a deferred compensation plan.
A good way to test that your changes don’t affect other areas is regression testing. Regression testing is a quality control measure to validate that a configuration fix does not negatively affect unmodified configuration. You can set up a variant in Wage Type Reporter (transaction PC00_M99_CWTR) and use an automated comparison tool such as Excel to view results and assess the effect of each configuration change on your live system.
You also can apply regression testing to make sure your system goes live without running into headaches. No matter how thoroughly you progress through the phases of an SAP implementation (blueprinting, unit testing, integration testing), it is likely that you will discover errors or new requirements during parallel testing that require configuration or rule changes. Unfortunately, it’s risky to make changes to fix errors discovered during parallel testing. Although you may fix the known error or satisfy the new requirement, you must confirm that the fix does not cause other errors.
You can use the steps that follow to combine Wage Type Reporter and Excel spreadsheets to validate payroll accuracy. Although my example, tested in R/3 Enterprise Release 4.7, outlines parallel testing, you could use this method to examine other payroll configuration changes. After you set up variants in Wage Type Reporter and Excel spreadsheets, you can perform the following tasks in minutes:
- Make a configuration or rule change
- Unit test and transport to a parallel client
- Execute time evaluation or payroll for the employee population for the parallel pay period
- Execute the Wage Type Reporter transaction
- Open the saved variant and execute
- Export results to Excel
- Copy results to Excel spreadsheet
- View results for all employees
Step-by-Step Guide
Step 1. Create a new Excel spreadsheet. Obtain and organize the legacy data that you would like to compare per pay period and paste the data into a Microsoft Excel worksheet called LegacyData.xls. You might want to evaluate the gross (wage type /101) and net (wage type /559) for each employee, or your requirements might be more complex. You can expand the focus of parallel testing by including other wage types (i.e., for union dues or pension plan employee and employer contributions — wage type codes that are specific to your organization).
The legacy payroll data resides somewhere in the legacy system. Any legacy system that you convert from should be able to export pay results to Excel. Figure 1 is an example of legacy data (including legacy personnel number, wage type, and amount) in Excel. Typically, users choose a single payroll period that has recently passed as the parallel period, as this improves the accuracy of the test. Because the goal of the parallel payroll testing is to match results to the legacy payroll system, the worksheet containing legacy data should remain static. Therefore, you compare one payroll period that has already occurred in the legacy system.

Figure 1
Add legacy data to your Excel spreadsheet
Note
This article is designed for testing a single payroll period only. Testing multiple payroll periods and the associated retroactive calculations requires a more complex solution.
Step 2. Create and populate the second tab of the spreadsheet with the legacy and SAP personnel numbers and the legacy and SAP wage types that you are comparing. Label this worksheet Lookup.xls. You must be able to compare the personnel number in your legacy system to the number in your SAP system. There are different ways to do this:
- Assign personnel numbers via an external number assignment
- Execute a report in SAP to get both the SAP and previous personnel number (infotype 0032 [internal data] stores legacy numbers)
- Find a key field that is the same in both systems
Let’s use option 2 and assume that infotype 0032 contains the legacy personnel number. To export this information for all the employees who are included in the test, execute transaction SE16. Enter table PA0032, which stores infotype 0032. Locate the information in fields PERNR (SAP personnel number) and PNALT (previous personnel number). Click on the execute icon.
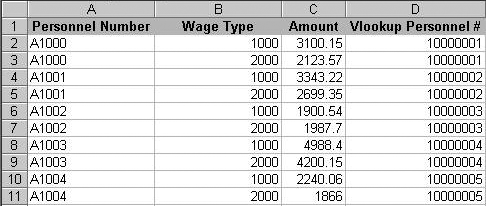
Export this information by following menu path Edit>Spreadsheet. Choose a directory and save the file as an Excel workbook named Legacy_SAP personnel numbers.xls. Click on the generate icon to save. Open the file and manipulate Excel by deleting all the extra rows and columns. The only rows you need are the legacy personnel number and SAP personnel number. Arrange the data so it looks like columns A and B in Figure 2.

Figure 2
Add the legacy wage type for gross and net pay
Next, identify the legacy wage type. It will probably be a different name in the legacy system (i.e., pay code, earnings code, or memo code) but since you are looking only for gross and net pay, it should be easy to find. In Figure 2, the legacy wage type for gross is 1000 and net is 2000 (columns D, E, and F). Add the legacy wage types to your worksheet called Lookup.xls.
Step 3. Build the variant using Wage Type Reporter. Enter transaction PC00_M99_CWTR or use SAP Easy Access Payroll Menu SAP menu>International>Information System>Wage Type>Wage Type Reporter.
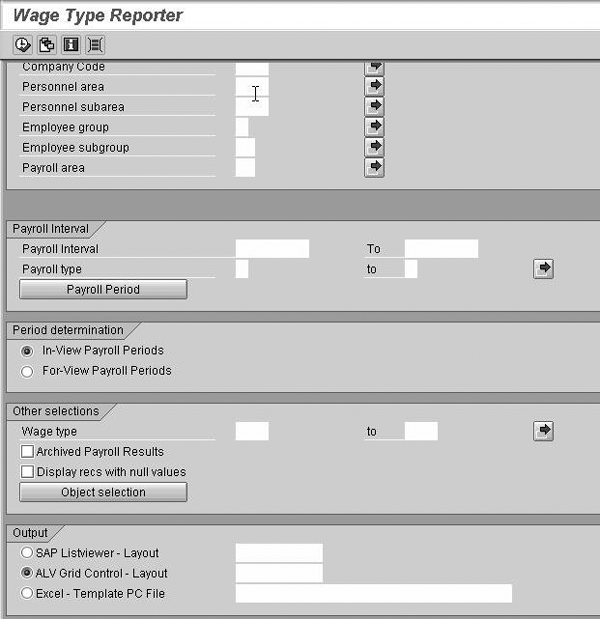
Figure 3 appears once you’ve executed the transaction. Begin entering the criteria that you will need for extracting the correct payroll data for comparison. Click on the Payroll Period button in Figure 3 to open up more selection criteria (Figure 4). Enter the payroll area and payroll period. For example, I selected Payroll Area 99 and Period Selection (payroll period) 1.

Figure 3
Click on the Payroll Period button to enter the criteria

Figure 4
Enter detailed payroll period information
In Wage Type Reporter’s Other selections tab (Figure 5), enter the wage types to compare (i.e., /101 for gross and /559 for net). Click on the save icon to save the relevant information as variants. Assign the variants a name and meaning. Click on the execute icon to execute the report.

Figure 5
Enter the wage types to compare
When data appears in your report, follow the menu path Settings>Layout>Change. Choose these fields: Personnel Number, Wage Type, Wage Type Long Text, and Amount. Give the layout a short and long name and click on the save icon. Once you have saved this layout, you then can use it as the default layout by selecting ALV – Grid Control in the Output section of the screen.
Next, export the file to Excel via menu path List>Export>Local File (choose spreadsheet format). The system prompts you to choose a Directory and File Name. Name the file Payroll_results_v1.xls and click on the generate icon.
After the system saves the file, it returns to the Wage Type Reporter results table. When you open the spreadsheet you just saved, it looks like Figure 6.

Figure 6
Save file Payroll_results_v1.xls
Take the spreadsheet that contains the exported SAP payroll data (Figure 6) and add a third worksheet to the LegacyData.xls spreadsheet created above. Name the worksheet Wage Type Reporter.
In the Wage Type Reporter worksheet (Figure 7), add two columns called Combine Personnel # and WT (Column G) and Amount (Column H). The first column combines the personnel number and wage type that uniquely identify each line. You combine these two fields to act as a key. You need a unique key because for each personnel number, there are two values: total gross and payment (net). In column G, enter the following: =B6 & " " & C6. This formula combines the contents of the two cells.

Figure 7
Add two formulas to the Wage Type Reporter worksheet
Column H, Amount, repeats the amount field from column E. To do this, type the formula: =E6. You need to create this column because columns B through E contain variable test data. The resulting spreadsheet should look like the one in Figure 7.
Step 4. Create a fourth worksheet in the spreadsheet for comparison named Compare. All the information that you need is in this spreadsheet. The spreadsheet contains legacy and SAP data and payroll results. The next step is setting up formulas that compare the payroll results and allow you to reuse the spreadsheet easily.
In the Compare worksheet, copy the three columns from the Legacy Data worksheet: Personnel Number, Wage Type, and Amount. Do this by entering this formula in the top of the worksheet ='Legacy Data'!A1. Place your cursor on the cell and drag it down to copy all the entries from the Legacy Data worksheet. Follow the same process for the Wage Type and Amount fields. The resulting worksheet looks like Figure 8.

Figure 8
Add formulas to the Compare worksheet
Next, create a VLOOKUP function to populate column D with the SAP personnel number and column E with the SAP wage type from the Lookup worksheet. The VLOOKUP function searches for a value in the left column of a table and then returns a matching value in the same row from a column you specify. To learn more about the VLOOKUP formula, see the sidebar “Detailed Explanation of VLOOKUP Formula.”
Type the following formula in column D of the Compare worksheet: =VLOOKUP(A2, 'Lookup'!A:B, 2, FALSE). You should see the values in Figure 8 at this point.
Copy and paste the formula in the rest of the D column. Do this by clicking on the bottom of cell D2 and dragging it down to copy and paste the formula for each cell. You see the screen in Figure 9.

Figure 9
Populate the D column
Next, enter a second VLOOKUP formula on worksheet Compare, column E. This formula is similar to the first one, except the lookup or reference value is the legacy wage type (cell B2) and the table array is the legacy and SAP wage type columns from worksheet Lookup. Enter the second formula in the first row of column E: =VLOOKUP(B2,'Lookup'! D:E, 2, FALSE). Again, copy and paste the formula down to the other cells. Columns A through E should look like Figure 10.

Figure 10
Populate the E and F columns
In column F, combine the personnel number and wage type to form the unique key to match the legacy amount to the SAP amount (created in the Wage Type Reporter worksheet). Use the same formula as described earlier to combine the cells: D2 &" "& E2. Copy and paste this down to the other cells, as shown in Figure 10.
In column G, repeat the legacy amount in column C to compare it with the next field, the SAP amount. Field G2 should read =C2. Copy and paste this down to other cells.
In column H, bring in the payroll data that Wage Type Reporter generated. Enter this VLOOKUP formula to populate the SAP Amount column: =VLOOKUP(F2, 'Wage Type Reporter'!G:H, 2, FALSE). The formula uses the personnel number and wage type combination as the lookup value (column H from Compare), the table array is columns G and H (from the Wage Type Reporter worksheet), the Col_index_num is 2, and the Range_lookup field is FALSE.
The legacy amount and the SAP amount are now side by side in columns G and H on the worksheet (Figure 11).

Figure 11
The final version of your worksheet
Next, add a subtraction formula in column I to show the difference between the legacy and SAP amount. Name column I Difference, enter =G2-H2, and drag the formula down to all entries (Figure 11).
Column I displays the difference between the legacy and SAP systems. At the bottom of columns H and I, it’s a good idea to summarize the results as seen at the bottom of Figure 11. In column H after the pay results, enter three new rows called Total 0's, Total results, and % matching. In column I next to the Total 0’s column, add a COUNTIF formula to count the number of 0’s within a specified range in column I. Enter this formula: =COUNTIF(I2:I11, 0) . The next row, Total results, sums all the pay results. Add this formula to cell I14: =COUNT(I2:I11). The % matching row shows the correct amount pay results from the legacy to SAP system (cell I13) divided by the total amount. The formula for this is =I13/I14 *100. This way, it’s easy to get a summarized view of how accurate the parallel test is performing.
Optimize This Technique
The work for building the Compare spreadsheet is now complete. Future comparisons between legacy and SAP payroll data are easy to make:
- Make the configuration change and transport it to your parallel system
- Execute time and payroll for the test period
- Execute Wage Type Reporter and export the results to Excel. To keep track of your spreadsheets, give each spreadsheet a different version name, e.g., Payroll_results_ v2.xls.
- Open the Excel spreadsheet (Figure 6) and copy and paste columns A to E into the spreadsheet’s worksheet labeled Wage Type Reporter
- Excel dynamically updates all the formulas in the spreadsheet
- View the Compare worksheet to see if your change has affected the payroll results
If you need to focus on an area of pay results in more detail, you can add additional wage types to compare data such as union dues or pension plan employee and employer contribution. You would do this using the same process as comparing gross and net payroll results.
Detailed Explanation of VLOOKUP Formula
Here are the key elements of the VLOOKUP formula:
•VLOOKUP: the formula that searches for a value in the left column of a table and then returns a value in the same row from a column you specify in the table
•A2 (Lookup_value): the lookup or reference value. In this case, I use the legacy personnel number in cell A2 as the reference value.
•Lookup!A:B (Table_array): the table from which the data is retrieved located on the Lookup worksheet columns A and B.
•2 (Col_index_num): the column that Excel returns after finding the matching value . In this example, if Excel finds a matching value in column A, then it returns the value in column B, since B is the second column in the table array.
•FALSE (Range_lookup): the value that Excel returns if a value does not match. For example, if there were a value on the
Compare worksheet that was not in the Lookup worksheet, Excel would return FALSE.
Brian Harty
Brian Harty has more than six years of experience in the IT industry, with a primary focus in SAP HR implementations. His main areas of interest are Benefits and Payroll. He is currently a senior consultant with BearingPoint.
You may contact the author at bharty24@yahoo.com.
If you have comments about this article or publication, or would like to submit an article idea, please contact the editor.


