SAP/Solution Manager
Learn about SAP Solution Manager 4.0’s reporting options and how to use them to ensure consistent performance across your system landscape.
Key Concept
SAP Solution Manager 4.0 includes a wide range of reporting options for generating technical and administrative information about your system landscape, including SAP EarlyWatch Alert Reporting, Service Reporting, EarlyWatch Alert Reporting in SAP NetWeaver Business Intelligence, Service Level Reporting, and System Availability Reporting.
When it comes to IT systems, there has been a clear divide between system implementation and support. The consultant puts in the system, closes his or her laptop, and leaves. Support takes over.
In an ideal world, there is a clear transition from implementation to support. And when an upgrade is planned, the new implementation team can draw on the knowledge of support to determine the exact status of the current system.
For SAP customers, the bridge between those two worlds is SAP Solution Manager. Over the past decade, SAP Solution Manager has become the platform for all documentation and knowledge about your SAP solutions and all integrations between those solutions and other SAP or third-party solutions.
The rising importance of SAP Solution Manager as a tool to maintain, support, configure, and upgrade SAP landscapes has also meant a requisite increase in reporting capabilities of the platform, and with the release of SAP Solution Manager 4.0 comes a wide range of increased reporting options. You can use these reporting options to generate technical and administrative information about your system landscape so you can be proactive in addressing issues before they become critical.
Note
The audience for this article includes system administrators, in particular those running SAP NetWeaver. This article assumes you have knowledge and experience in the implementation of SAP Solution Manager. It is helpful to have an understanding of SAP NetWeaver Business Intelligence (SAP NetWeaver BI).
Note
We adapted much of our article from SAP Solution Manager (SAP PRESS, February 2007) by Matthias Melich and Marc O. Schäefer.
To help all system administrators be proactive in monitoring their system landscape, this article reviews the new reporting capabilities of SAP Solution Manager, specifically:
- SAP EarlyWatch Alert Reporting: SAP Solution Manager enables automated system monitoring and reporting using key performance indicators (KPIs).
- Service Reporting: The Service Reporting functionality enables you to retrieve data out of service sessions, such as SAP EWAs from more than one system. You can summarize all relevant solution, system, and product data in a report. It also allows IT administrators to compare data from sessions that were not previously accessible (e.g., implemented notes or system parameter settings). The download to Microsoft Excel feature allows fast integration in self-defined Service Level Reports.
- EarlyWatch Alert Reporting in SAP NetWeaver Business Intelligence: You can analyze SAP EWA Reporting using SAP NetWeaver BI reporting.
- Service Level Reporting: For system administrators to control the effectiveness of IT and IT systems and for management to prove the fulfillment of their service level agreements (SLAs) that define the level of availability and software performance required. Service Level Reporting (SLR) documents performance against those service levels over a set period of time. SLR is based on Central Performance History (CPH) and on SAP EWA with its KPIs. KPIs also include a large number of technically relevant indicators that provide useful information on the stability of and changes to the software and hardware. Examples of KPIs include system availability expressed as a percentage, database and transaction response times, CPU load, and database growth.
- System Availability Reporting: Although limited in flexibility and functionality, this is an alternative to the automated availability reporting in SLR.
Before we begin, let’s take a quick look at the two tabs in SAP Solution Manager 4.0 that provide access to these reporting capabilities. The Solution Reporting tab, shown in
Figure 1, provides access to the following reporting functionalities: Services Reporting, Administration Reporting, Change Management Reporting, Service Desk Reporting, Issues and Top Issues Reporting, and BI Data Collection Reporting. Reporting for SAP EWAs and service levels are on the Solution Monitoring tab.

Figure 1
The Solution Reporting tab provides access to new reporting capabilities
SAP EarlyWatch Alert Reporting
SAP EWA is a preconfigured, automated service that collects the most important technical data on your SAP system and sends it to your SAP Solution Manager or SAP for a check of the status of critical systems. SAP EWA monitors SAP systems by conducting a series of predefined “checks.” These checks are collected into check tables that serve as the basis of SAP EWA reports. Later in this article we will show how to view these check tables.
Note
SAP only processes the service data from test and production systems. You can use SAP Solution Manager to generate SAP EWAs for development and training systems.
As shown in
Figure 2, an SAP EWA report summarizes technical and administrative data for a particular week and interprets this data by providing at-a-glance information on the system’s current status. These assessments, called ratings or alerts, are presented as an easy-to-read, graphic analysis in SAP EWA reports and are used for KPIs and overall reporting functions. The rating for the overall report depends on how you assess the individual KPIs. If the KPIs are of secondary importance, for example, the report can have a green rating despite the fact that a yellow rating is displayed for the individual KPIs.

Figure 2
EWA reports summarize technical and administrative data for a particular week
The following ratings are used:
- Red alert: Critical problems were discovered that could jeopardize system operation.
- Yellow alert: Problems were discovered that require attention but have not yet reached system-critical status.
- Green alert: No problems were discovered.
- Gray alert: No data could be acquired from the monitored system for technical reasons. Thus, no rating could be assigned.
SAP EWA data is aggregated once a week, and once it is aggregated you can generate a report. The ratings for the SAP EWA reports are the same as those above, but with one additional rating: red flag. A red flag indicates that SAP EWA session data is overdue and the necessary download has not yet been sent to SAP Solution Manager.
SAP EWA reports can help you detect trends and bottlenecks that develop over long periods. They allow you to address degrading situations before serious problems can occur. This characteristic fundamentally differentiates SAP EWAs from the real-time-based system and business process monitoring functions, which aim to detect a problem immediately and notify the person in charge as quickly as possible. With SAP Solution Manager 4.0, it’s possible to address the reports to different recipients automatically depending on the rating of the report.
SAP EWA offers the following functions.
- Collects technical data and generates reports on the administrative system area for (internal) reporting
- Facilitates proactive system monitoring
- Lays the foundation for more specific (external) service level reporting (covered later in this article)
- Establishes the data basis for efficient service delivery through SAP Active Global Support
Note
To ensure fast and consistent system analysis and the resulting recommendations from SAP, SAP EWAs apply the same criteria to all SAP customers. As a result, customers cannot change the content and EWA ratings.
SLR, which allows customers to generate reports based on their own requirements, was developed to work around or change such discrepancies.
The SAP EWAs are based on a system of KPIs. KPIs not only provide information on system performance, but predominantly comprise technical indicators that point to defined situations or changes in system status.
You can now automate the collection and distribution of SAP EWA service data by setting the automatic session manager (ASM) for transaction SDCC or the task processor for transaction SDCCN (new version) in the SAP Solution Manager and satellite systems. This periodic background job should be performed when system load is low – for example, from Sunday night to Monday morning.
After the system downloads the data, SAP Solution Manager starts to process it. You can view the result, or SAP EWA report, as an HTML document (
Figure 3). Alternatively, you can create a Microsoft Word document. You can also automate HTML reports and send them according to their rating to the appropriate administrator, for example. A report with a red rating is automatically sent to SAP Active Global Support. A service employee then checks the report and contacts you directly if a serious problem arises. If the ratings remain in the yellow and green areas, the system sends a report only once to SAP after initial SAP EWA activation and then every four weeks via SAP Service Marketplace. See the sidebar “Viewing SAP EWA check tables” for information on viewing SAP EWA check tables.

Figure 3
An example of an SAP EWA report
Service Reporting
SAP Services form the general basis for service reporting. You can include information about the product, database, and installed components in your reporting from system landscape maintenance (transaction SMSY) and from SAP EWAs. You also have the option of adding system attributes to your reporting that are already predefined (a Support Package stack, for example) or that you individually define in transaction SMSY, such as the location or contact for a system. A detailed input help assists you in integrating these parameters.
You can activate the preselected default values, or you can insert or add any other check from the SAP EWS service. The system displays the results in a tree or list view, and you can export the data into Microsoft Excel. Once you have configured a report, you can save a variant so that you can regenerate the report at any time or run it in the batch.
Service Reporting (
Figure 1) enables you to report on more than one system. It contains data not found in the SAP EWA report but in the session, which you can open in display mode after the report has expired. The focus of analysis is on meeting spec-ial requirements with respect to system settings and system or profile parameters, as well as key server, database, and application figures. One such report initially available in SAP Solution Manager 3.2 was frequently used by individual customers for an overview of the system landscape KPIs.
As shown in the initial Service Reporting screen (
Figure 4), the SAP EWA service is already preconfigured (as shown in the Service Selection pop-up screen). You can choose to generate an analysis of all systems in your system landscape or a specific system (by selecting the System radio button and then clicking on the arrow to display the System pop-up screen).

Figure 4
Initial Service Reporting screen
Viewing SAP EWA check tables
SAP EWA reports are based on individual SAP EWA checks of the SAP EWA service session and are saved in check tables. You can access these tables, see what they are based on, and view any associated documentation.
To access the SAP EWA check tables:
1. Log on to Solution Manager (transaction SOLUTION_MANAGER).
2. Navigate to the appropriate solution landscape (e.g., in
Figure 1, the solution landscape is named Henrik01).

3. Navigate to Operations>Solution Monitoring>EarlyWatch Alert.
4. Click on the Display icon to view the source data of the EWA reports.
5. There will be a pop-up screen. Confirm the pop-up screen by clicking on the green check mark .
6. View the SAP EWA check tables. You can review the implemented notes and profile parameters of the SAP EWA checks and subchecks tables.
When defining the analysis period, you can select the current week, last week, or any time; however, the system considers only the current service for the respective period. The check boxes for the basic data (transaction SMSY) and the service data are then set. You can deactivate them if you do not require this data. The default parameter set contains a preselection of relevant SAP EWA standard checks. If you want to modify that selection, click on the Maintain Selection Parameter button at the bottom of the screen. To add parameters, click on the Add System Attributes arrow to display the Attribute Keys pop-up screen (
Figure 5).

Figure 5
Specifying selection parameters and system attributes
Any information from the tables of the individual SAP Services can be included in reporting within the service data. The SAP EWA service encompasses a standard variant with a number of completed checks that you can activate for reporting (
Figure 6). You can activate a specific check by selecting the appropriate check box in the Active column.

Figure 6
Service Reporting results show, for example, the comparison of R/3 profile parameters
Once you have configured all of the settings, you can save this configuration as a selection variant. It then will be available as a selection parameter variant on the initial Service Reporting screen as a help input option. This is important, as you can save variants to the initial Service Reporting screen for scheduling and starting jobs. Therefore, Service Reporting includes not only standard report variants, but also selection variants for use in controlling output.
EarlyWatch Alert Reporting with SAP NetWeaver BI
The main advantage of SAP NetWeaver BI integration in SAP Solution Manager is that you can access important key metrics from operative systems in a form suitable for detailed analysis. Of special interest here are analyses conducted over an extended period of time. SAP NetWeaver BI is also more flexible for summarizing and preparing such data.
The data collector for SAP NetWeaver BI report-ing, for example, was developed to provide data from SAP EWA and system landscape maintenance (transaction SMSY) for SAP NetWeaver BI extraction (
Figure 7). The data collector runs in the background to monitor KPIs, such as database growth and the average response times of the most important transactions, and record SAP Notes and system or profile parameter settings. As you will see in the next section, you can use this information to create reports on service levels.

Figure 7
Automated SAP EWA data collection and standard mask for SAP NetWeaver BI data selection and transfer
The data collection report is structured like other reporting tools. You can schedule it to be included in a batch job using a variant. It is important that you consider only the last successfully completed SAP EWA service with respect to the period selected for the systems. This is how Service Reporting works. It is recommended that you select the period such that reporting is scheduled a week after the SAP EWA service has been successfully processed. In the settings of the SAP NetWeaver BI data collection tool, you can delete data in the transfer table and display documentation on the success of the extraction by setting the respective indicators (
Figure 8). Both indicators are switched off in the standard configuration.

Figure 8
Indicators for deleting transfer table data and displaying transfer documentation deselected by default
At the beginning, it makes sense to set the indicator for the documentation using the content of the transfer table to document extraction into the transfer table as well as into the log, if the report is scheduled to be included in a batch job.
Upon successful completion, you should also set the indicator for deleting the data in the transfer tables to reduce the data quantity. If you do not delete this data, the transfer tables grow much faster than they need to and the data already included in SAP NetWeaver BI is transferred again. As no aggregation occurs for any of the characteristics and key figures (only the last value is added), the value first transferred is retained for future transfer. If, however, an SAP EWA is performed another time using different download data (typical for post processing), this data enters the SAP NetWeaver BI system. Therefore, it is better not to set the flag for deleting transfer table contents at the beginning.
The content or parameters for data collection are defined. All check boxes in the Active column are set. You do not need to complete parameters or settings that are not relevant to you.
The tab pages provide access to the following topic areas:
- System Data: Product, database, components, and system attributes
- System Data Details: System users, ABAP dumps, system availability, update errors, update error details, and hardware configuration
- Server Data: Server list, CPU, memory utilization, paging, R/3 profile parameters, and operating system parameters
- Performance Data: Logged on users by activity, selected ST03N statistics
- Module Data: CPU, database, and application module load
- Database Data: Missing index, database size, available memory, and additional information (as a function of the database)
- Additional Service Data: Ready-to-enter maintenance list analogous to service reporting
All areas are preconfigured with the exception of additional service data. All you can change here is the data you do not want to extract. We recommend that you deactivate all parameters for which your solution provides no data for database extraction. For example, in a 100% Microsoft SQL Server environment, no Oracle parameters would be found and vice versa. Seven databases are supported (Microsoft SQL Server, Oracle, Adabas, DB2, DB390, DB400, and Informix).
In the bottom check box on the initial Content and Parameters screen, you can display an additional tab page (Additional Service Data) for parameter set maintenance. Here, you can include individual checks as in Service Reporting, whereby data is imported into a transparent transfer table. To allow for an analysis in SAP NetWeaver BI, you need to create the respective InfoObjects (characteristics and key figures), transfer rules, update rules, and the respective InfoCube. In the process, it is of primary importance that the sequence of entered checks cannot be subsequently changed. The fields for the transparent table used for extraction into SAP NetWeaver BI are generic.
The fact that SAP Solution Manager 4.0 is based on SAP NetWeaver means that it can also be used as an SAP NetWeaver BI system, but you must appropriately configure it first. The SAP Solution Manager Implementation Guide (IMG) summarizes all necessary steps. You can access the relevant IMG activities from transaction SPRO and the SAP Reference IMG by navigating to SAP Solution Manager > Scenario-Specific Settings > Administration > BI Reporting. Every individual step up to the point of activation is described in detail there. To use this function, however, you must activate all objects in namespace 0SM.
Figure 9 shows what the InfoProviders in the modeling workbench must look like. There is a DataStore Object (DSO) for every InfoCube. By expanding the subtree below the respective objects, you can access the update and transfer rules as well as InfoSources and DataSources marked active. When activation is faulty, there are no icons with which to expand the subtree or the icons are grayed out. In this case, you have to repeat the steps for activating the content or reconfigure the respective steps in the IMG.

Figure 9
Overview of SAP Solution Manager InfoProviders in SAP NetWeaver BI
After configuration, you can use the processes described for loading by referring to the numerous predefined process chains available in transaction RSPC (context SAP Solution Manager). Each Info-Cube has two process chains: one for the initial loading process and one for all subsequent loading processes. You can use the following collective process chains to avoid having to start each process chain individually:
SAP_SOLUTION_MANAGER_INIT
SAP_SOLUTION_MANAGER_DELTA
Collective Process Chains
The SAP_SOLUTION_MANAGER_DELTA collective process chain is highlighted in
Figure 10 and displayed in network form on the right side of the program window. Both collective process chains include the individual process chains for each InfoCube. You monitor these process chains using the logging function or transaction RSPCM. The system displays errors in color. You can perform additional analyses by double-clicking on the batch monitor or the SAP NetWeaver BI analysis monitor. Usually, no errors are detected. If an insufficient number of batch processes is configured or not enough of them are available, however, the process chains do not run through to completion. We recommend that you configure a total of four batch processes.

Figure 10
BI process chains for loading processes
After the process chains have been successfully run through and data has been updated to InfoCubes, you can carry out analyses using queries and workbooks. If you have assigned users the SAP_BW_SOLUTION_MANAGER role, they can call up the workbooks delivered and defined for the InfoCubes directly from the SAP Easy Access menu. It is also possible to define custom queries and workbooks using transaction RRMX. These are the processes used to input the SAP EWA data into SAP NetWeaver BI.
Figure 11 displays a query for analyzing two key database figures: database growth and the size of the database, with monthly growth mapped in the last column. The advantages of the SAP NetWeaver BI link for selected SAP EWA data now become quite apparent. Here, IT service management can see and question irregularities immediately and make plans to expand the database if necessary.

Figure 11
Predefined query for analyzing database size and growth
You can convert SAP EWAs into dashboard reports.
Figure 12 shows a dashboard template that calculates a system score depending on the number of ABAP dumps, the number of update errors, and response times. This dashboard is for one system and one week. You can save dashboards as HTML pages in a portal for customer access. Dashboards make system data more transparent and aggregated to high-level system information, which is particularly useful if you want to compare very quick systems and time intervals.

Figure 12
SAP EWA report displayed as dashboard
Next we are going to take a detailed look at SLR, with a focus on service level availability reporting. You will learn what you can report on, common monitoring scenarios, and how to configure for the reporting capability to take full advantage of it.
Service Level Reporting
SLR within SAP Solution Manager enables comprehensive service level management and reporting to administrators and customers. With SLR, you can summarize several SAP EWAs into one report, combined with self-defined indicators measured in the CCMS, target values, and ratings (
Figure 13). Such a report helps to support strategic decisions and provides direction for optimizations and follow-up tasks.

Figure 13
Data collection options available in Service Level Reporting
With the advent of SAP Solution Manager 4.0, SLR now includes maintenance of thresholds for individual KPIs, monthly KPI reporting (including a 12-month history for KPIs in table and chart format), and integration of CPH.
As SLR uses the same ratings as SAP EWA data, there are a number of similarities. With SLR, you can:
- Aggregate raw SAP EWA data to meet your specific needs
- Combine reports for several systems into one
- Create reports for different audiences, by excluding or including data appropriate to that audience
- Track processing of yellow and red alerts
- Automate report generation and distribution
- Collect additional data and integrate ancillary data sources into service level reports
Integrating preconfigured SAP NetWeaver BI content and dashboards for throughput and backlog indicators (TBI) in SLR is planned for the end of the second quarter of 2007 as well. For more information, refer to
www.service.sap.com/bpm > Media Library > Customer Information.
By creating a separate business process in the SLR setup session and entering your ten most critical transactions, you can create a service level report that lists indicators, such as response times and update errors, for each of the critical transactions. The system also automatically generates this data on a weekly basis (
Figure 14).

Figure 14
Setting up a service level session
SLR has been expanded to include a detailed technical system availability measurement relying on CPH that goes far beyond the standard availability measurement associated with SAP EWAs. SAP EWA system availability was very rudimentary and only suitable for providing a simple availability overview. You can integrate four additional options for automatically monitoring and analyzing system availability into service level reports:
- Instance availability (availability of SAP Basis for every ABAP instance)
- Instance logon availability (logon availability of every ABAP instance)
- Logon group availability (availability of every SAP logon group)
- System availability (ABAP and Java stack) measured as a function of central instance availability (ABAP and Java Message Server)
SAP Solution Manager allows you to determine monthly values for the following KPIs and display target values as defined by you:
- System performance
- Maximum active users
- Average availability
- Average response time in dialog task
- Average response time at peak dialog hour
- Query performance
- Average total runtime of the BW queries
- Average database runtime of the BW queries
- Database performance
- Average database request time in dialog task
- Average database request time in update task
- Database space management
- Database size
- Database growth
- Hardware capacity
- Maximum CPU utilization on database server
- Maximum CPU utilization on application server
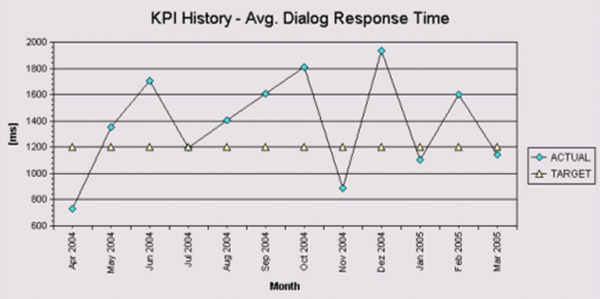
As with EWA, the system assigns ratings based on stoplight colors. To see if your SLAs have been met, you can compare self-maintained target values with the measured values. When the self-defined targets are attained, the target rating is green; the targets not attained have a red rating. History values are displayed in graph or table form (
Figure 15).
History for KPI "Avg. Response Time in Dialog Task"
| Apr 2004 |
734 ms |
1200 ms |
 |
| May 2004 |
1355 ms |
1200 ms |
 |
| Jun 2004 |
1703 ms |
1200 ms |
 |
| Jul 2004 |
1198 ms |
1200 ms |
 |
| Aug 2004 |
1403 ms |
1200 ms |
 |
| Sep 2004 |
1609 ms |
1200 ms |
 |
| Oct 2004 |
1811 ms |
1200 ms |
 |
| Nov 2004 |
888 ms |
1200 ms |
 |
| Dec 2004 |
1933 ms |
1200 ms |
 |
| Jan 2005 |
1102 ms |
1200 ms |
 |
| Feb 2005 |
1603 ms |
1200 ms |
 |
| Mar 2005 |
1140 ms |
1200 ms |
 |
 |
| Figure 15 |
KPI history with target values |

Figure 15
KPI history with target values
One of the most critical service-level criteria is that of availability. With SLR, you can have information that will help you ensure the highest levels of availability over your system landscape.
Service Level Reporting: Availability
One of the most common measurements for service levels is availability. The new SLR availability reporting is based on CCMSPING and focuses on the technical aspects of availability monitoring. It covers the following objects:
- System (ABAP stack): A system is considered to be available when its ABAP stack message server is reachable for the monitor tool and when at least one SAP Application Server instance is registered as active in the central instance. The necessity of an active SAP application server is not supported by the EWA standard reporting method.
- System (Java stack): A system is considered to be available when its Java stack message server is reachable for the monitor tool and when at least one Java instance is registered as active in the message server.
- Instance: An instance in CCMS is used as a synonym either for SAP NetWeaver Application Server (AS) instance for the ABAP stack or for the Java stack, and refers to the software side. An instance is considered to be available when either the SAP/Java AS instance is registered as active in the message server, or when the attempt to log on to the SAP NetWeaver instance through a Remote Function Call (RFC) is positively answered, offering a free work process for logon. You can monitor both criteria separately in CCMS.
- Logon group: A logon group is considered to be available when a logon to the SAP NetWeaver AS instance with the best dialog response time of the group is possible.
CCMSPING allows you to measure availability in configurable and short time intervals. The data is aggregated and stored in CPH.
Within SAP Solution Manager, you can report for availability on a 24-hour basis or restrict the reports to specific times of the day. The reporting also can make allowances for scheduled downtimes.
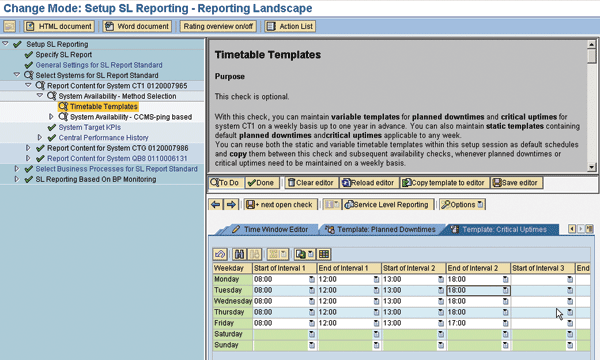
To be specific, you can define the reporting periods for “critical uptime” and “planned downtime,” which are defined as follows:
- Critical uptime: Time interval that is specified in advance for separate observation. The specified times are considered to be business-critical uptime intervals that require special attention regarding availability reporting. Alert thresholds during this time might be different from those defined for times outside the critical up-time intervals.
- Planned downtime: Time interval that is scheduled in advance for technical, administrative, or application reasons. During this time, the monitored object is intentionally unavailable for the end user.
SAP Solution Manager can measure unplanned downtime — that is, the downtime interval not scheduled in advance — where the monitored object is unavailable for the end user. This interval counts as an unintended disruption of the production process and may be counted against existing SLAs.
Several report formats are available for critical uptimes and planned downtimes for each availability object:
- 24h-Availablity: Measures uptime in relation to all hours in the day (that is, a 24-hour availability). Alerts are based on thresholds specific to this availability format.
- Critical uptime availability: Uptime measured during the critical uptime interval in relation to a defined critical uptime interval. Alerts are based on thresholds specific to this availability format.
- PDT-adjustment: The availability formats (24h-Availability and Critical uptime availability) can be adapted by means of the PDT adjustment — called planned downtime-adjusted availabilities. The PDT adjustment recalculates availability values that were purely based on detected downtimes and considers coincidences with planned downtime intervals.
If you want to account for planned downtimes in SLR, use a static timetable that covers one week or a variant timetable that covers up to one year in advance.
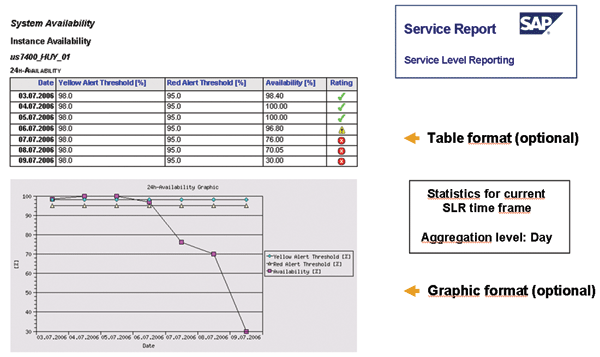
The report layout is preconfigured, but you can adjust some basic settings (e.g., if you want to display your data in a table or graphic format). For example if you have a limited amount of data and are interested in the development of a specific value over time, you might want to choose to display the data in both a table and graph (
Figure 19).

Figure 19
An example of a report that uses both a table and graph to display the data
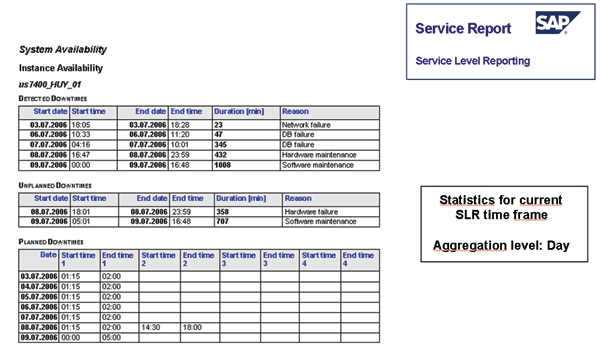
If you want to compare detailed values, you might want to use a series of tables, which may provide for a better overview (
Figure 20).

Figure 20
An example of a report that uses a series of tables
During the SLR postprocessing, which allows for manual modifications of the SLR content before the system issues the final report, you can attach downtime reasons to each detected downtime interval (
Figure 21). You can select one of the preconfigured standard reasons or add your own text.

Figure 21
SL reporting setup service session and postprocessing options for modifying a service level report
Monitoring Scenarios for SLR: Availability
Before you start to collect data, you have to decide which system is in charge of collecting the availability data. You have three options:
- Option 1: The satellite SAP system
- Option 2: Additional central monitoring system (CEN)
- Option 3: SAP Solution Manager acting as CEN
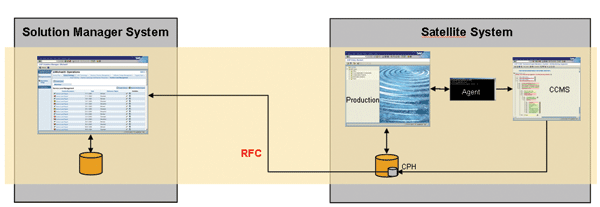
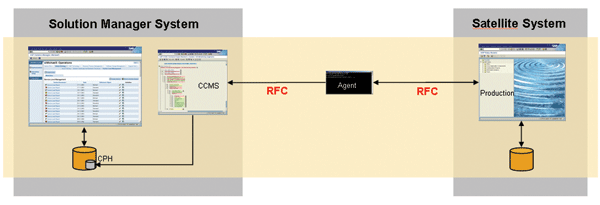
SAP recommends option 3, but for customers with large solution landscapes and high performance needs, option 2 might be the better choice. Option 1 would be appropriate for those customers with few system landscapes and where decentralized monitoring infrastructures have been established that use the local CCMS of the satellite systems for monitoring.
- Option 1: Satellite system — The CCMSping agent monitors the satellite system and reports its availability information to the local CPH of the same satellite. SAP Solution Manager retrieves CPH raw data directly from the satellite system (Figure 22).

Figure 22
CPH data directly from Satellite System
- Option 2: Additional CEN — The CCMSPING agent monitors the satellite system and reports its availability information to a CEN. SAP Solution Manager retrieves CPH raw data from the CEN. The CEN doesn’t need to be part of the solution landscape. It can be part of any satellite system in the solution landscape (Figure 23).

Figure 23
Monitoring using an additional CEN
- Option 3: SAP Solution Manager acting as CEN — The SAP Solution Manager system can act as a CEN. In this scenario, the CCMSPING agent that monitors the satellite system reports its availability information to SAP Solution Manager (Figure 24).

Figure 24
SAP Solution Manager as CEN (recommended)
System Availability Reporting
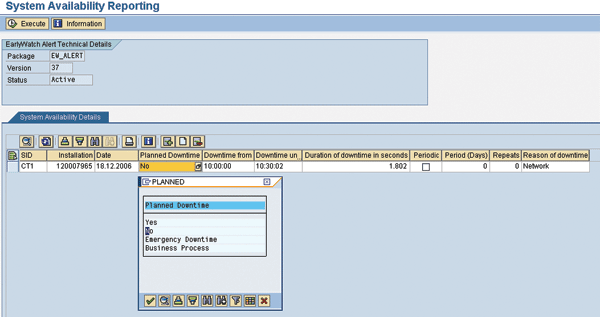
You can use the System Availability Reporting tool to report on the technical availability of hardware and software as opposed to the availability of an application. Found under Operations>Solution Reporting>Administration>System Availability Reporting, it is designed for high-level, quick, and manual reporting of your system availability (
Figure 25). It enables you to make notes regarding system uptimes and downtimes in a standardized way.

Figure 25
Manual availability reporting as a basic version for quick standard availability reporting
You record the downtimes for an SAP system (determined by SID and installation number). System Availability Reporting supports you with:
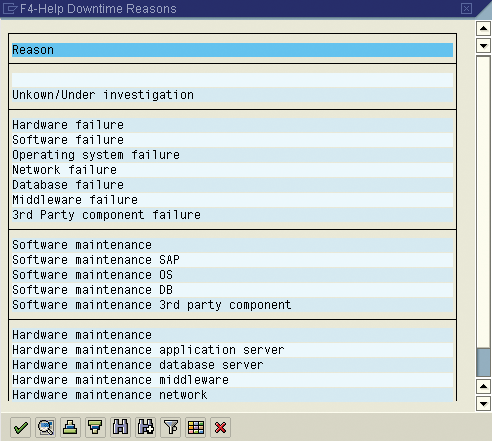
- Input help, which supplies the typical reasons for downtime and types of downtime to facilitate input. Selection options include scheduled and non-scheduled downtimes, emergency corrections, and problems with business processes. You can also make your own entries.
- After the system records the start and end of a downtime, it automatically calculates the duration; however, the administrator can override this recorded downtime.
- Network problems, hardware maintenance, software errors, and the database environment are possible reasons given for system downtime. You can add self-defined entries here as well.
- Downtimes can also be periodically maintained by selecting the Periodic check box and setting the duration of the period in days (seven days for weekly) as well as the number of repetitions (52 in a year). This system then takes this data into account for the generation of a document for weekly appearance, for example.
Conclusion
SAP Solution Manager 4.0 provides extensive reporting capabilities that allow you to generate technical and administrative information critical to protecting and maintaining a high performance system landscape.
Henrik Zimmermann
Henrik Zimmermann studied geography at the University of Heidelberg and the Freie Universität Berlin in Germany, where he concentrated on collaborative development and digital image processing. From 1998 to 2000, he was responsible for setting up the geomarketing area at Cartogis. From May 2000 to December 2001, he worked at SAP as a Supply Chain Management developer in the master data area. Since January 2002, Henrik has been a product manager for SAP Solution Manager, focusing on monitoring, IT reporting, service delivery, knowledge transfer, integration of testing and job scheduling partner products, and solution documentation.
You may contact the author at
henrik.zimmermann@sap.com.
If you have comments about this article or publication, or would like to submit an article idea, please contact the
editor.


 3. Navigate to Operations>Solution Monitoring>EarlyWatch Alert.
4. Click on the Display icon to view the source data of the EWA reports.
5. There will be a pop-up screen. Confirm the pop-up screen by clicking on the green check mark .
6. View the SAP EWA check tables. You can review the implemented notes and profile parameters of the SAP EWA checks and subchecks tables.


