SAP for a long time had AI capabilities included in tools such as SAP BW Data Mining Suite, SAP SAC, SAP HANA PAL Library on HANA Studio, SAP IBP and others. As I reviewed in
these articles a few years ago, the SAP AI tool that you need depends on the problem that you are trying to resolve, or just download the latest app and insert your face in the latest movie scenes and add muscles or lose weight and that would do it.
Before we begin, let’s clarify the term Generative AI since it’s just about anywhere on the web and managers just ask for it like asking for candy, so before you’re saying you like to use only Generative AI just try to answer yourself what it is and how it can be used to resolve your issues. Generative models have been used for many years in statistics to analyze and summarize numerical data and in the last few years these techniques have been used to be extended to images, speech, and other complex data types. First class of models to achieve this cross-over feat were
variational autoencoders, or VAEs, introduced in 2013. VAEs were the first deep-learning models to be widely used for generating realistic images and speech, such as those used in DALL-E and other image generators that you see in your social media feed. For more information on GenAI check this
link.
GenAI has been integrated into deep-learning models that take raw data like all of Wikipedia or every single painting located in the New York Museum of Modern Art (MOMA) - and ‘learn’ to generate statistically probable outputs or paintings or colors like those of the training data sets. In the previous example this was achieved by the artist Refik Anadol in a mesmerizing exhibit you can check out
here in order to perform “unsupervised” outputs based on training data to bring colors to fractals using every single color used in every painting in New York MOMA.
But with this example, even though it is beautiful, the purpose of the AI models was not to help you do your work better, and that’s when things get murky. Sometimes tools claim to be using GenAI but they are using something else, but you believe it is GenAI. At a high level, generative models encode a simplified representation of their training data and draw from it to create a new work that’s similar, but not identical, to the original data.
In comparison Fuzzy technique is used for search purposes among other applications, which is the initial algorithm used in Google search, thus it is about searching within data sets for specific data and finding relationships or similarities, and manually including them into your mappings. Fuzzy search is a search technique that finds matches even when the search query doesn't perfectly match corresponding data. It looks beyond literal character-for-character matching and identifies results that are like the search query in terms of spelling, meaning or other criteria. This may be particularly useful when dealing with user input, which can include things like typos, variations (plural vs singular, abbreviations, stemming and more), and other inconsistencies based on the different ways users communicate across the board. For more information you can review it
here.
Some tools are designed to resolve specific solutions, such as classification, decision trees, forecasting, outlier detection, ABC, Clustering, Regression Analysis, Association Analysis, machine learning, design of experiments, statistical analysis, Time Series, Text Processing and more. Look
here for more information about SAP S/4 HANA tools that can support your data science efforts.
In summary, statistical or mathematical techniques have been around for a long time in the industry and within the SAP landscape. What has changed is now they are more accepted and widely used since we are more creative in how to create better interfaces to make good use of them, and certainly cloud computing has created massive capabilities and device performance. The SAP platform has adopted many of these techniques over the years, but now everybody wants to use them without human intervention and with 100 percent accuracy, which I personally do not recommend from a practical point of view.
What is Fuzzy Search and how it can help you to provide fast solutions in SAP Datasphere?
The Fuzzy Match option available in SAP Datasphere is focused in helping you manage and join data sets with similar but not identical database keys following a human-like logic: ‘if the data looks similar, they might be the same’. For example, searching for the word ‘apple’ or ‘Apple’ available in one data set and joining it with two or more data sets that have the words ‘appple’, ‘aple’, ‘a pple’, and other variations. For a human, clearly we will see there is some relationship but for a computer you need math to define these relationships, and that’s where Fuzzy Search is one of the best options to perform this analysis by training mathematical models to infer relationships with little or no code.
The next problem is selecting the right tool to deploy, we cannot talk of AI without speaking of Python and the number of libraries available, and lots of free elements you can retrieve from the web easily. However, from an industrial point of view is challenging since it is a language that requires a lot of work and can create incorrect errors due to significant coding or data manipulation required to get outcomes, and for business users that need quick results well I know I will get lots of hate mail, it is not an easy-to-use interface remember Python is FREE. With the last point once again, SAP Datasphere interface and SAP work to deploy this solution has been great, and also in comparison with previous SAP HANA offerings for the Fuzzy Search as shown in the following link that is still valid as of Q3 2024 shown in this for
SAP HANA Platform using Full-Text Search with SQL
For a start, I must say the interface created in SAP Datasphere is significantly better than the previous options for the following reasons:
- Data sets without a common key can be easily integrated with each other.
- Can be applied to both SAP and non-SAP data using multiple connections.
- New fields can be easily added to improve reporting or improve data quality.
- User-friendly so it can easily be deployed and integrated with your operational reporting using Analytical Models.
- Fuzzy Score users can quickly determine how strong the relationships are with a value between 0 to 100 percent, 100 percent being an exact match of the two strings being compared and 0 percent being no similarities at all identified. Here is where the fast and fault-tolerant feature in SAP Datasphere is applied since Fuzzy technique needs to estimate similarly using the Fuzzy Score as key performance, which might result in further analysis to identify what to do with a reject case.
- Improved data analysis so the Fuzzy Match allows the discovery of relationships that might have been previously overlooked.
Practical approach to use SAP AI Fuzzy Match in SAP Datasphere
Let’s do this! Certainly, the term AI and big words like the ones we discussed in the previous sections can be intimidating, but at the end of this section it would be much easier for you to leverage the possibilities that SAP Datasphere will bring to your organization with an easy-to-use tool. Let’s follow these steps:
1. We need two data sets or two sources of data that we want to compare. For our example I am leveraging this data from Kaggle.com an AI and Data Science platform to access freely accessible data common in academia and industry to build or test models. The
data set is from the State of New York Utility about Residential Home Energy Efficiency.
2. The outcome of our analysis is shown in Figure 1 with a flowchart that goes from left to right, the last box, ‘Output’, is the object that will contain our records with 4 columns and approximately 2000 rows because of the joint created using Fuzzy Match. Notice in Figure 1 there are two Input boxes and here I uploaded two tables ‘source1’ and ‘source2’ that I will compare with the Fuzzy Match, and the rules are in the Rule box located in the middle of Figure1.
 Figure 1 - Final Outcome for Intelligent Lookup in SAP Datasphere.
3. Clarifying the problem. In this case, we would like to compare and find similarities in two sets of data, as shown in Figure 2 we have samples of the tables described in Figure 1. Notice in Figure 2, we see that the headers are not the same for the two fields that we think might be a good key, and the master data is similar but not quite the same just like how a human brain ‘thinks’. Also, notice that I am simplifying the rule, the rule can involve more than one field to field comparison, but for simplification I am only comparing one column Customer vs CID columns in our datasets as shown in the arrows in Figure 2.
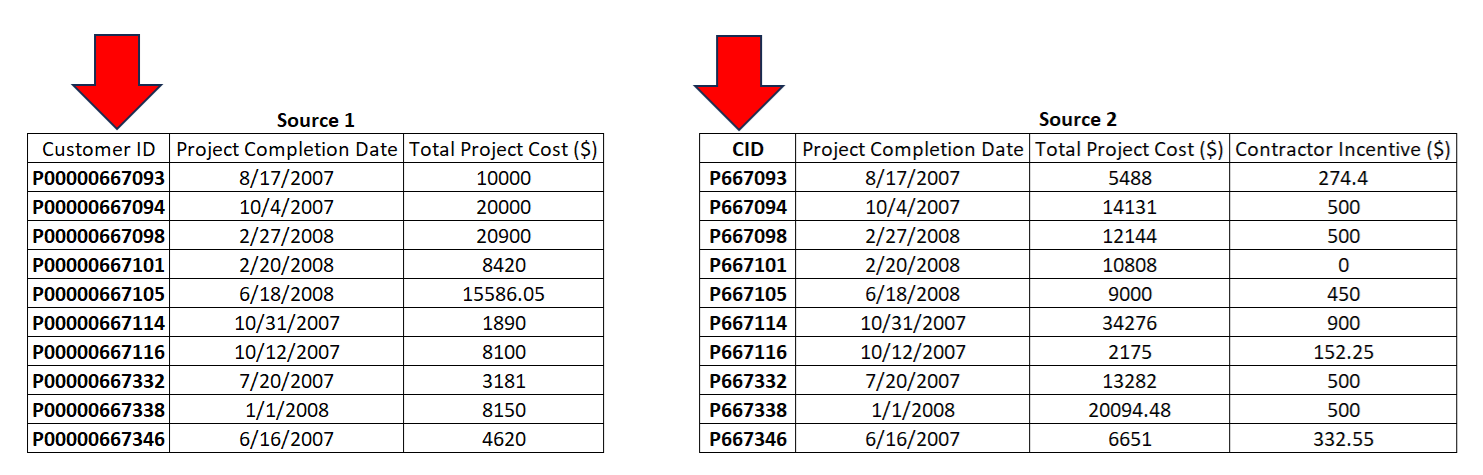 Figure 2 — Comparing the two data sets.
4. Access your SAP Datasphere environment and go to the Data Builder as shown in Figure 3 and identify the Intelligent Lookup component. That’s where we can create and configure the comparison using Fuzzy Match. Remember, this is a cloud solution or Software-as-a-Service (SaaS), you can get it working today if needed.
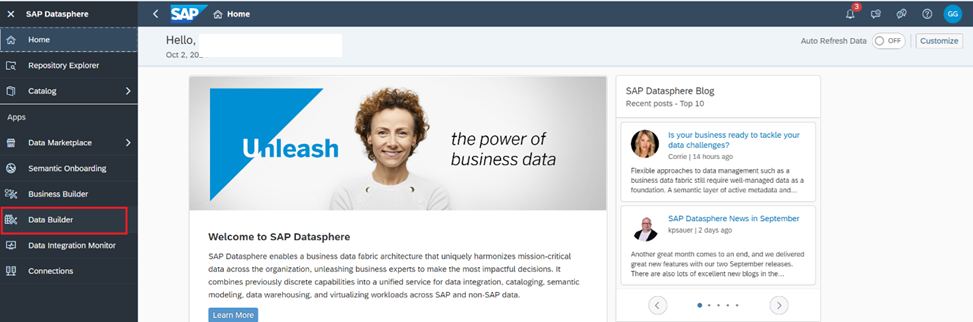 Figure 3 - Working with the Data Builder.
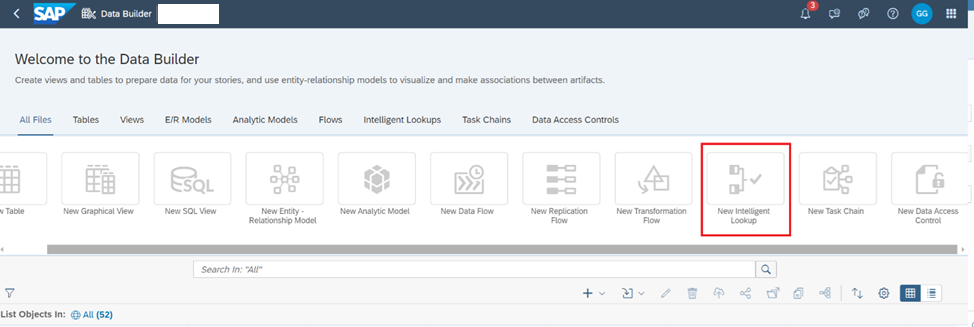 Figure 4 - Creating a new Intelligent Lookup in the Data Builder.
5. As shown in Figure 5, the default building blocks of the Intelligent Lookup are displayed. Notice two input boxes on the left, one Rule table in the middle and an Output View on the right. Also notice there are number of objects on the left-hand side of the screen, and you see our tables 'source1' and 'source2'. How to populate the Input boxes? Just drag and drop the tables to be used for comparison in the Input boxes.
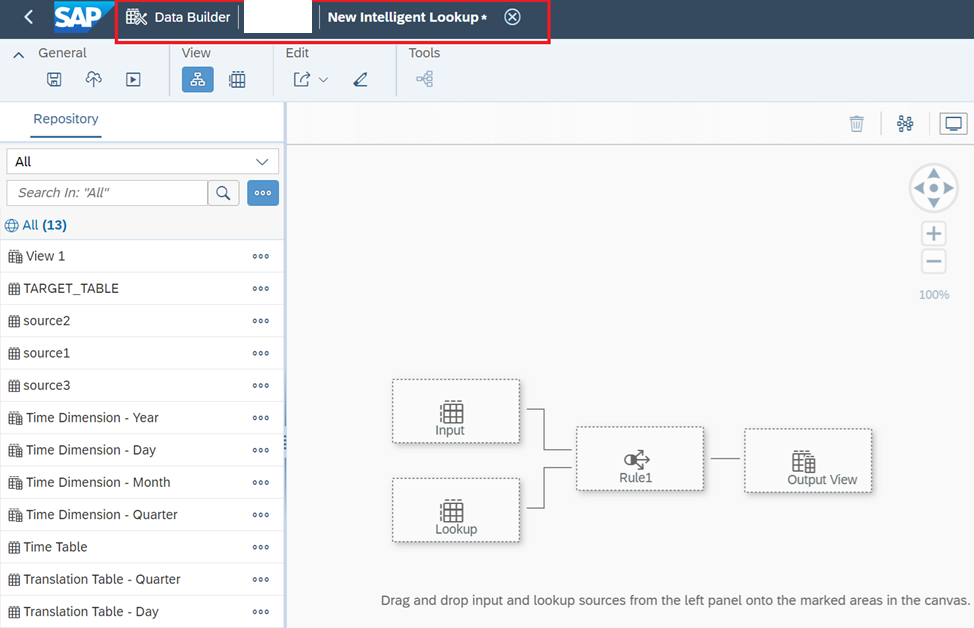 Figure 5 - Default building blocks in the Intelligent Lookup.
6. An important element is you must define in each INPUT Box the dimension needed to compare. For SAP Datasphere, this is called Pairing Column, as shown in Figure 6. We had to drag and drop Customer for 'source1' table, and CID for 'source2' table respectively. Notice you can compare more than just one at a time, and you can add more columns depending on the relationships you are searching. Notice so far there is NO CODING, just drag and drop and drop-down selections. I hope now the interface looks less intimidating than the concepts of the previous section.
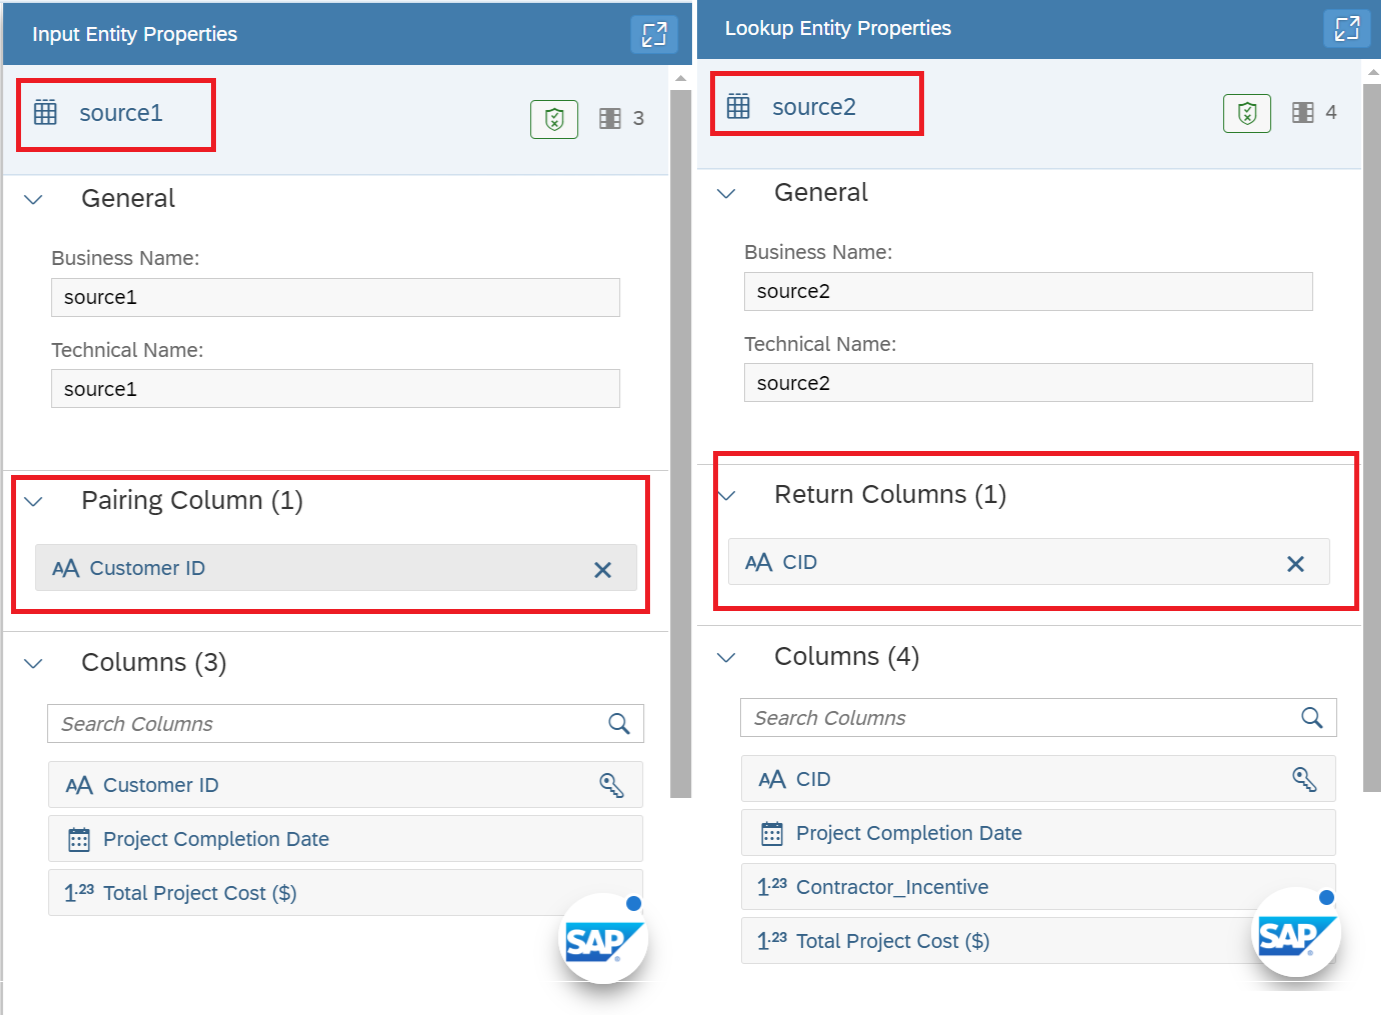 Figure 6 - Defining the Pairing Columns in your Input data sets.
7. Now let’s focus our attention to Figure 7, and the Rule box. Click on it and review the Rule Properties on the right-hand side in the Match Strategy drop-down window, choose the Fuzzy Match, and notice how the selections change as shown in Figure 8, and you see this is how we define our level of tolerance on deviation from the expectation to the system. What is available in 'source1' vs 'source2', and how similar we want the comparison to be. Again, the system does not know your data, it just knows there is data to compare a human must define how to compare it so it makes sense to the human.
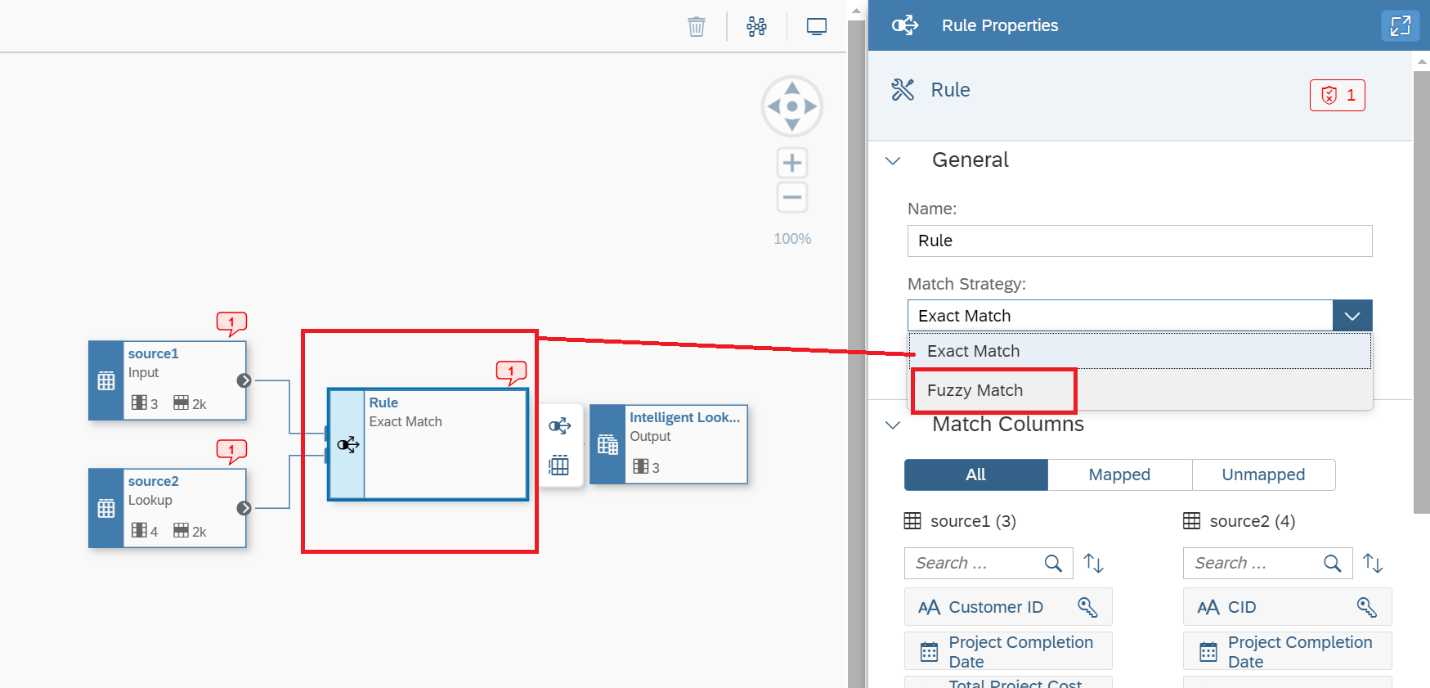 Figure 7 - Defining the Fuzzy Match in the Rule box.
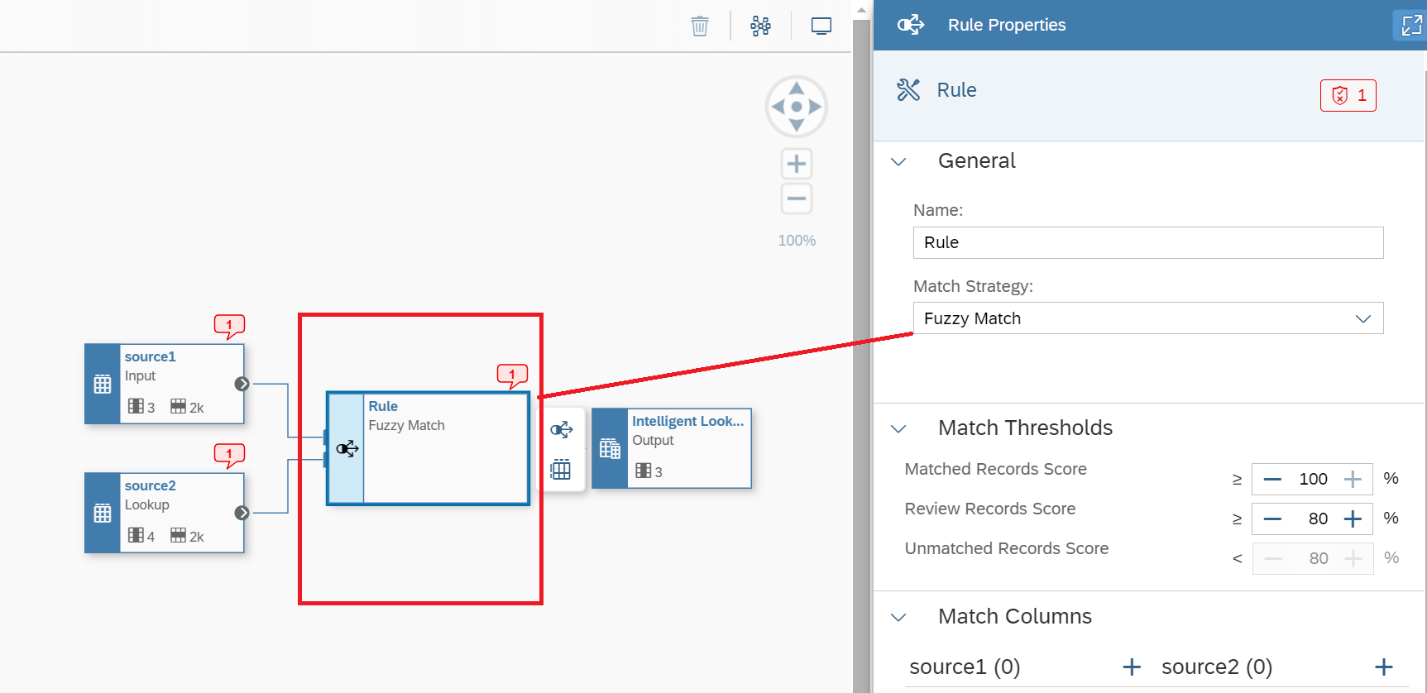 Figure 8 - Rule box after selecting the Fuzzy match Strategy.
8. When the Fuzzy Match Strategy is selected, and you click on the Rule box as shown in Figure 9, you see the Match Thresholds. This is the fault-tolerant or human controlled ranges that will drive the search. You can run these rules and adjust as you get more familiar with the data quality of your data sets. Table 1 displays the purpose of each of the data ranges shown in Figure 9.
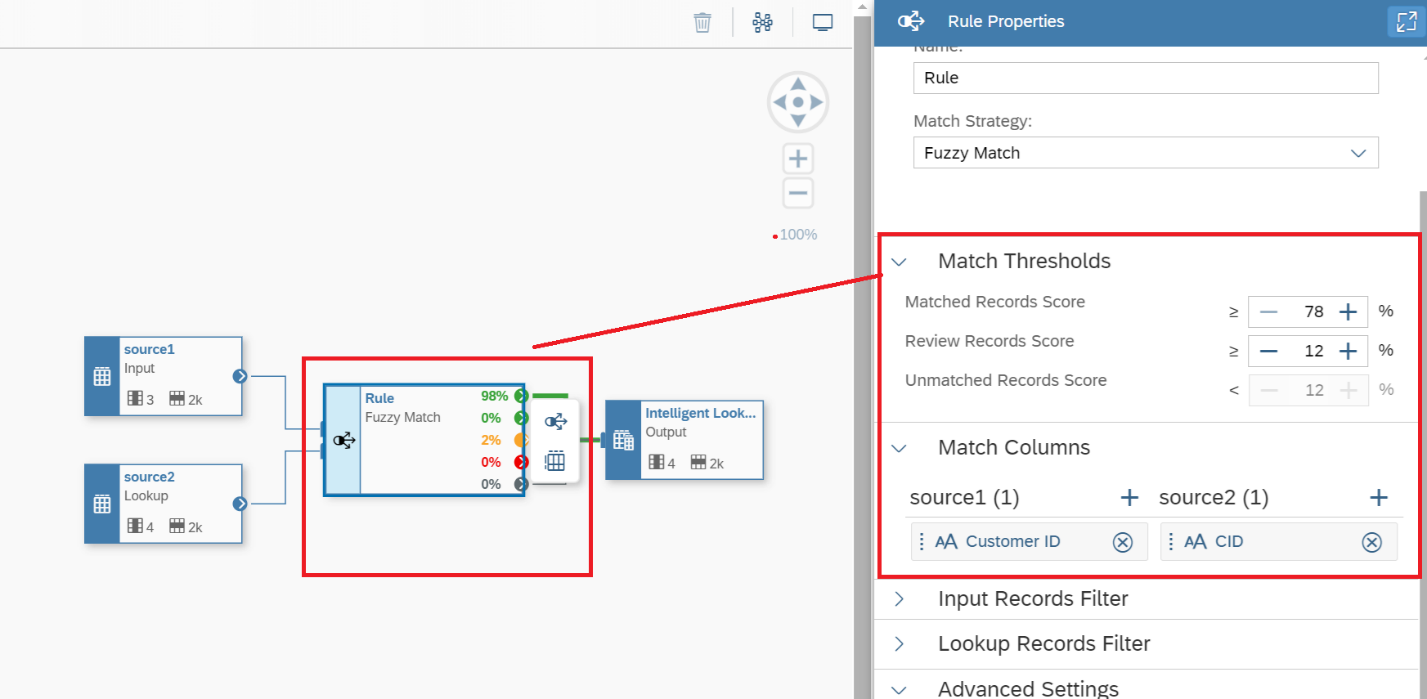 Figure 9 - Reviewing the Fuzzy Match Rule Properties.
| Property |
Description |
| Matched Records Score |
Set the minimum score needed to match an input record with a lookup record and place it in the Matched results category.
If an input record is matched to more than one lookup records with a score reaching this threshold, it is placed in the Multiple results categories.
Default: 100 percent |
| Review Records Score |
Set the minimum score needed to match an input record with a lookup record and place it in the Review results category.
If an input record is matched to more than one lookup records with a score between this threshold and the Matched Records Score, it is placed in the Multiple results categories.
Default: 80 percent |
| Unmatched Records Score |
Displays the score beneath which an input record cannot be matched.
If an input record is not matched to any lookup record with a score above this threshold, then it is placed in the Unmatched results category. |
Table 1 - Reviewing the Fuzzy Match Thresholds
In addition, Figure 9 displays three other components described as follows:
- Input Records Filter: specify a filter expression to restrict the input records that are considered for matching in the rule. You can reference any of the columns in the input entity and use any standard operators. For example, entering Revenue > 100000 AND Status = 'Active' would restrict the records to be processed to only those meeting both these criteria. If an Input Records Filter is defined, a filter symbol is displayed in the top-left corner of the rule symbol.
- Lookup Records Filter: specify a filter expression to restrict the lookup records that are considered for matching in the rule. You can reference any of the columns in the lookup entity and use any standard operators. For example, entering Revenue > 100000 AND Status = 'Active' would restrict the records to be processed to only those meeting both these criteria. If a Lookup Records Filter is defined, a filter symbol is displayed in the bottom-left corner of the rule symbol.
- Fuzzy Match Advanced Settings: Control auto-selection among multiple matches in the Advanced Settings section.
9. Now that your model is built, you need to perform 3 steps which are mandatory in SAP Datasphere: save your model, deploy, and run, using the three menus shown in Figure 10. The system will tell you if you forgot to deploy before your 'run' just in case. The 'run' option is executed as a job, that can also be scheduled periodically as the source data changes.
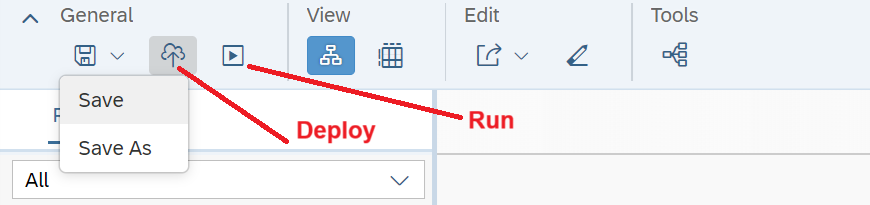 Figure 10—Mandatory steps in SAP Datasphere
.
10. After you execute the intelligent lookup, you can run it multiple times as you review and adjust your rules and your data. As shown in Figure 11, by clicking on the Rule Box you can review the matching that system identify based on your Match Thresholds shown in Figure 9. Notice in the table shown in Figure 10, there is a Matched section where the records that followed our rules are displayed and represent the ones in green based on the Score, and the comparison of Customer ID vs CID columns automatically and without any script or programming required by the end-user.
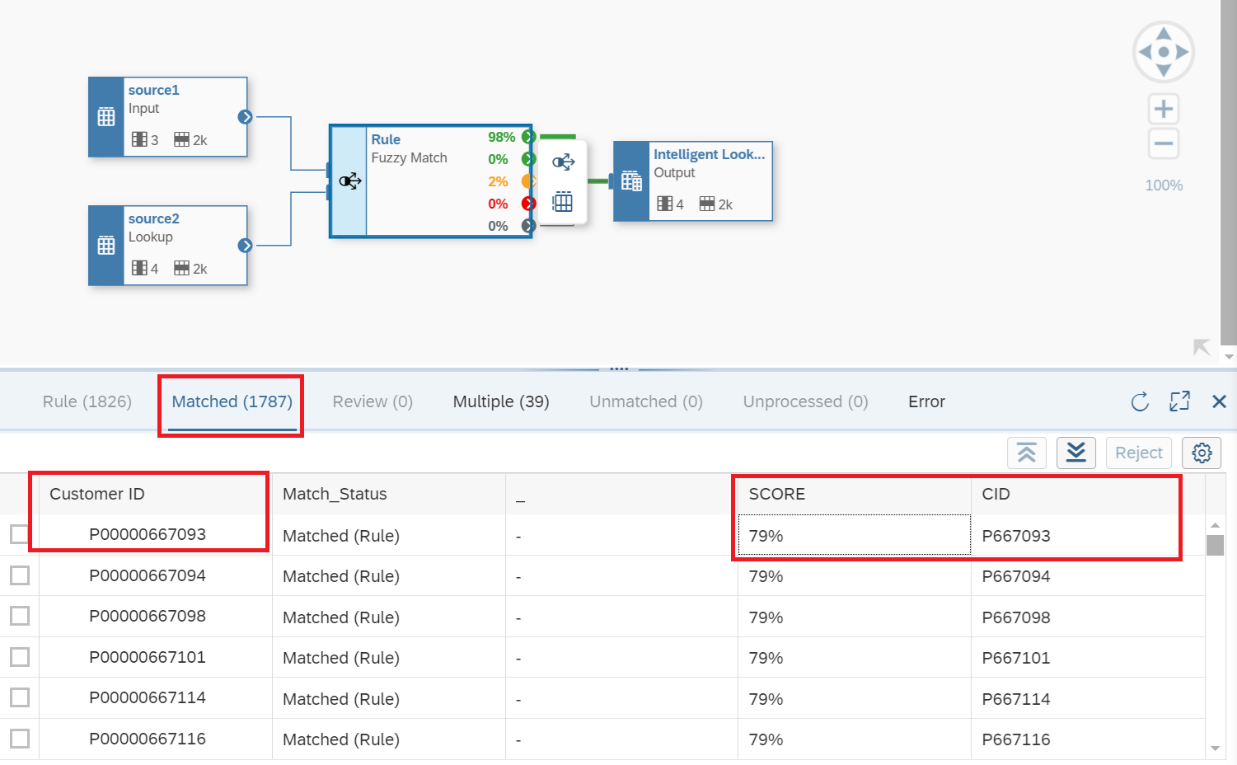 Figure 11 - Reviewing the results of the Intelligent Lookup Run.
11. As shown in Figure 12, the Multiple Section displays the records, displayed in yellow, that the system is not sure. You must click on one record on the left and you see the possibilities to match on the right-hand side along with the Score (Fuzzy Score). As shown in Figure 12, you must click on the Customer ID record, and match it with the one on the right, and click on the Match button. This procedure will automatically create a rule in the Fuzzy Match box or Rule that will be maintained for as many records you think are appropriate. For example, the records P667105, P671005, and P671065 very similar. After you click on the match button the record will disappear from the Multiple section, and added to the Matched section, and the percentage displayed in the Rule box will also be adjusted.
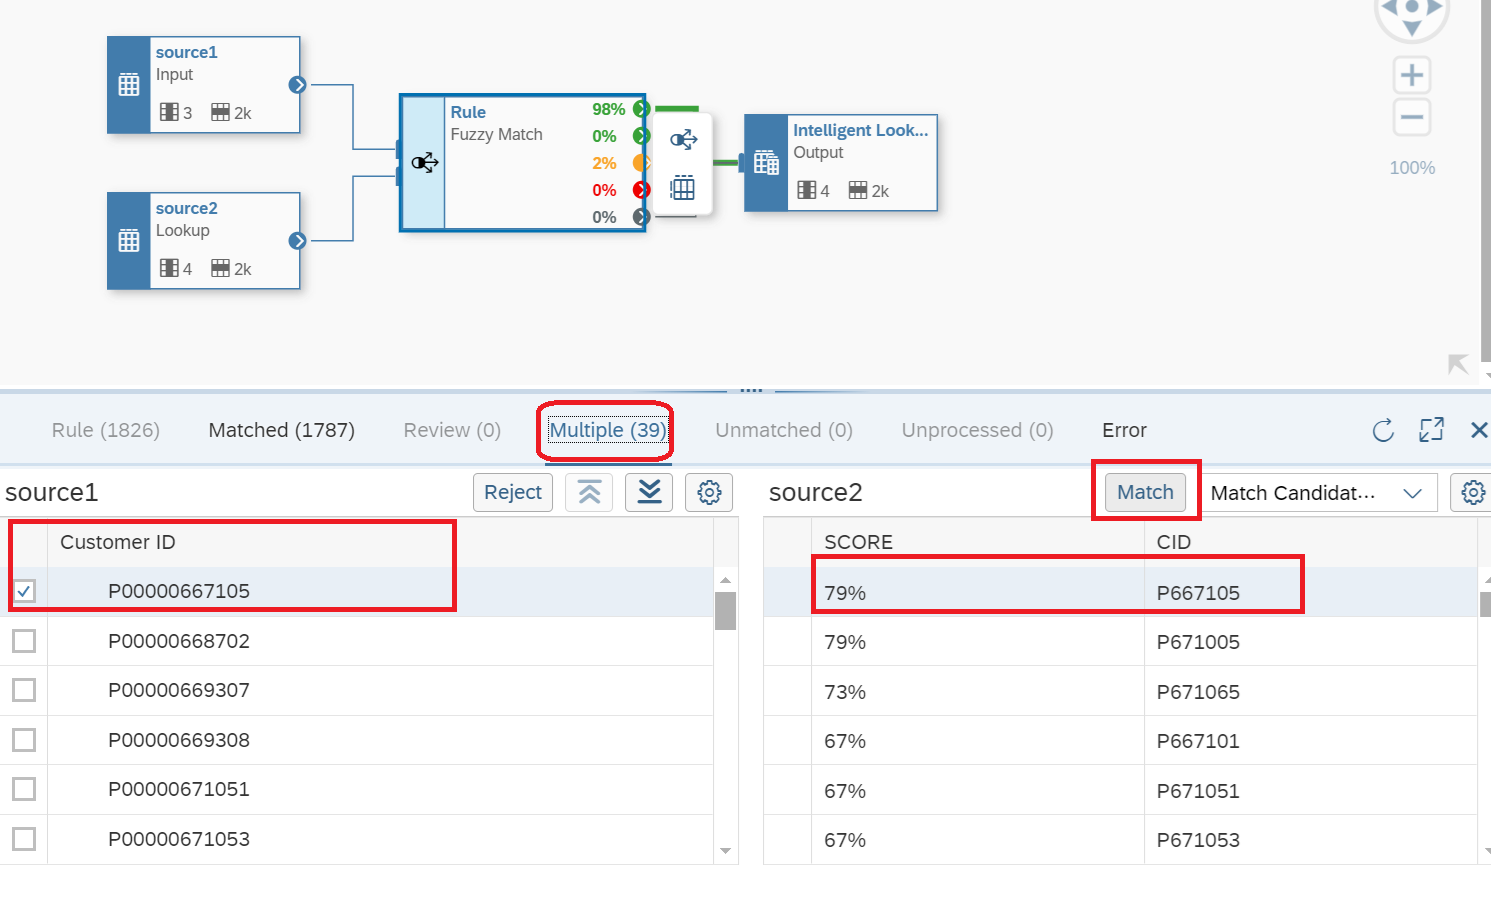 Figure 12 - Reviewing the results of the Intelligent Lookup Run in Multiple sections.
Notice in Figure 12, there are no Unmatched records, meaning transactional data that was not identified by the algorithm to meet the predefined search criteria. However, the Multiple section clearly shows a percentage the algorithm is no sure how to determine the relationship. We will resolve this issue in a different step since we know there are 39 records that do not have a clear rule.
12. To review the transactional data, and you can filter out fields as well since you might not need all columns available in your tables. If you click on the Output Box as shown in Figure 13, you will display the data matched and joined based on the rules defined in the Rule Fuzzy match box. Notice in Figure 13, there are 1000 records displayed from 1826 records available. Also notice in Figure 13, both columns used for comparison appear and the other columns selected are displayed and now we can use this link for reporting with the creation of views or Analytical Models and integrate this analysis in your reporting in Datasphere or SAP SAC.
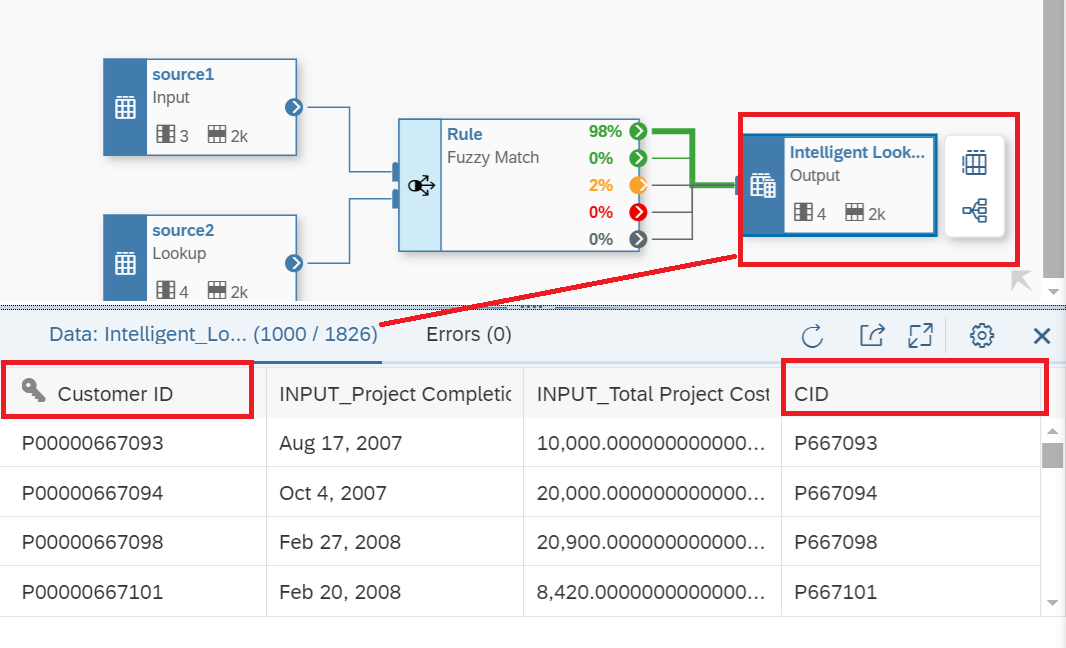 Figure 13 - Reviewing the results of the Intelligent Lookup Run in Multiple section.
For example, notice in Figure 13 the system has matched the records for P00000667093 and P667093 automatically based on the Matched Thresholds, and remember, no coding! Now as we discussed in Step 11, there are 39 records that the system needs help to complete confirming the match or the rules to apply to the transactional data.
13. Ok we must clean our rules in 2 percent of the total records available or the Multiple Matches section we reviewed previously in Figure 12. As shown in Figure 14, if we click on the Rule box icon as shown and click on the Multiple Matches option (yellow color), and in this way we are creating a new data flow that will reroute the 2 percent, or 39 records, that the system requires further clarification. After you define the new rules, you must Save, Deploy, and Run and the results are displayed in Figure 15.
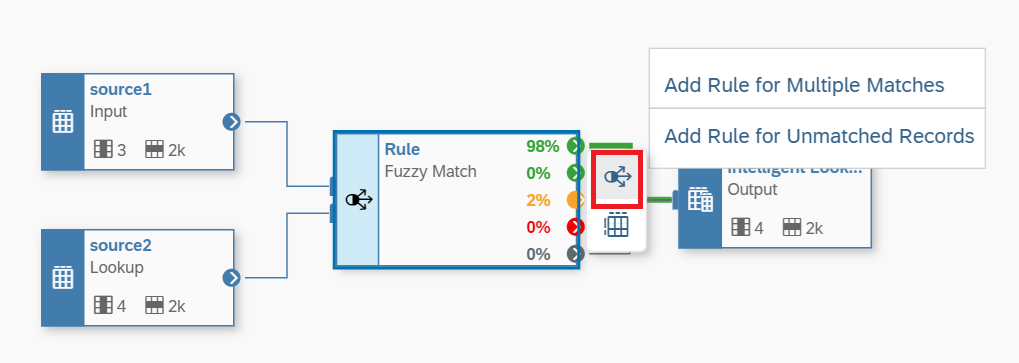 Figure 14 - Improving your Fuzzy Rules for the Multiple Matches data set
.
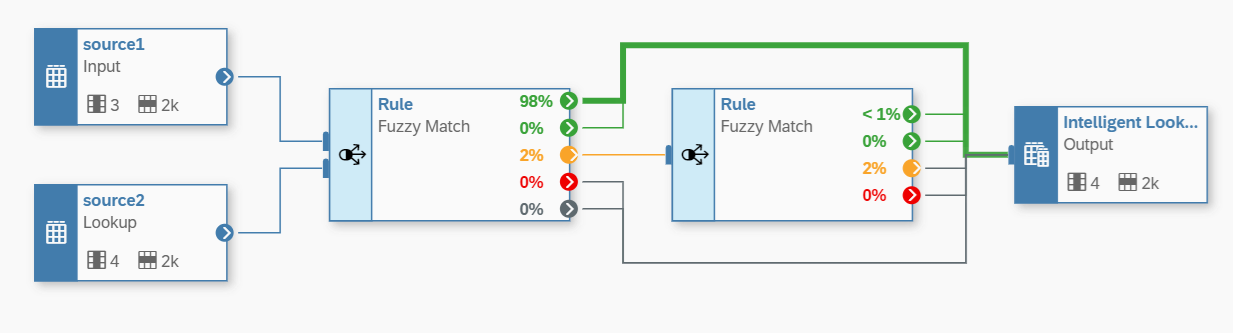 Figure 15— Adding new Matched Thresholds to your new Rule Fuzzy Match.
14. The result after the Run is displayed in Figure 16. Notice that now, of the total 39 records, with the new rules, 5 records are Matched but the system still has 34 records that require further analysis to make the correct Matching Rule. We can continue improving our model, but you now have the idea on how to carry out the procedure. The rules will apply to all new data available in either of the two Input data sources.
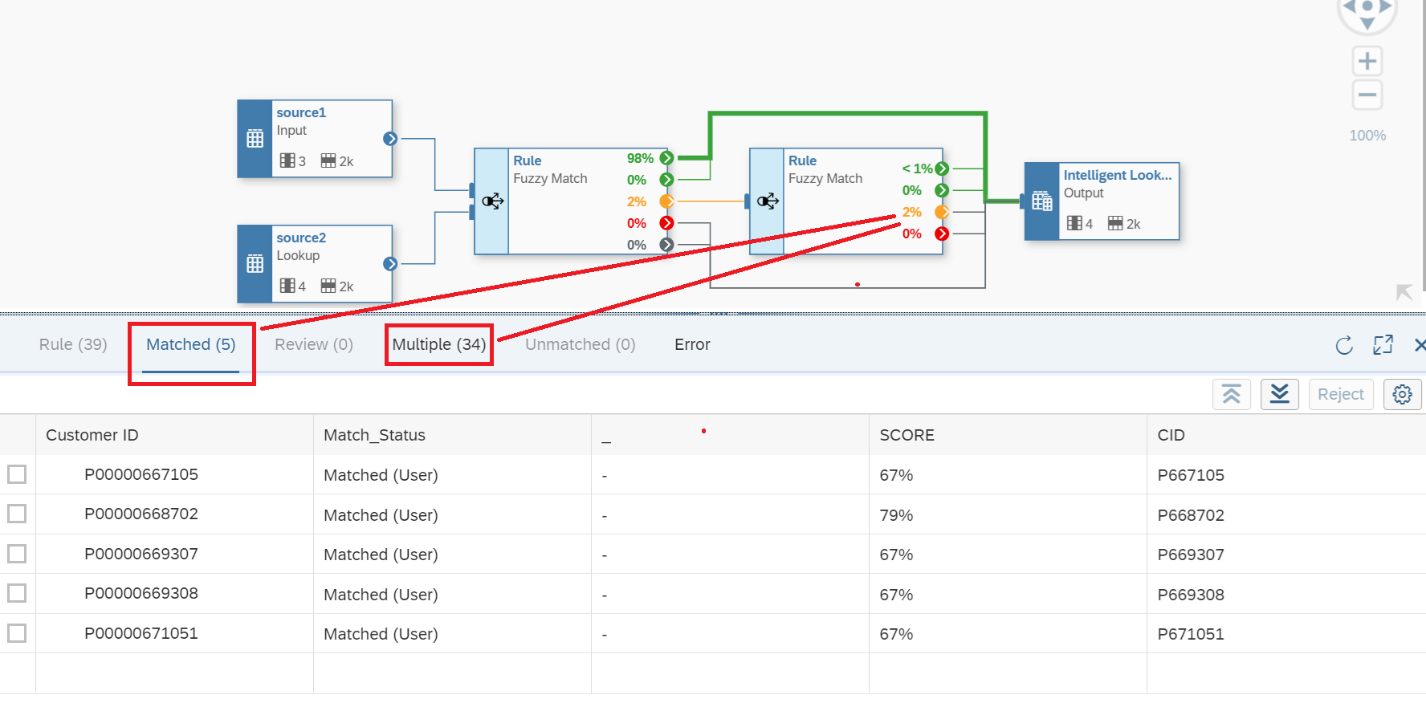 Figure 16— Results of the New Rule added with Matched vs Multiple Records.
Now when you exit the Data Builder, and you want to review the Intelligent Lookup object we created - it can be found as displayed in Figure 17 and, remember, for this object to work, it must be in “Deployed” status.
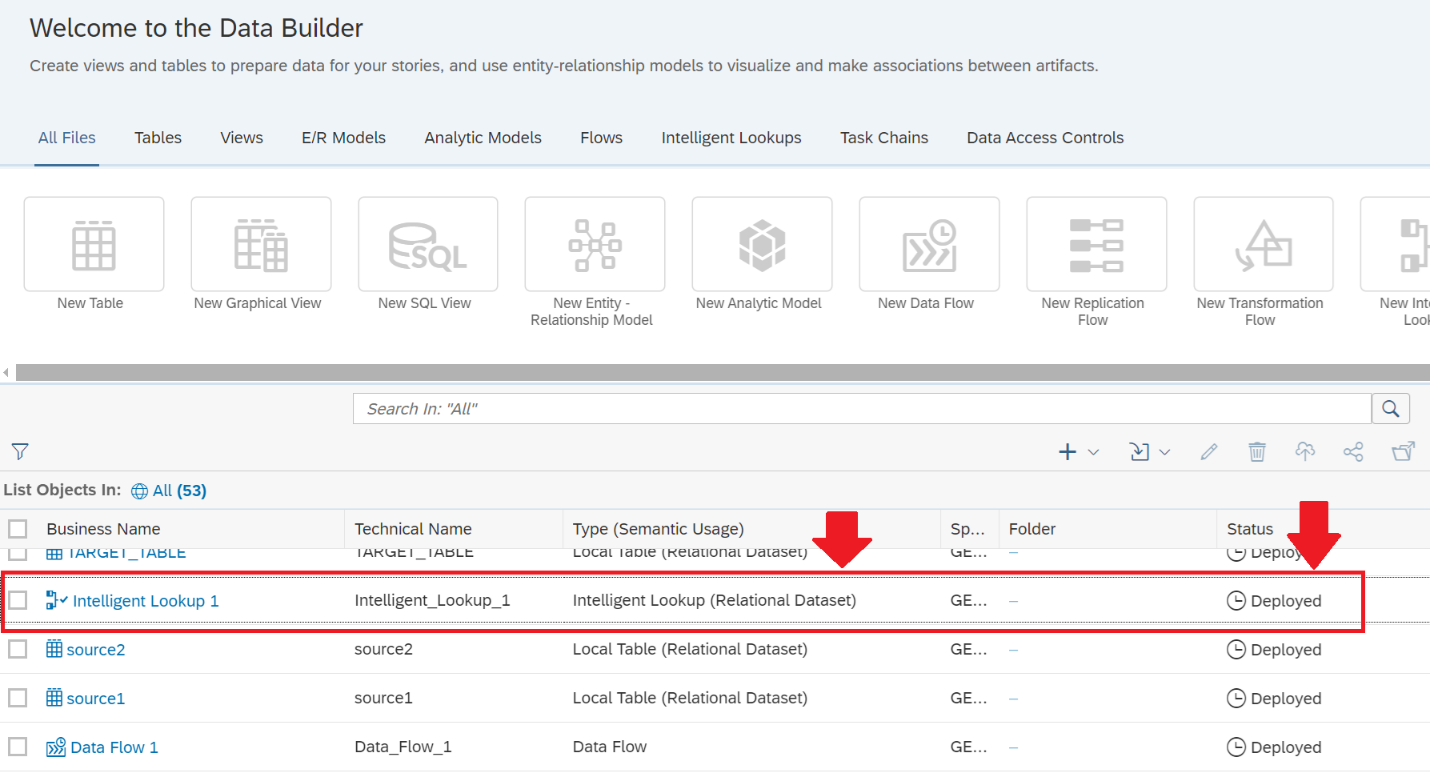 Figure 17 - Identifying the Intelligent Lookup object in your SAP Datasphere Data Builder.
16. Finally, since we now have data in the Output View, we can integrate this data as part of other Analytic Models available in your landscape. Some options are displayed in Figure 18 and Figure 19 for your consideration, using Data Flow to populate another Table or be included in a Graphical View.
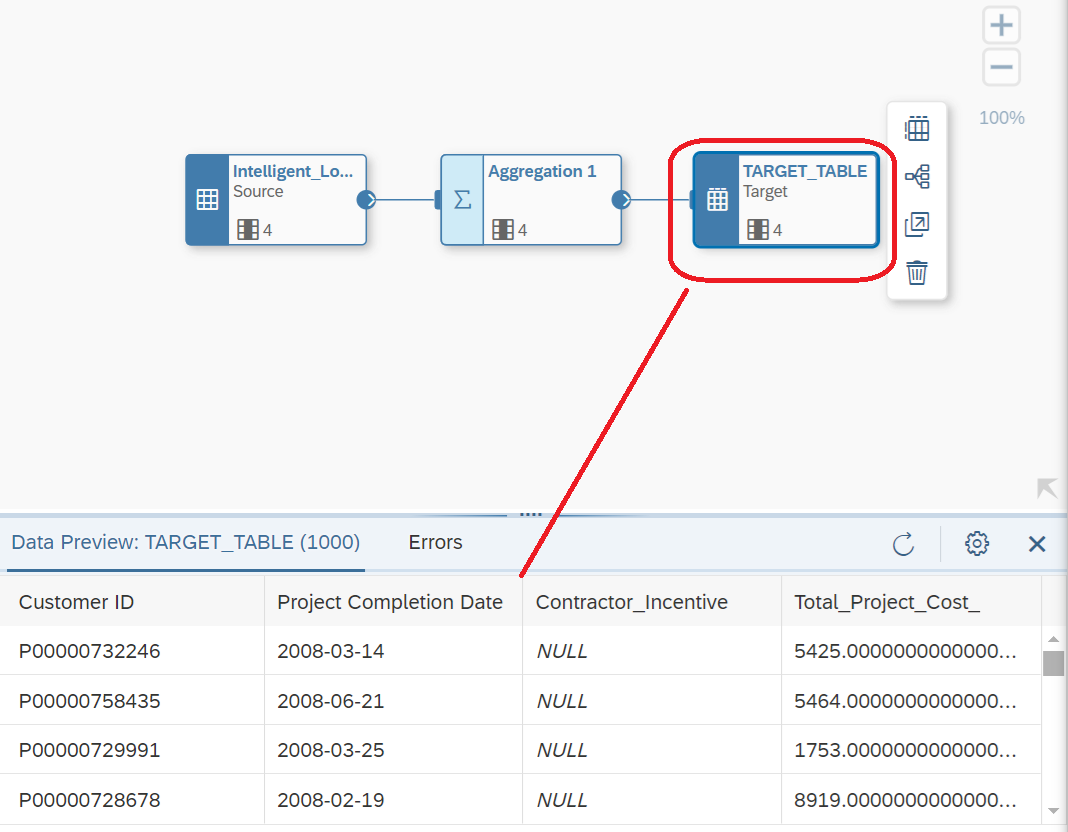 Figure 18 - Transferring the data from your Intelligent Lookup to a Table using Data Flow object.
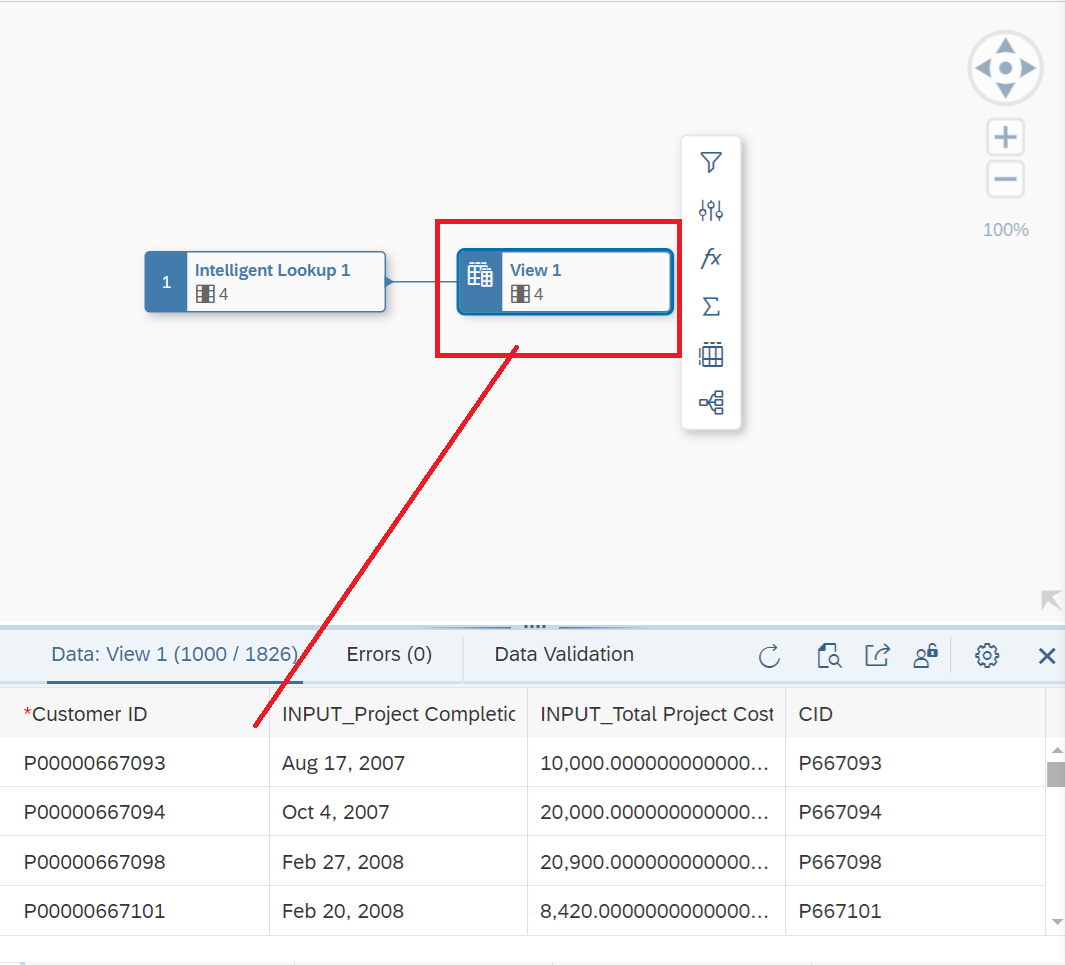 Figure 19 - Transferring the data from your Intelligent Lookup to a Graphical View.
We just explored one of the many capabilities of SAP Datasphere and how SAP is creating powerful, easy-to-use solutions to incorporate different methods of artificial intelligence into the business environment. These solutions aim to simplify how businesses manage complex data flows. There are currently many tools available within the SAP landscape that can support SAP AI and data science projects, helping to deliver meaningful results.
However, the challenge lies in clearly isolating the problem and identifying the right tools and applications to provide the appropriate solutions for the business. SAP Datasphere is one of the key new products SAP offers to help manage organizational complexity with a simple approach. It is recommended that business managers spend time understanding the problems they are trying to solve before choosing the tools. This helps avoid selecting a tool that may not fully address the initial issue. For example, if you need basic forecasting capabilities, SAP Analytics Cloud (SAC) can provide estimates and simple forecasting options for high-level analysts. However, if you're seeking a more data science-driven approach with better results, the implementation of SAP Integrated Business Planning (IBP) Cloud might be a better fit. These tools differ in their ability to manage complexity and deliver results.
Arellius Enterprises and its SAP AI expertise is used to providing a solution for clients. Business managers and users are increasingly open to exploring AI and SAP AI deployments. However, extra care must be taken to understand that AI is a tool that requires human oversight and interaction to ensure that algorithms are performing as intended. It is important to avoid the misconception that AI can replace human capital; rather, it should be used to do more, in less time, and to accomplish tasks that were previously impossible.