Solution Manager 7.1 allows you to monitor almost anything in an SAP landscape, but how does it do it? See the components within Technical Monitoring that provide all the necessary data to send alerts, including diagnostics agents, Wily Introscope Enterprise Manager, and the Wily agents that are deployed on managed systems. Review how Solution Manager uses Remote Function Calls and data extractors to collect data on managed systems and see how Technical Monitoring functions behind the scenes. Learn how to ensure the successful implementation and management of Technical Monitoring.
Key Concept
The extractor framework is a primary component of Technical Monitoring. It is the central infrastructure component for data collection and distribution. It provides the data required for alerts to be generated by Technical Monitoring.
Solution Manager 7.1 provides five specific types of monitoring: system monitoring, Solution Manager self-monitoring, end-user experience monitoring, interface and Process Orchestration (PO) monitoring, and job and BI monitoring.
This set of tools is expansive in its ability to monitor your SAP and non-SAP landscape. This expansiveness inherently creates a challenge to administer, configure, and troubleshoot successfully. The process of collecting the data required for Technical Monitoring and then processing it to generate an alert requires this type of extensive set of tools.
I focus specifically on how Solution Manager collects the data and then processes it to generate an alert. Putting all the pieces together provides a complete picture of how Technical Monitoring functions behind the scenes. This will allow you to better administer, configure, and troubleshoot all your Technical Monitoring tools.
Collecting Data from a Managed System
How Solution Manager collects data from a managed system varies. This variance is dependent on the type of managed system, SAP or non-SAP, ABAP, or Java. The tools that Solution Manager uses to collect data for Technical Monitoring are called data providers. When troubleshooting, customizing, and configuring Technical Monitoring, it is vital to know how these data providers function and the roles they play in collecting data.
Remote Function Calls (RFCs)
RFCs are used in two ways, from Solution Manager or from the diagnostics agent installed on the managed system’s hosts. When an RFC is used from Solution Manager it is considered remote, and when it is from the diagnostics agent it is considered local. These RFCs are created during the process of connecting Solution Manager to an ABAP-managed system, called managed system configuration.
RFCs collect data directly from the managed system in a few different ways:
1. Pulling the current status of a Computing Center Management System (CCMS) Monitoring Tree Elements (MTE)
2. Pulling the data provided by the Solution Tools Plug-In (ST-PI) tools and Service Tools for Applications Plug-In (ST-A/PI)
3. RFC connection test – A standard connection test on the RFC to check the availability of the managed system.
4. Executing programs and reports in the managed system followed by collecting the data provided by those programs and reports.
ST-PI and ST-A/PI are plug-ins installed on all SAP managed systems. They provide a set of ABAP function modules that can be executed by Solution Manager via the RFCs.
1. ST-A/PI – Service Tools for Applications Plug-In: Application monitor ST14, RTCCTOOL, ST12 and application-specific Service Data Collection Center (SDCC) data collectors.
2. ST-PI – Solution Tools Plug-In: Formerly Basis tools and trace tools (TCC). ST-PI is used for the Service and Data Collection Center (SDCC) and download modules, as well as other tools that are used by SAP Support Services (e.g., GoingLive Check, EarlyWatch Check, and EarlyWatch Alert).
These tools must be updated manually in each managed ABAP system. I recommend updating these tools every time SAP releases a new version, especially if you keep Solution Manager up to date.
Database Administration Cockpit (DBACockpit)
During the process of completing managed system configuration, Solution Manager is directly connected to the database of a managed system. This allows Solution Manager to monitor the database of a managed system. All the standard functions of the DBACockpit are provided when this connection is made. This connection is also a source of data for Solution Manager to monitor and generate alerts.
Diagnostics Agents
Diagnostics agents are installed on every managed system host. As of Solution Manager 7.1 the diagnostics agent replaces the previous tool, CCMS Agents. The diagnostics agent contains a lot of the same applications that the CCMS agents contained, as well as many new ones. They connect directly to Solution Manager, giving Solution Manager access to each host of all the managed systems. They also provide Solution Manager with a local path to collect data on any application that is running on that host. Beyond the application running on the host, the diagnostics agent allows Solution Manager to monitor the host via the host agent, another tool installed in conjunction with the diagnostics agent.
The diagnostics agent is made up of a collection of applications. Each application is designed to collect specific data. The diagnostics agents are designed to collect data on different types of applications, SAP and non-SAP. It is important to understand this because at times the parameters of these applications must be manually adjusted to meet the specific requirements of the application that needs to be monitored. At times adjustments also need to be made to resolve issues that may arise.
The diagnostics agent has the ability to be installed on-the-fly for applications when a database or SAP application is installed in a clustered environment. This is done by installing the diagnostics agent without a predefined host name. This allows Solution Manager to assign any host name in the event that the application or database fails over. After the installation of the diagnostics agent, the agent on-the-fly feature must be activated within Solution Manager. You complete the managed system configuration for each specific host that is part of the clustered environment. This agent on-the-fly feature ensures that Solution Manager can monitor a system even when it has failed over to another host.
The applications that run in the diagnostics agent are automatically updated by Solution Manager to match the release of Solution Manager. However, Solution Manager cannot patch the kernel of the diagnostics agent; this must be done manually. I recommend using the latest version of diagnostics agent, version 7.42. (7.42 refers to SAP Kernel 7.42).
Host Agent
The host agent is automatically installed when the diagnostics agent is installed during the installation of an SAP NetWeaver application. It can also be installed as a standalone application manually or with Software Provisioning Manager (SWPM). The host agent is designed to collect all types of information on the host, from performance data to disk space usage to the technical details of a host such as host name, OS version, and IP address. The process of collecting these technical details is called outside discovery and is absolutely essential for Solution Manager to monitor the host. The host agent also provides SAP Application Control, Database Monitoring, and Operating System Monitoring (the primary feature most people think of) using SAPOSCol.
The host agent also provides the diagnostics agent with administrative control over the host. In turn this grants Solution Manager that same access. This allows Solution Manager to pull all the same data on the host that it collects for the SAP NetWeaver application. Even further expanding the abilities of these basic features, you can create custom scripts to pull data that is unique to a specific requirement. This allows Solution Manager to monitor anything a user may require beyond what SAP originally allows for.
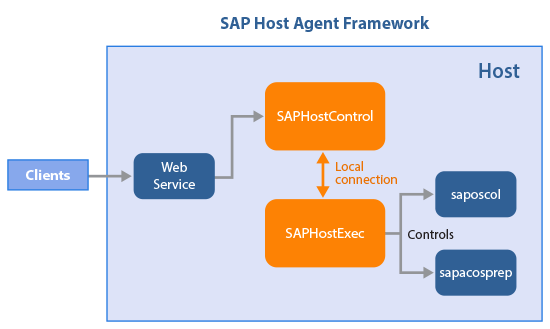
The host agent is made up of four primary parts: SAPHostExec, SAPHostControl, SAPOsCol and the sapacosprep (Figure 1). These four programs work together to provide all the features that the SAP host agent provides. The SAPHostExec executable controls all the functions of the host agent, including controlling SAPOsCol and sapacosprep. SAPHostControl is the SAP NetWeaver management agent. It is responsible for monitoring jobs on the host. It also contains the previous CCMS agent SAPCCMSR, which monitored the host. SAPOsCol is the primary component responsible for monitoring the host. Lastly sapacosprep is a program that is a part of the adaptive computing infrastructure.

Figure 1
A flow diagram of how the different parts of the host agent communicate
The host agent is not automatically updated by Solution Manager. Due to the essential part it plays in Technical Monitoring, the host agent must be updated on a semi-regular basis. I recommend you update it at least four times a year. SAP releases a new patch for the host agent about every two weeks. If you have the latest Support Package of Solution Manager installed, it is even more important to keep the host agent up to date.
There are two ways to update the host agent, automatically or manually. Once the host agents are configured to automatically update themselves, they periodically check a specific shared directory for updates. The only manual steps needed are to update this shared directory with the latest host agent patch.
To configure the host agent to automatically update itself, follow these steps. Create a shared directory on the local network that all host agents can access. Add the parameter DIR_NEW=<path to shared directory> to the each host agent profile. By default the host agents check the directory for a new patch every five minutes. To change this time interval, enter the following parameter into the host agent profile: hostexec/autoupgrade_delay=<minutes>. I recommend changing the interval to at least 1440 min, which would be every 24 hours.
If you have a large number of host agents (more than 20), then a network bottleneck or even a network outage can occur due to all the host agents calling the same file at the same time. To avoid this issue you can configure the automatic update to be at a random time interval. To configure this create a text file called .delay in the shared directory. In the text file enter the text <Value1>random-<Value2>. Value1 represents the number of minutes after an auto-upgrade is checked, and Value2 is the maximum value of minutes after which the auto-upgrade is started. The algorithm is delay = Value1 + randomValue * Value2.
Wily Introscope Enterprise Manager and Wily Introscope Agents
Wily Introscope Agents and Enterprise Manager are third-party tools that are included in the license for Solution Manager 7.1. Without both tools Technical Monitoring cannot function completely. Wily Introscope Enterprise Manager is installed on the Solution Manager host and is directly connected to Solution Manager. This installation is part of the standard configuration of Solution Manager and should be done before Technical Monitoring is configured. The Wily agents report to the Enterprise Manager. Without it the agents do not function.
Wily Introscope Agents are deployed in two ways within the diagnostics agents. Diagnostics agents are deployed with a number of applications. Some of those applications are Wily Autoprobes that collect data on all hosts and different types of applications (Figure 2). The second type of Wily Agent is the Java Bytecode Adapter. It is deployed automatically by Solution Manager while completing managed system configuration on a Java application. The Java Bytecode Adapter is only deployed on Java systems. To update the Java Bytecode Adapter, you need to patch it manually on Solution Manager. Then reexecute the Automatic activities for the JAVA stacks in Managed System Configuration. Figure 2 shows the Wily Autoprobes that exist in a Diagnostics agent.

Figure 2
Wily Autoprobes built into the diagnostics agent
Wily Introscope Agents are designed to pull data on both the host and the SAP application (Java or ABAP) installed on a host. They can also collect data on non-SAP applications. Wily Introscope Agents are especially important for Java applications. Without the Wily Java Bytecode Adapter you cannot collect data on a Java application.
Data Collectors within Technical Monitoring
In order to manage Technical Monitoring alerts, it is important to understand how the alerts and metrics work together to generate an email notification. The metric collects data on a specific area of an application and has defined thresholds. This configuration is stored in the Alerting Directory. When these thresholds are exceeded the alert sends an email notification to the email addresses defined within the alert.
Understanding where and how the data is collected is key to understanding the process. To do this you must simply take a look at the Data Collector within each metric and then analyze the parameters that have been defined by SAP. You find the data collector within the Template Maintenance step in the Technical Monitoring configuration of transaction code SOLMAN_SETUP.
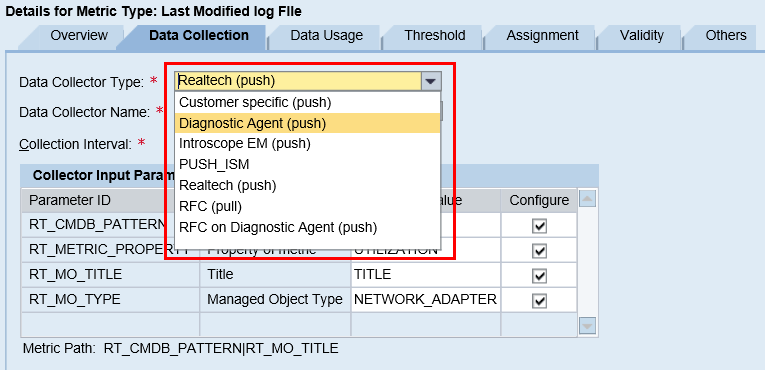
There are seven Data Collectors available in Technical Monitoring (Figure 3):
- Customer specific (push): Contains Solution Manager self-monitoring alerts. Custom data providers can be created using the Data Provider Maintenance Tool
- Diagnostic Agent (push)
- Introscope EM (push) - Wily Enterprise Manager
- Realtech (push)
- ISM_PUSH – Infrastructure Monitoring
- RFC (pull): Performed by Solution Manager
- RFC on Diagnostic Agent (push): Performed by the diagnostics agent

Figure 3
Available data collectors for metrics
Extracting, Processing, and Storing Data
The collection of data is performed by extractors. Extractors exist in a variety of locations including ST-PI, ST-A/PI, diagnostics agents, Wily Agents, and Solution Manager. Once the data has been extracted it is enriched with system details from the Landscape Management Database (LMDB).
After enrichment the data is stored in both SAP BW InfoCubes and tables within the Solution Manager database. Data is only stored in SAP BW InfoCubes if it has been determined to be relevant for reporting. The component responsible for the flow and collection of all the data used by applications in Solution Manager is called the extractor framework (EFWK). The Monitoring and Alerting Infrastructure (MAI) is the primary component that Technical Monitoring relies on to function. Both of these components work together within Solution Manager to provide a central location for managing all types of systems.
Types of Extractors
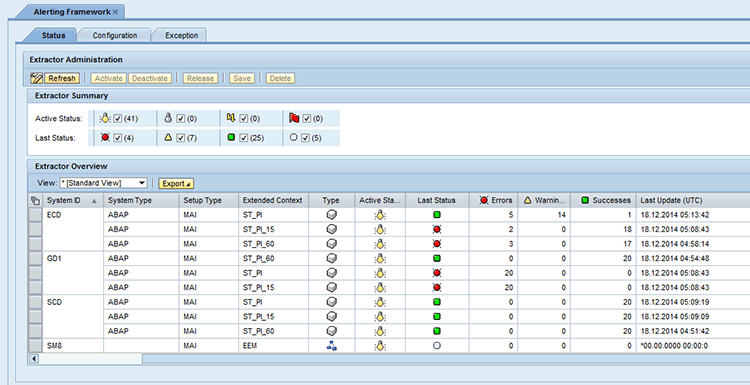
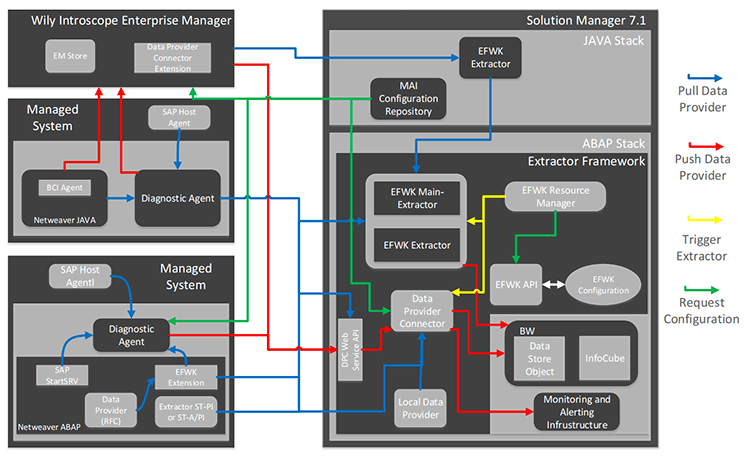
There are two types of extractors, push and pull. A push extractor automatically collects and sends data to solution manager. This autonomous action is based on predetermined configuration that is pushed out by Solution Manager. The extractors on diagnostics agents and Wily Agents are push extractors. The data from push extractors is used by the Alerting Framework (MAI). Many of the alerts within system monitoring rely on the Alerting Framework push extractors. The configuration is determined in Technical Monitoring templates. The configuration is stored in the MAI Configuration Repository and pushed out to the diagnostics agents. The push extractors can be found in the infrastructure section of the SAP Solution Manager Administration WorkCenter (Figure 4).

Figure 4
Alerting Framework management in Solution Manager Administration WorkCenter
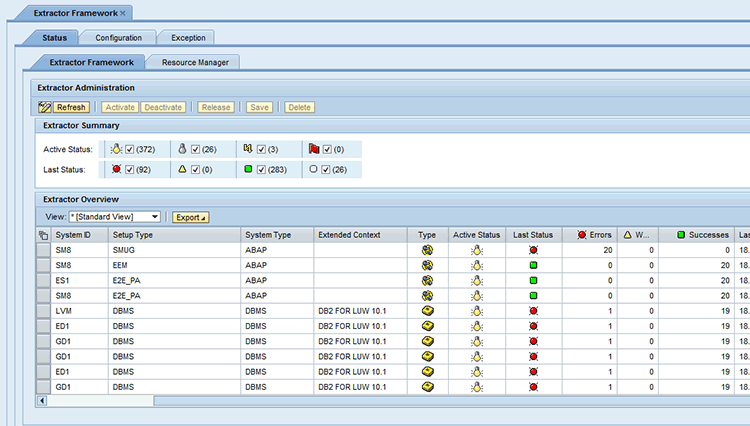
Pull extractors are triggered by Solution Manager and must be triggered each time data is to be collected. This configuration is stored in the EFWK configuration. Pull extractors collect data via RFCs in Solution Manager. Data collected by pull extractors is also used by System Monitoring. The pull extractors can be found in the infrastructure section of the SAP Solution Manager Administration WorkCenter (Figure 5).

Figure 5
Extractor framework management in Solution Manager Administration WorkCenter
You can see which data collectors in Technical Monitoring templates are push or pull. The Data Collector is labeled push or pull. Knowing how data is triggered to be sent is key to determining where to troubleshoot an issue.
Technical Monitoring is not the only tool in Solution Manager that uses the data provided by the extractor framework. Other tools that use it include Early Watch Reports, Root Cause Analysis, and Interactive Reporting. Figure 6 shows the flow of data from the Managed Systems to Solution Manager. It shows you how push and pull extractors are used.

Figure 6
Diagram showing how data flows from the managed system to the primary data processing components of Solution Manager
Triggering Pull Extractors
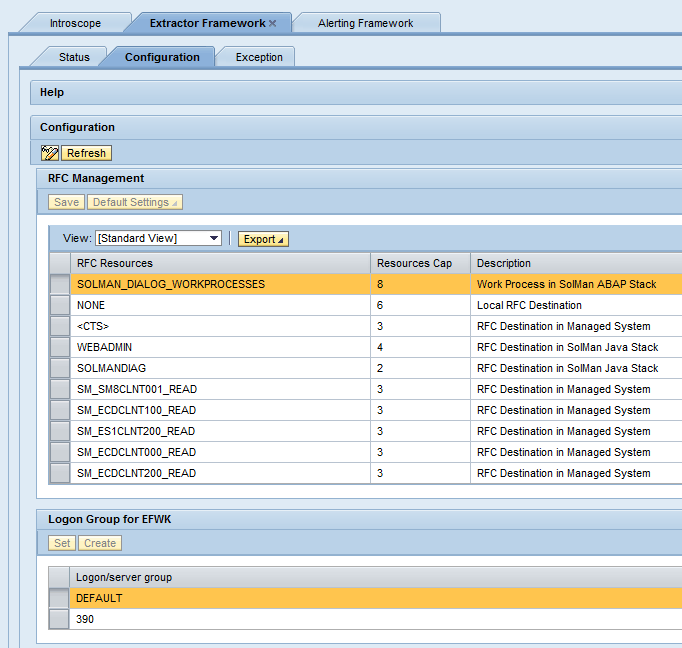
All this data collection and processing can put a large amount of load on both a managed system and Solution Manager. To handle this issue, SAP put Resource Management into place in Solution Manager to manage the pull extractors (Figure 7).

Figure 7
RFC Resource Management configuration
Resource Management restricts the number of resources available to each RFC that is used by pull extractors. This resource cap only allows a certain number of extractors that can run in parallel using the same RFC. This ensures that the managed systems are not overloaded with calls from Solution Manager.
Pull extractors are triggered by a background job called EFWK RESOURCE MANAGER that is scheduled to run every minute. The job reviews the extractors configured in EFWK to determine if the extractor needs to be triggered. If the extractor requires triggering it then reviews the settings in Resource Management and if a resource is available the extract is triggered.
Generating Alerts and Creating Notifications
The final piece to Technical Monitoring is generating an alert in the alert inbox and creating an email notification to be sent to a recipient. The Event Calculation Engine (ECE) is responsible for generating alerts and creating notifications to be sent to recipients, making it the core of the MAI. The ECE is scheduled to run as a background job every minute in Solution Manager. The ECE analyzes all the data collected by the push and pull extractors. It then compares that data to the thresholds stored in the Alerting Directory, specifically the thresholds that were determined in the metrics within the Technical Monitoring templates.
If the thresholds (yellow or red) are exceeded an alert is generated in the alert inbox. If the alert defined in the Technical Monitoring templates has notifications activated, an email notification is created for the recipient assigned to that alert. When the next SAPConnect background job runs, it sends that email to the recipient.
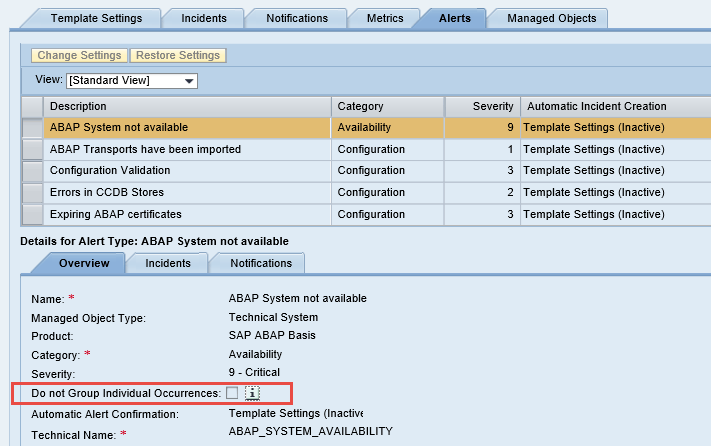
Lastly it is important to understand how Solution Manager handles alerts. By default individual occurrences of alerts are grouped together by rating (yellow or red). If multiple yellow or red alerts are triggered in succession only one email notification is sent. Solution Manager only sends out another email notification in three cases. The first is if the alert is manually confirmed in the alert inbox. In that case, a second notification is sent if the status is determined to be red the next time the ECE runs. The second case is if the status of the alert changes from red to yellow or green and then goes back to red. The third case is if the alert is configured to Do not Group Individual Occurrences (Figure 8).

Figure 8
Setting an alert to not group individual occurrences
Jereme Swoboda
Jereme Swoboda is an experienced SAP Solution Manager and NetWeaver consultant focusing on proactive technical monitoring of SAP and non-SAP systems, supporting critical business processes. He has tremendous experience pairing real-world scenarios with Solution Manager’s Technical Monitoring capabilities. He is an expert at collecting requirements, creating a monitoring strategy, and then putting that strategy to work for SAP customers. Jereme has had the opportunity to work on a variety of platforms for companies large and small integrating Solution Manager 7.1.
You may contact the author at jereme.swoboda@benimbl.com.
If you have comments about this article or publication, or would like to submit an article idea, please contact the editor.
