Manager
Learn how to set up IT Performance Reporting so that IT operations can employ a variety of useful reports and metrics.
Key Concept
The SAP Solution Manager Central Performance History (CPH) allows you to store data in the shared memory of the monitored instances longer than the maximum 24-hour limit. With the CPH, you can store data according to your reporting needs with the only limitation being disk capacity. The CPH is easily created during one step of the IT Performance Reporting setup.
SAP Solution Manager 7.0 provides infrastructure that allows you to monitor your entire IT landscape centrally and that reports problems quickly and reliably. You can centrally monitor all of your SAP and non-SAP landscapes with real-time monitoring of system components, business processes, and interfaces, which reduces administration effort.
IT Performance Reporting using SAP NetWeaver Business Intelligence (BI) allows IT operations to access different reports for a variety of reasons, including to analyze performance history, to fine tune monitoring, to provide a basis for a capacity management and resources optimization plan, and to analyze trends and forecast potential problems in the medium- and long-term regarding availability, performance, stability, and system resources.
IT Performance Reporting also provides metrics, such as SAP instances availability, dialog response times, CPU utilization, and database growth, contained in selectable reports with selectable time intervals and systems. SAP NetWeaver BI enables IT Performance Reporting in SAP Solution Manager at no extra cost. It is supported by the setup wizard and runs with a minimum total cost of operations.
I will show you benefits of the SAP Solution Manager Central Performance History (CPH). I will then teach you how to access IT Performance Reporting. Finally, I will give you step-by-step directions on how to set up IT Performance Reporting in SAP Solution Manager so that you can take advantage of all these capabilities. First, let’s look at the underlying architecture IT Performance Reporting.
Note
The configuration on which the text and figures in this article are based is SAP Solution Manager 7.0 SP15.
The Architecture That Supports IT Performance Reporting
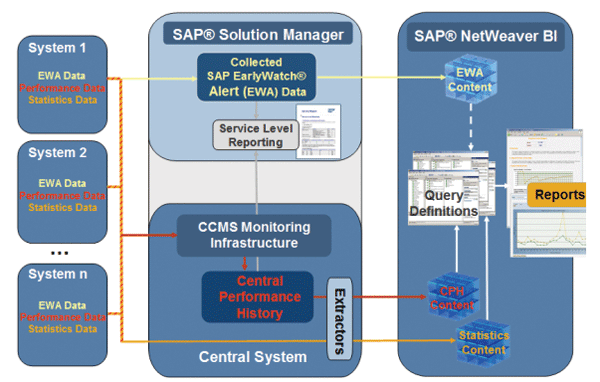
SAP Solution Manager functions as your central monitoring system (CEN). Different SAP instances and tools with SAP Computing Center Management System (CCMS) agents automatically report to SAP Solution Manager. Performance data is collected in the CPH. This data is then extracted from the CPH into BI InfoCubes using BI extractors. Once the data is loaded into BI InfoCubes, you can design different reports to consume this data (Figure 1).

Figure 1
Monitoring and IT Performance Reporting overview
SAP NetWeaver BI has sophisticated analyses and reporting features. It’s optimized for storing and analyzing large amounts of data, it is user-definable, and it supports Web-based reporting. SAP Solution Manager BI enables IT Performance Reporting based on performance data extracted from the CPH workload statistics extracted from monitored systems, which is correlated in reports for optimizing performance threshold values, analyzing the history of performance metrics, and forecasting performance bottlenecks. IT Performance Reporting makes use of CCMS monitoring architecture to extract performance data.
The CPH
The CCMS infrastructure includes the CPH, which allows you to store selected performance data from monitored components in the database of the CEN. Then you can transfer stored performance data to SAP NetWeaver BI for high-level reporting.
In the monitoring architecture, this data is stored in the shared memory of the monitored instances. Due to restricted storage space, the duration of the storage is restricted to a maximum of 24 hours. The CPH is used to store this data longer. It stores performance data in the SAP Solution Manager central database for reporting purposes that are older than 24 hours. With the CPH, you can store data for periods that you can define according to your reporting needs. Storage is limited only by disk capacity. For example, you might want to aggregate 15-minute averages to hourly averages for a particular period. If this period were 10 days, you could carry out the aggregation and create the higher-level hourly averages for that period. At that point, you can discard the 15-minute averages created during the 10-day period.
The CPH provides the following features:
- A central site for collecting and permanently storing selected performance data
- Data resolutions covering periods from one minute to one day
- Data consolidation and reorganization accessibility from your alert monitors
IT Performance Reporting
SAP delivers out-of-the-box IT Performance Reporting, which is a collection of performance reports based on the CPH as of SAP BI_CONT 703 Support Package 8. Following predefined query definitions, these reports are delivered from SAP BI_CONT 703 SP8:
- Availability of systems and instances
- CPU utilization
- Dialogue response time
- Dialogue response time distribution
- File system free space
- File system percentage used
- Free memory
- Swap-free space
- Users by client
- Workload time profile
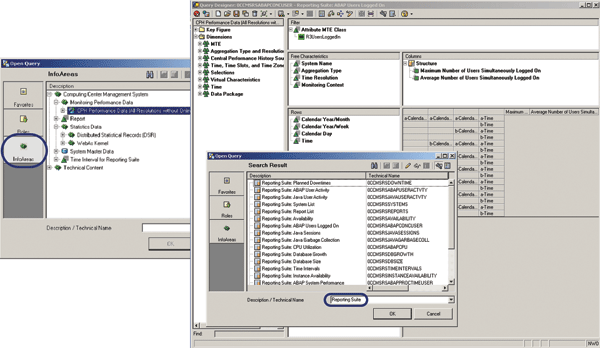
Figure 2 shows how the preconfigured business content of SAP NetWeaver BI includes a number of query definitions for performance and statistical data for your reference. The query definitions are then used to provide data in reports.

Figure 2
Sample query definitions
You can also create your own query definitions that are customized for your reporting needs. Query definitions are the data providers for reports. Reports are based on templates that contain query definitions. You create report templates with the Web application designer tool in the SAP Business Explorer tool set. For simple performance reports, you can also use the SAP NetWeaver Visual Composer tool.
There are three ways to access IT Performance Reporting in SAP Solution Manager:
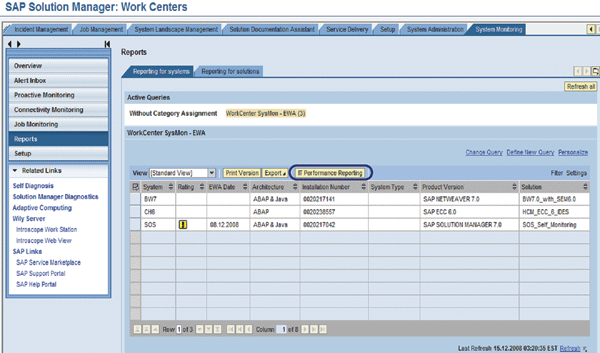
- Click the IT Performance Reporting button from work center System Monitoring of SAP Solution Manager (Figure 3).

Figure 3
Access IT Performance Reporting link via Work Center
- Use a URL link on your desktop.
- In SAP GUI, use transaction CCMSBISUITE, which calls HTML control.
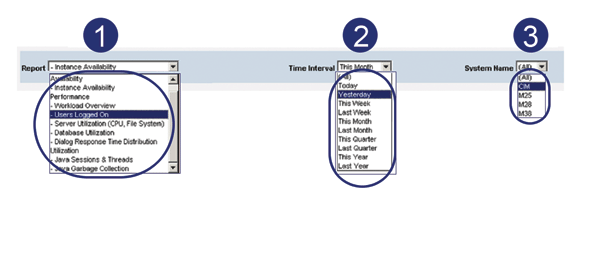
After accessing IT Performance Reporting using one of the options above, you have the following selection options: First (Report), you need to select which report you want to see; second (Time Interval), you select the time interval of the data you want to see on that report; and third (System Name), you select the SAP instances you want on the report. For the system name, you have the option to select all systems (All) or pick one SAP instance (e.g., M25) (Figure 4).

Figure 4
IT Performance Reporting selection options
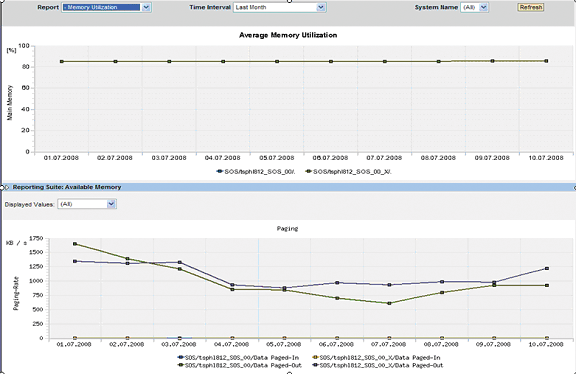
Figure 5 shows the availability of systems and instances. Figure 6 shows the memory utilization report delivered by SAP as part of IT Performance Reporting. Figure 5 shows the system availability and planned down time from CCCMS monitoring data that was extracted by CPH. This report shows correlated views between system available and downtime. Availability and downtime history data that proves predetermined service levels have been achieved.

Figure 5
Availability of systems and instances
The memory utilization report (Figure 6) can help you perform trend analyses that will tell you when problems from changes in performance values (for example, the growth of a memory usage) are about to occur so you can take preventive measures. Analyzing memory analysis reports with correlated views can also help you determine the root cause of a problem. Using the report data, you can also forecast potential capacity management and resources optimization plan.

Figure 6
Memory utilization
Step-by-Step Configuration of IT Performance Reporting
These are four steps for setting up IT Performance Reporting:
Step 1. Configure the BI client.
Step 2. Set up the CPH.
Step 3. Set dialog runtime parameter.
Step 4. Set up user authorizations.
Step 5. Verify all RFC connections are online.
Step 6. Execute IT Performance Reporting setup wizard.
Note
Your system must meet all of the following prerequisites for IT Performance Reporting to work:
SAP BI system (SAP Solution Manager)
- SAP NetWeaver 7.0
- Business Content 7.03 (or higher)
- Minimum hardware requirements: 2 CPUs and 4 GB of RAM
Source system (SAP Solution Manager CEN)
- SAP NetWeaver 7.0
- Plug-in PI_BASIS 2005_1_700
- Optional: SAP Solution Manager SPS 15, using link IT Performance Reporting
Satellite systems (monitored systems)
- Any SAP application server
- Any SAP Basis release (CCMS agents urgently recommended)
- No plug-in required
- For restrictions, see SAP Note 750805
You might also want to refer to SAP Note 1068152 – Error corrections for CCMS BI Content and SAP Note 1119686 - CCMS Reporting Suite Scenario, which might apply to your situation.
Step 1. Configure the BI client. This step involves the following three tasks:
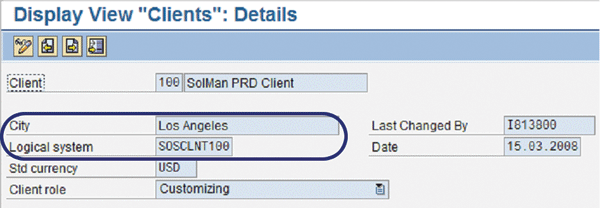
1. For BI clients, you must define a logical system name via transaction SCC4. The logical system name should follow the form {System ID}{client} (e.g., SOS for the system ID and CLNT100 for the client) (Figure 7).

Figure 7
System ID and client
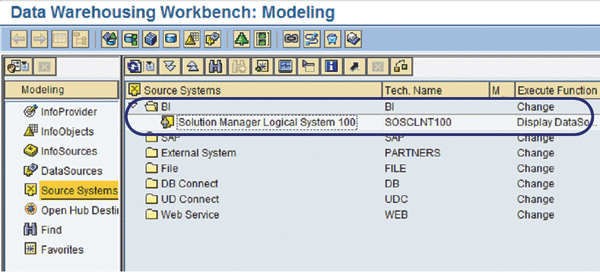
2. The MYSELF source system of BI must exist and be active. Check this via transaction RSA1. When you use transaction RSA1, the MYSELF source system is semi-automatically created, if it does not already exist. Answer Activate only to the dialog with the question "Also replicate metadata?" (Figure 8).

Figure 8
MYSELF source system
3. The technical BI content must be installed or activated. The technical content is installed automatically in the background (job BI_TCO_ACTIVATION) when you execute transaction RSA1 for the first time. You can check job BI_TCO_ACTIVATION via transaction SM37. For the other installations, you should wait until job BI_TCO_ACTIVATION is completed (Figure 9).

Figure 9
Install and activate technical BI content
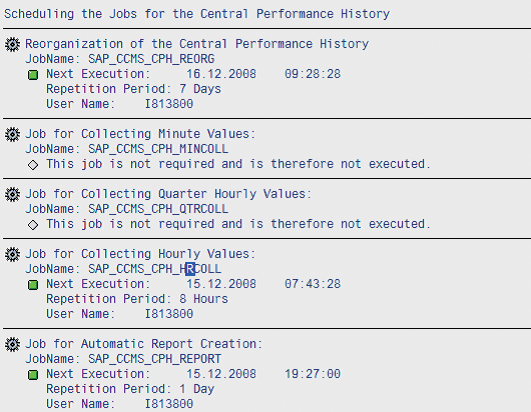
Step 2. Set up the CPH. Use transaction RZ21 and follow menu path Technical infrastructure > Central Performance History > Background Jobs. This creates jobs SAP_CCMS_ CPH_REORG, SAP_CCMS_CPH_HRCOL, and SAP_CCMS_CPH_REPORT (Figure 10). This is all that is needed to set up the CPH.

Figure 10
All the necessary jobs needed for the CPH
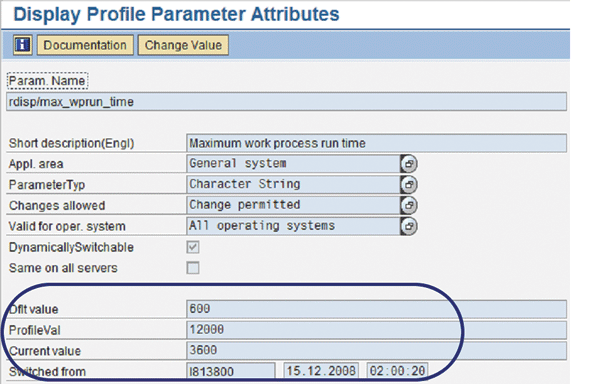
Step 3. Set dialog runtime parameter. Because the setup wizard runs dialog, parameter rdisp/max_wprun_time should be set to a sufficiently-sized value (I recommend 3600 or more). Otherwise, a TIMEOUT runtime error might occur because several of the setup steps take a long time (Figure 11).

Step 4. Set up user authorizations. Assign setup user roles SAP_BW_CCMS_SETUP and SAP_PI_CCMS_SETUP in SAP Solution Manager. I recommend creating a user (e.g., ccmsbiuser) for IT Performance Reporting to make tracking background jobs and troubleshooting issues easier.
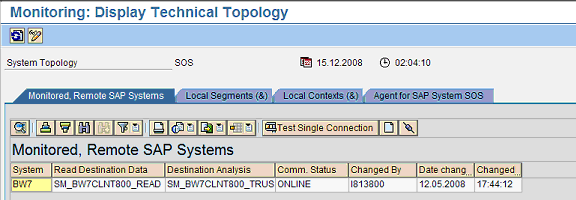
Step 5. Verify all RFC connections are online. You need to make sure that the RFC connections are online for satellite systems in SAP Solution Manager CEN. Run transaction RZ21. Select the Agents for Remote SAP Systems tab and click on the display overview. Click the Monitored, Remote SAP Systems tab and ensure that all RFC connections are online (Figure 12).

Figure 12
RFC connections are online
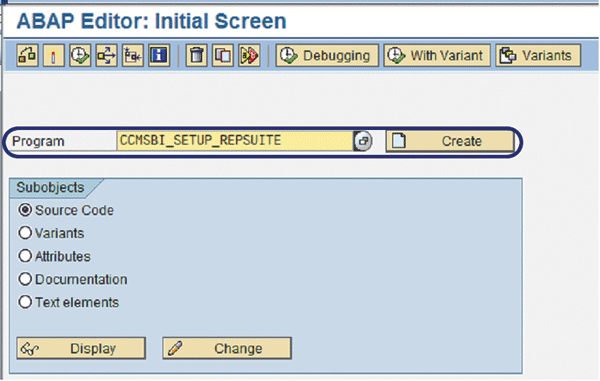
Step 6. Execute IT Performance Reporting setup wizard. Run transaction SE38 and execute program CCMSBI_SETUP_REPSUITE (Figure 13).

Figure 13
Execute program CCMSBI_SETUP_REPSUITE
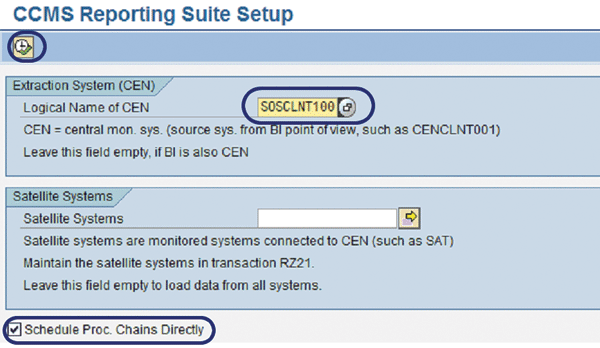
Next, enter the logical system that you configured in Step 1.1 and select the Schedule Proc. Chains Directly option so that the system knows the CEN logical name of the client (Figure 14).

Figure 14
Enter the logical name and run the setup
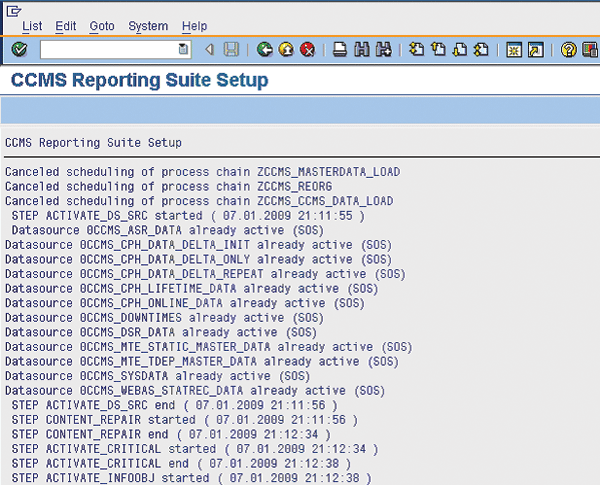
The setup wizard runs for a few minutes and then finishes with the results shown in Figure 15.

Figure 15
Setup is successfully completed
Labinot Bytyqi
Labinot Bytyqi graduated with a degree in computer science and business management and a minor in economics from George Fox University in 2005. Currently, he is pursuing a master’s degree in information technology management. Labinot joined SAP in 2007 as a technical consultant with more than eight years of information technology experience and SAP consulting, particularly in the application lifecycle management area, where he was a lead for an SAP Solution Manager and extensions practice in the West region. Labinot currently is responsible for field services software sales portfolio business development and strategy, as well as for SAP Extended Diagnostics by CA Wily.
You may contact the author at labinot.bytyqi@sap.com.
If you have comments about this article or publication, or would like to submit an article idea, please contact the editor.
