The relationship report part of the MONitoring Application (MONA) allows you to quickly display relationships among InfoCubes, queries, and workbooks. Learn how to create your own time-saving relationship report.
Key Concept
Relationships among InfoCubes, workbooks, and queries are many-to-many. For instance, workbooks often contain multiple queries and relate to more than one InfoCube. InfoCubes can contain workbooks with multiple queries. Tracking the status of queries, InfoCubes, and workbooks is an essential task that is difficult without a central monitoring system such as MONA’s relationship report.
Finding timely and important information about the hundreds of queries, workbooks, and InfoCubes that BW system administrators and BEx developers deal with each day can be a struggle. I created a tool called the MONitoring Application (MONA) to quickly display information about InfoCubes, queries, and workbooks. MONA compiles the data in a central location and provides a quick overview of what is happening in your BW system.
Workbook monitor is a part of MONA, which I introduced in my May 2005 article, “Monitor Your Queries and Workbooks.” That article explained how to create a BEx report to monitor workbooks and transports with MONA.
I’ll now describe another useful part of MONA: the relationship report. Using this report, you can find out at a glance how a query, InfoCube, and workbook are related. The relationship report shows the current status of a query, workbook, or InfoCube (Figure 1).
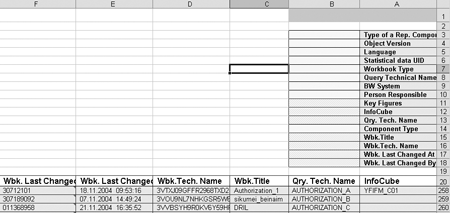
Figure 1
Completed BEx relationship report
The report can answer questions such as, “What workbook does this InfoCube belong to and what queries does it contain?” or, “What query belongs to which workbooks?” I’ll present the entire process: building an InfoSet, DataSource, InfoSource, ODS, and report.
Note
No dependencies exist among MONA’s parts, so you can pick which capabilities best apply to your situation.
This technique involves creating a generic DataSource based on an SAP query set. This process is equally suitable for building generic DataSources in the SAP R/3 system or in SAP BW system
Relationship Report
The relationship report component of MONA delivers information about the relationships among InfoCubes, workbooks, reports, and reporting components at glance. This part of MONA would be helpful for BW system administrators who are engaged in support of data uploads, transports, and report development.
System administrators often have many questions concerning the current state of a certain query/workbook/InfoCube. The relationship report is a definitive source that system administrators can consult to observe and monitor the BW system. This data cannot be found together anywhere else in the system.
The report consists of the following categories:
- InfoCube technical name
- InfoCube description
- Logon language
- InfoCube, workbook, and report versions (e.g., active, modifiable)
- Workbook technical name (ID)
- Workbook title
- Query technical name
- Type of reporting component (e.g., structure, key figure)
- Name (ID) of a reporting component
- Person who created the workbook
- Person who last changed the workbook
- Time of the workbook creation
- Time of the workbook’s last change
The steps to implement a relationship report follow:
Step 1. Create an SAP Query InfoSet to feed your DataSource.
Step 2. Create a transactional DataSource based on the InfoSet.
Step 3. Create an InfoSource based on the DataSource.
Step 4. Create update rules and ODS.
Step 5. Upload data into the ODS.
Step 6. Create a report based on the ODS.
The relationship report includes four BW-based tables: RSRREPDIR, RSRWORKBOOK, RSRWBINDEX, and RSRWBINDEXT. Each table is responsible for providing specific data, as explained in my May 2005 article. When linked, the tables give a clear picture of the relationships among InfoCubes, workbooks, and queries.
These BW-based tables in part feed standard SAP statistics InfoCubes. However, these InfoCubes contain no information about how workbooks relate to the other components (e.g., queries).
The two statistics InfoCubes mentioned above are BW Statistics — OLAP (0BWTC_C02) and BW Statistics — OLAP, Detail Navigation (0BWTC_C03). You can find documentation about their purpose and content at help.sap.com by searching for their technical names.
Step 1. Create an SAP Query InfoSet to feed your DataSource. Enter transaction SQ02 to reach the InfoSet: Initial Screen. Choose the menu path Environment>Query Areas. Double-click on Global Area (Cross-client) in the Work Areas pop-up screen (Figure 2).

Figure 2
Double-click on Global Area (Cross-client)
Go to menu path Environment>User Groups. In the User group field, type a name for the user group (YMONITORING1 in my example) and click on the Create button (Figure 3). Type the name of your user group in the pop-up window (Figure 4) and click on the Save button. You’ll receive a message at the bottom left of the screen, “User group ‘YMONITORING1’ saved.”

Figure 3
Create a user group
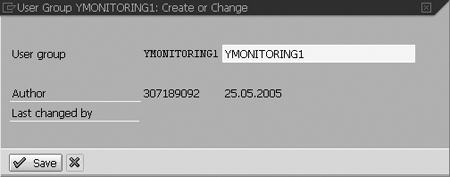
Figure 4
Enter the user group name
Choose the Environment>InfoSets menu path. In the InfoSet: Initial Screen, type a name for your future InfoSet (YMONITORING1_INFOSET in my case) and click on the Create button (Figure 5). Type the InfoSet name into the resulting InfoSet: Title and Database pop-up window (Figure 6).

Figure 5
Name your InfoSet
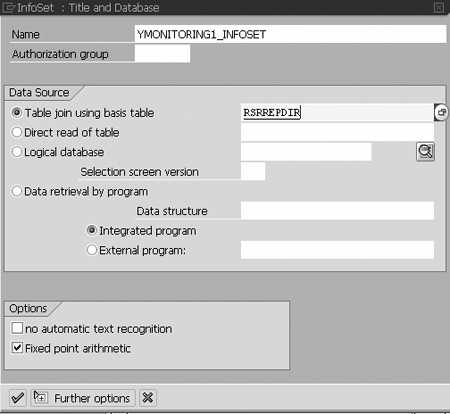
Figure 6
Define your DataSource
In the Data Source tab of this window, choose the Table join using basis table button. In this field, type the name of one of the four tables that make up the InfoSet structure, RSRREPDIR, RSRWORKBOOK, RSRWBINDEX, or RSRWBINDEXT. I use table RSRREPDIR in this case (Figure 6). Press Enter and the screen in Figure 7 appears.

Figure 7
Choose a table and begin connecting other tables
The screen in Figure 7 allows you to present the tables graphically and insert, delete, or join them by dragging a mouse from specific fields of one table to specific fields of another table.
At first, your screen will look like Figure 7, which shows only table RSRREPDIR. Click on the insert table icon or press Shift + F1 to insert the other three tables and perform joins among them. Your finished screen should look like Figure 8.
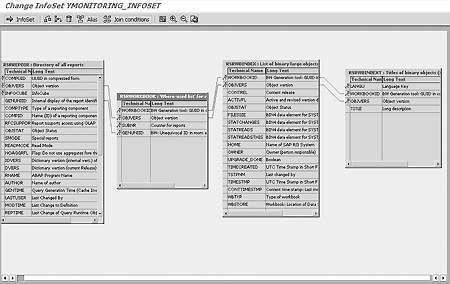
Figure 8
Graphical join options screen that shows the joins made among the tables
Click on the InfoSet button in the upper left corner of the screen in Figure 8, or press F6. This brings you to the screen containing the four chosen tables on the left and folders for the tables’ fields on the right. Each folder on the right is automatically named after one of the four tables (Figure 9).

Figure 9
Insert relevant fields into the folders in the right pane
Expand the four tables in the left pane by clicking on the right-pointing arrow to the left of each table and drag and drop to insert relevant fields presented in Figure 10 (e.g., COMPUID, WORKBOOKID, INFOCUBE) into the folders in the right pane. The final result is depicted in Figure 10.
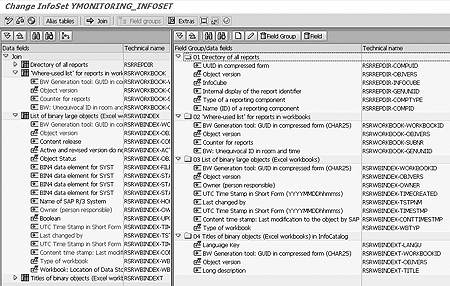
Figure 10
Resulting InfoSet
Note that the names of the fields inserted into the folders in the Technical name column on the right of both panes are expressed as TABLE-FIELD pair (e.g., RSRREPDIR-COMPUID). Later, the DataSource fields are delivered into BW and mapped by InfoObjects, as shown in Table 1. Press Shift + F6 to generate and save your newly created InfoSet. It is now ready to use in your DataSource as an InfoSet query.
| COMPUID |
0TCTSTAUID |
Statistical data UID |
CHAR |
25 |
| OBJVERS |
0TCTOBJVERS |
Object version |
CHAR |
1 |
| OWNER |
0TCTOWNER |
Person responsible |
CHAR |
12 |
| TIMECREATED |
0TCTLSTCHG |
Last changed |
NUMC |
14 |
| TSTPNM |
0TCTTSTPNM |
Last changed by |
CHAR |
12 |
| |
0TCTSYSID |
BW system |
CHAR |
10 |
| WBTYP |
ZWBK_TYPE |
Workbook type |
CHAR |
1 |
| INFOCUBE |
YWBK_ICB |
InfoCube |
CHAR |
10 |
| COMPTYPE |
YWBK_TRC |
Type of report |
CHAR |
3 |
| COMPID |
YWBK_NRC |
Name of report |
CHAR |
30 |
| GENUNIID |
YWBK_QRE |
Query technical name |
CHAR |
25 |
| SUBNR |
ZWBK_SUBN |
Counter for report |
DEC |
17 |
| LANGU |
YWBK_LNG |
Language |
CHAR |
2 |
| TITLE |
YWBK_TTL |
Workbook title |
CHAR |
60 |
| WORKBOOKID |
ZWBK_GENU |
Unequivocal ID |
CHAR |
25 |
| |
0RECORDMODE |
Update mode |
CHAR |
1 |
|
| Table 1 |
InfoObjects for the communication structure and ODS |
Step 2. Create a transactional DataSource based on the InfoSet. Call transaction SBIW and expand the Generic DataSources part of the tree. Click on the Maintain Generic DataSources entry to see the Maintain Generic DataSources screen.
Enter the name for your Generic DataSource in the Transaction data field, My_Transaction_DataSource, for example, and choose the Create button. This takes you to the next screen, Change DataSource for Transaction data: YMONITORING_INFOSET (Figure 11). Fill in all the fields as shown in Figure 11 and click on the save icon. The system then prompts you to choose a package.
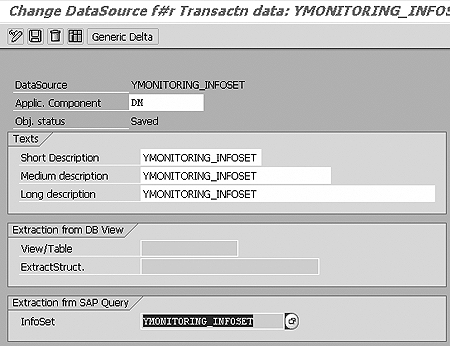
Figure 11
Enter your InfoSet in the InfoSet field of the Extraction frm SAP Query tab
Choose a package, create a change request, decide on your InfoPackage selection criteria, and save your DataSource. For more details on these steps, refer to steps 2 through 5 of the “Create Workbook Monitor” section in my May 2005 article.
Note
In BW, standard InfoObjects come with business content. You can also create InfoObjects of your own. InfoObjects that start with 0 are standard SAP objects and those starting with Z or Y are custom, created with the Data Modeler.
Step 3. Create an InfoSource based on the DataSource. Use Administrator Workbench to create your InfoSource and map the fields from the DateSource into the ODS via the transfer rules of the InfoSource. See steps 6 and 7 of the “Create Workbook Monitor” section in my May 2005 article if you need more help.
Step 4. Create update rules and ODS. You must create a number of custom InfoObjects and use a number of standard SAP InfoObjects to fill your InfoSource. See Table 1 for a description of all InfoObjects that map fields coming from the DataSource via the InfoSource to the ODS. These are the necessary InfoObjects that are responsible for data delivery from the SAP Query InfoSet to the ODS.
Using Administrator Workbench, build an ODS and create update rules based on the InfoSource you created in step 3. Steps 8 and 9 of the “Create Workbook Monitor” section in my May 2005 article provide further explanation of how to do this.
The structure of the ODS is shown in Figure 12. No code is required for this step. This makes the creation of the update rules simple and quick. Now you’re able to upload data into your ODS.

Figure 12
ODS structure
Step 5. Upload data into the ODS. Create an InfoPackage based on the InfoSource to begin the upload process.
Step 6. Create a report based on the ODS. After successful data upload, create a BEx report to use for your monitoring and control purposes. The ODS has many fields to be displayed in various reports. Figure 1 shows you how it should look. As you can see, this report allows you to understand the many-to-many relationships among InfoCubes, queries, and workbooks at a glance.
Iliya Ruvinsky
Iliya Ruvinsky is a managing partner at Skywind Consulting Ltd., Israel. He is an SAP-certified BW consultant and instructor with more than 12 years of experience working with SAP BW and SAP BusinessObjects. He is an implementation and project management expert, serving for more than eight years as a trusted advisor to a wide range of Israeli enterprises, including in the insurance, energy, sales, and logistics industries. He is a graduate of the University of Tel Aviv, Israel, holding an MBA in information systems analysis.
You may contact the author at iliya.r@skywind.co.il.
If you have comments about this article or publication, or would like to submit an article idea, please contact the editor.


