Efficient analysis of memory allocation to SAP users is really important. The utility program ESMON is all about tracking down every detail of memory that is being used. See how to analyze any memory leak or blocked memory using ESMON.
Key Concept
ESMON is the utility program that tells you every detail of memory allocated to users, with ES representing extended shared segments and MON representing monitor. You need to run command “esmon pf=<INSTANCE_PROFILE> <command line option>” as <SID>adm user. It is standard SAP functionality and works with all SAP systems running on an AIX 64-bit kernel.
Most performance problems come from memory issues. It is a common misconception that whenever any transaction runs in an SAP system, memory is mainly controlled by only two parameters — ZTTA/ROLL_EXTENSION and EM/TOTAL_SIZE_MB. This is not quite true. Although these parameters are important, you also need to be aware of additional parameters to ensure optimal memory use. You can avoid these memory issues if you know how best to use extended shared memory segments (ES) parameters.
The ES layer concept was introduced for AIX 64-bit kernels where memory allocation can be controlled at a detailed level — for example, in addition to quota, you can also control segments and memory blocks. With the ES layer implemented, you gain a lot of flexibility and control over memory allocation to the SAP system and releasing back to the operating system. One of the advantages of using the ES parameters is that they provide control over how the system uses memory, speeds up the system performance, and allocates memory to users. ES segments only disclaim memory when it is necessary to free up the physical memory.
While it is more flexible and allows more control, the ES layer is also more complex, requiring closer monitoring of its behavior during problematic situations such as an extended memory bottleneck or overconsumption of quota. That’s where the utility program ESMON comes into play: This is where you can get complete details on the behavior of memory consumption by the SAP system over the ES layer.
I’ll show you how to use this utility program to find out important system parameters and memory allocation allowing you to boost your system’s performance. I’ll finish with two case studies of scenarios in which you can identify issues with ESMON, and then adjust your processes to avoid these issues. First, let’s look at some background information on the ES layer.
Introduction to the ES Layer
With ES implemented in an SAP system running on AIX 64-bit kernel, few SAP professionals know exactly how ESMON helps you analyze the memory being used by users and applications. Before you can perform a detailed analysis in ESMON, you first need to understand the basic parameters of ES.
To activate the ES layer you need to set the parameter ES/TABLE=SHM_SEGS as shown in Table 1. You might think if the session quota is 1 GB and total extended memory of the system is only 4 GB that there can only be four users in the system. However, this is not the case because extended memory is shared memory. It is given in chunks of blocks each the size of em/blocksize_kb (by default set to 4096 KB or 4 MB, which is recommended not to be changed). So here you can say the maximum number of blocks for the system equals (EM/TOTAL_SIZE_MB)/(em/blocksize_kb), which is 1024 (4096MB/4MB).

Table 1
Important SAP memory parameters
After allocation of every 4 MB, the system has to go to the operating system to get another chunk of 4 MB, which can consume more time. Segments help avoid such issues. At the initial stage, when users start consuming memory, one segment from extended memory is given to them. This segment is allocated to the user context and if it requires more, then more segments are given to the user context. SAP parameter ES/SHM_SEG_SIZE defines the size of each segment. Therefore, each segment gets (ES/SHM_SEG_SIZE)/(em/blocksize_kb) blocks. You can see all these details — such as which SAP user is consuming how many segments or how many segments in the system are free — through utility program ESMON.
Each user context can get the maximum of ES/SHM_MAX_PRIV_SEGS segments, or you can say the maximum allocation of quota cannot be more than (ES/SHM_MAX_PRIV_SEGS)*(em/blocksize_kb). You can also limit it through parameter ztta/roll_extension. This parameter is global and applies to all the operating system to cap the user quota. However, with the ES layer you can also restrict the allocation of memory from physical memory at the operating system layer (logical assignment).
The user context can take up to the maximum number of segments per work process set in parameter ES/SHM_PROC_SEG_COUNT. You can limit the maximum number of segments by parameter ES/SHM_SEG_COUNT. SAP parameter EM/TOTAL_SIZE_MB limits the total extended memory to be used by the SAP application as discussed earlier.
In Table 1 you can see there are many parameters that begin with ES/SHM_DISC. These parameters control the disclaiming — releasing the memory that is allocated to the SAP application or user to the operating system — of the memory segments. Usually segments are allocated only once and, after being used by the users, the segments are pooled internally and are not released to the operating system again. If you now have a short period of time in which many segments are allocated but are never used again, then memory would be lost. Thus, the segments can be disclaimed back to the operating system. For more details on disclaiming, see SAP Note 856848. The ES/SHM_DISC* profile parameters control when and how much disclaiming is done.
The parameter ES/SHM_FLAGS is a bit mask (i.e., makes binary bits such as AND, OR, and XOR) that controls the kernel’s behavior in several directions. Disclaiming can be influenced here as well. SAP recommends you not change this parameter.
Some of the system segments are attached to the work processes while no user is busy in the process. They are intended to reserve the address space at the needed addresses and to prevent the operating system from using that address space for other things. They do not use real memory; they just hold address space.
ES/SHM_SYS* parameters control at the initial stage (system startup) how many segments should be allocated to the SAP application and how many should be there before returning any segments back to the operating system using disclaiming function. Figure 1 shows a graphical representation of different parts of extended memory with the ES layer implemented.

Figure 1
Parts of extended memory
ESMON
You can trigger the ESMON program only through <SID>adm through the following format:
esmon pf=<instance_profile> <commandline_options>
Table 2 shows the various command line options for ESMON and a brief description for each.

Table 2
Command line options for ESMON
Figure 2 esmon pf=/usr/sap/DX7/SYS/profile/DX7_DVEBMGS07_sapddx7 -s t;

Figure 2
ESMON with segments attached
The -s t part is an option that lists the segments with an attached state, meaning the segments are free but waiting to be attached to the user and not released to the operating system. Based on the above output, you can see that there are three such segments attached to work processes 0008, 0009, and 0009, respectively. As discussed earlier, some of the system segments are attached to the work processes while no user is currently working on the work process. They are intended to reserve the address space at the needed addresses and to prevent the operating system from using that address space for other things. They do not use real memory, they just hold address space.
After that I logged in as SAP user INVDI0 and started two sessions through transaction codes ST02 and ST04, respectively. In transaction ST02, double-click Extended Memory > Mode List (Figure 3).

Figure 3
Memory overview for user INVDI0
Now execute ESMON again with the same -s t option at the operating system level (Figure 4):
esmon pf=/usr/sap/DX7/SYS/profile/DX7_DVEBMGS07_sapddx7 -s t;

Figure 4
ESMON with segments attached after opening two SAP sessions
Figure 4 indicates the number of free system segments. As shown in Figure 2, there were three free system segments, but the moment I started two sessions from SAP ID INVDI0 (Figure 3), it occupied two of the system segments, so now only one free system segment remains.
Now you are left with only one attached segment as the other two segments are allocated to user INVDI0 for the sessions opened at the SAP level. In Figure 4, the Alloc column indicates the number of segments in use and the amount of total memory (in MB).
In Figures 2 and 4 the Used column indicates the maximum number of segments and amount of extended memory in MB used since system restart. According to these figures, you can say that the maximum number of segments in use at a given point of time is 37 and the maximum memory used is 1728 MB. Now confirm this by checking at the SAP level in transaction code ST02 (Figure 5). Check the system startup time and then check the history of extended memory by double-clicking Extended memory and clicking the history icon  (Figure 6).

Figure 5
Base screen of transaction ST02

Figure 6
History of extended memory consumption
Here you can see that since system startup on September 18, 2009, at 21:27:08 (Figure 5) the maximum extended memory used is 1769472 KB or 1728 MB (1769472 KB/1024) as shown in Figures 2 and 4.
Note
The maximum number of segments used in Figures 2 and 4 states that the amount of memory used is the number of segments multiplied by the segment size. This means that 37 segments were used and allocated, but that does not mean that all the blocks of the all the segments were used. In a given scenario, each segment has 64 blocks as the size of each segment is 256 MB (denoted by parameter ES/SHM_SEG_SIZE) in Table 1 and the block size is set to 4096 KB (or 4 MB) denoted by parameter em/blocksize_kb in Table 1, so the number of blocks in each segment is 256 divided by 4, equaling 64 blocks.
You can get a more detailed overview of the ES layer when you trigger the ESMON program with command line option a:
esmon pf=/usr/sap/DX7/SYS/profile/DX7_DVEBMGS07_sapddx7 –a
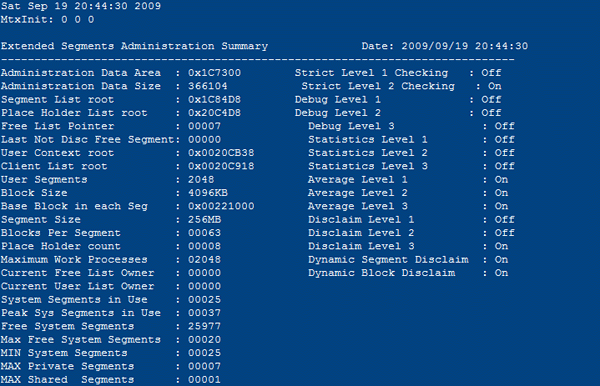
In Figure 7, the value for block size is 4096 KB, which comes from parameter em/blocksize_KB. The value for the Segment Size is 256 MB, which comes from parameter ES/SHM_SEG_SIZE. Values for User Segments and Maximum Work Processes comes from parameters ES/SHM_SEG_COUNT and ES/SHM_USER_COUNT, which gives you the maximum segments allocated at single point of time and maximum number of users it can handle.

Figure 7
ESMON with option -a
Check the values for these parameters in Table 1.
In Figure 7 you can also see Peak Sys Segments in Use and System Segment in Use, which refer to the high-water marks discussed earlier. Values for Max Free System Segments corresponds to parameter ES/SHM_SYS_FREE_MAX, MIN System Segments corresponds to parameter ES/SHM_SYS_INIT_SEGS, MAX Private Segments corresponds to parameter ES/SHM_MAX_PRIV_SEGS, and MAX Shared Segments corresponds to parameter ES/SHM_MAX_SHARED_SEGS.
Check the value for Blocks Per Segment, which shows 63. However, according to my calculation it came to 64 earlier. This is because the block count starts from zero, so it makes one extra block.
The User Segments value is simply the maximum number of segments that can be provided to users. The system segments information is about the segments that have been allocated from the operating system. As mentioned earlier, the segments are allocated from the operating system and disclaimed back to the operating system. The Free System Segments number is the number of segments that have been allocated from the operating system and have been freed in the meantime. For performance reasons, they have not been given back to the operating system but put into a pool for reuse. As mentioned earlier, the place holder is attached to the work processes while no user is in the processes. This is a system segment as well, but just one of them. You can say User Segments is a logical segment entry in the kernel internal segment administration table. System Segments are the segments that have been allocated from the operating system (via shmget, check AIX documentation for more details).
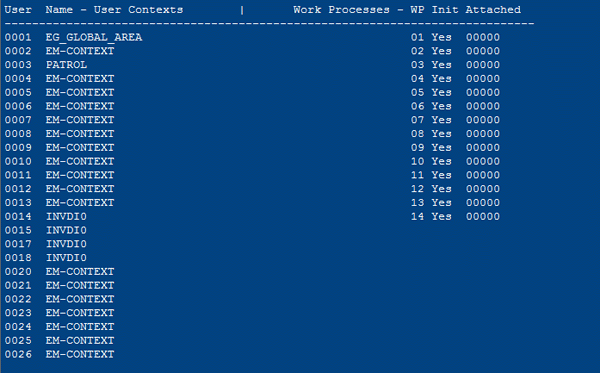
Figure 8 lists users who are using system segments currently.

Figure 8
ESMON with option -a: users using system segments
When the EM user context is created the kernel does not yet know the user name. Thus the context is created with the name EM-CONTEXT. No one ever implemented to set the correct user name with the ES-segment. When the user needs further segments (i.e., when a second mode is opened), then the correct user name is known and is passed to the ES layer. Now let’s look at some more ESMON information with option -a in more detail.
Memory Usage
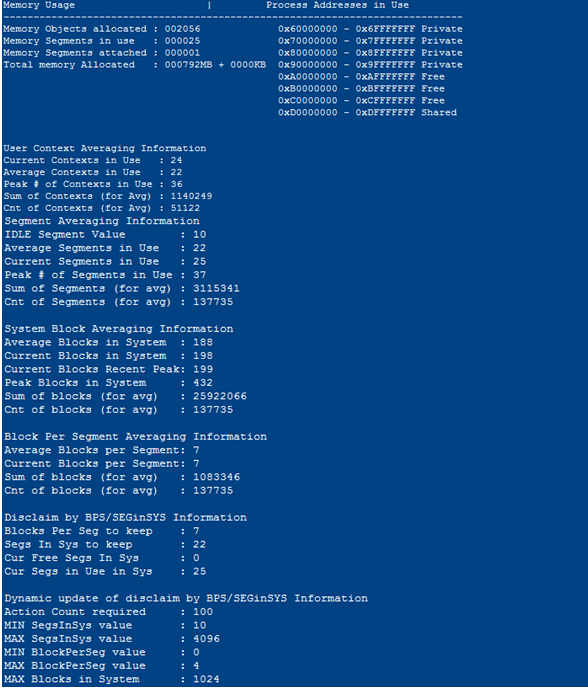
In Figure 9, the Memory Objects allocated line states the maximum numbers of segments that can be allocated to the system. This value always shows (ES/SHM_SEG_COUNT) + (ES/SHM_PROC_SEG_COUNT), so in this example, 2048 + 8 = 2056.

Figure 9
ESMON with option -a: memory usage
This happens because one context is always reserved for EG_GLOBAL_AREA as shown in Figure 8. Then Memory Segments tells you the number of segments allocated at the current time. Now check the value for Total memory Allocated, which equals 792 MB. This matches the value for Curr Use for extended memory in Figure 5, which shows 811008 KB or 792 MB. Then check the value for Current blocks in System in Figure 9, which shows 198. This is equal to 792 when you multiply by four (because each block is 4 MB in size).
Process Addresses in Use
You can see there are eight entries under Process Addresses in Use. The first seven entries are for seven segments defined by parameter ES/SHM_MAX_PRIV_SEGS, and the last entry is defined for the shared segment for the contexts as defined by parameter ES/SHM_MAX_SHARED_SEGS. It states that these segments will use address spaces from 0x60000000 to 0x6FFFFFFF for the first segment of every context, then 0x70000000 to 0x7FFFFFFF for the second segment of every context and so on until 0xD0000000 to 0xDFFFFFFF for the shared segment.
User Context Averaging Information
Compare the values for Average Contexts in use with Average Segments in Use, and Peak # of Contexts in Use with Peak # of Segments in Use in Segment Averaging Information section of Figure 9. The Segments value is one more than Contexts (37 to 36). From this, you can make two conclusions:
- It is one less, as the Context for EG_GLOBAL_AREA does not reflect in context information, but it always reserves a segment, which reflects in the segment information
-
None of the user contexts have consumed more than one segment since system restart as values for contexts and segments correspond to each other if you remove the value for EG_GLOBAL_AREA
System Block Averaging Information
This section gives you the information at the block level. You have already compared and checked the value for Current Blocks in System. Now let’s compare the value for Peak Blocks in System, which is 432, or 1728 MB (432 * 4 MB). This is the same as the maximum value shown in Figure 6 since the system restart was performed as shown in Figure 5. Then Average Blocks in System states that the average number of blocks being used by the system and information in Blocks Per Segment Averaging Information gives you the average number of blocks being used in a single segment.
Disclaim By BPS/SEGinSYS Information
This section gives information on disclaiming values, and the value for Blocks per Seg to keep tells you how many blocks per segments are being used on average and are not being given back to the operating system. In the same way, Segs in Sys to keep tells you the average of how many segments are being used and after averaging them how many segments are not to be released to the operating system. Cur Free Segs in sys tells you the number of segments left in the system or system segments to be reused by new contexts. Cur Segs in Use in Sys states the number of segments being used currently.
Dynamic update of disclaim by BPS/SEGinSYS Information
This section gives you the following information:
1) Action Count required: Number of segment operations before averaged disclaims start; corresponds to SAP parameter ES/SHM_DISC_SEG_INIT_CNT
2) MIN SegInSys value: Minimum number of segments that should not disclaim blocks in; corresponds to SAP parameter ES/SHM_DISC_SEG_MIN
3) MAX SegInSys value: Maximum number of segments that should not disclaim blocks in; corresponds to SAP parameter ES/SHM_DISC_SEG_MAX
4) MIN BlockPerSeg value: Minimum blocks to not to be disclaimed; corresponds to SAP parameter ES/SHM_DISC_BLK_MIN
5) MAX BlockPerSeg value: Maximum blocks to not to be disclaimed; corresponds to SAP parameter ES/SHM_DISC_BLK_MAX
6) MAX Blocks in System: Maximum blocks that can be allocated to the system. You can get this value by dividing parameter EM/TOTAL_SIZE_MB by (em/blocksize_kb/1024), which means you’re dividing the total extended memory by the size of each block. In this case, it would be 4096 / (4096/1024) = 1024 blocks.
Now I’ll show you a case study to give you a clearer view of how to use and analyze the information provided by the utility program ESMON.
Case Study 1
I’ll start by defining the problem and settings and then move into the sample analysis and solution.
Problem Definition
Most of the work processes are going into PRIV mode because end users started using heap memory with extended memory still available, which resulted in blocking the work processes until the entire task is finished. Blockage of many work processes leads to a performance problem.
Memory Parameter Settings
- EM/TOTAL_SIZE_MB: 59392
- ES/SHM_SEG_COUNT: 6144
-
ES/SHM_SEG_SIZE: 256
Analysis
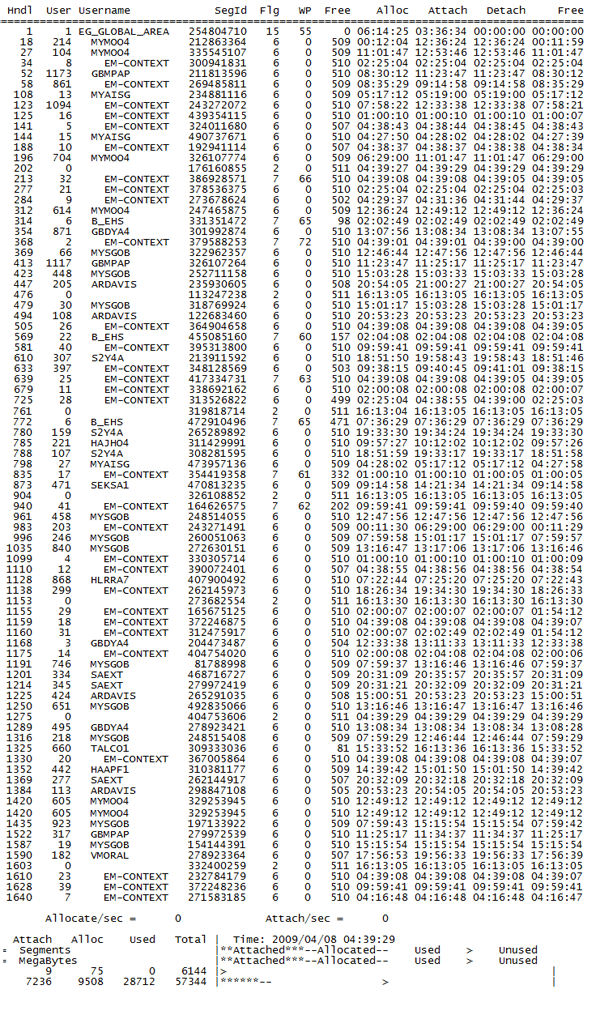
There are 6144 segments with the segment size of 2048 MB, which gives more than 1 TB worth of segments for extended memory, but can take up to only 58 GB as per the extended memory parameter. In transaction ST02, maximum utilization of extended memory has only reached 29 GB. Figure 10 shows several outputs of ESMON with -a and -b options.

Figure 10
ESMON outputs
After monitoring this information for a couple of days, we were able to see how many cases existed where memory was allocated to the users but was not freed up after successful completion of transactions (Figure 11). The Used column shows the high-water mark for the maximum number of segments allocated to the system and total memory. Total Memory is fine but for Segments it shows 0, which means no segments were ever allocated to the system since application startup, which is not possible. This is yet another sign of improper work of ES segments.

Figure 11
Memory and segments attached to users

Figure 12
Check the memory consumption
- USSAG1
- GBNBEE
- GBWWI6
- GBNLO2
- OSEFR1
- DESPE1
Now check the list of users that came in the output of ESMON (Figure 13).

Figure 13
Segment allocation to SAP users
None of the users that are using heap memory as shown in the SM04 list turn up in the ESMON output, which shows segments are allocated to these users but not released properly as memory is still blocked as shown in SM04.
From all these examples, you can see that there are segments allocated to the system but not released after its work was completed. There is no way to find exactly where the segments went.
Based on the error ERROR => SHM2_EsCreate: esSHMAddPrivSegment(,userID=878) returned 7 (as recorded in WP trace files) it is clear that users are not able to get more segments from private segments, which are set for the quota. This resulted in WP switching to PRIV mode.
Note
PRIVATE SEGMENT had nothing to do with PRIV mode or heap memory. Parameter ES/SHM_MAX_PRIV_SEGS defines the maximum number segments for a single user context.
Solution
As ESMON has helped you find out the exact cause of the problem, which refers to invalid references for SAP users, you need to stop the SAP system and run the slibclean command. This removes unused modules from the kernel and library memory. You can then start the SAP system up again.
Case Study 2
Now let’s look at another example. I’ll start by defining the problem and move on from there.
Problem Definition
Two SAP systems (BPI and CPI) are running on the same host (sapdr3). There is a high amount of swapping (i.e., high paging activity) noticed on the host, which affects the performance of both SAP systems.
SAP System Configuration
Using transaction code ST06 to find out how much physical memory is available for the host, you can see that there is 39321600 KB (37.5 GB) (Figure 14). You can also see that there is approximately 46 GB of paging activity occurring in the host by subtracting the Free in swap-space value (45934928 KB, or roughly 43.8 GB) from the Actual swap-space value (94699520 KB, or 90 GB).

Figure 14
Physical memory details in transaction code ST06
Memory Configuration for SAP System BPI
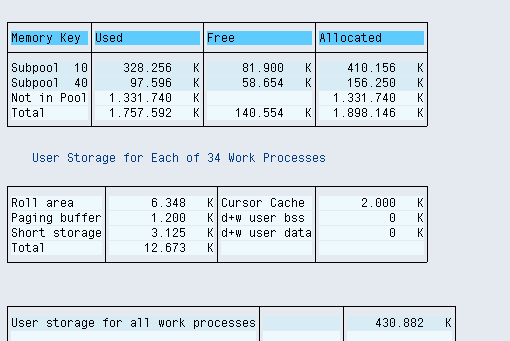
Use transaction code ST02 and follow Detail Analysis Menu > Storage (Figure 15). The memory configuration for shared memory and work processes equals the Total amount in the Allocated column (1898146 KB), plus the User storage for all work processes value (430882 KB), for a total of 2329028 KB (or roughly 2274 MB). You’ll need this value in a minute.

Figure 15
Memory details for work processes and shared memory

Figure 16
History of extended memory consumption
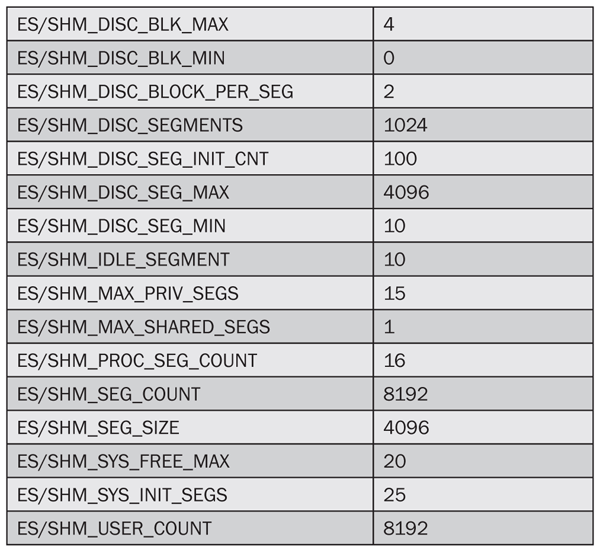
As a reference, you can see some important ES layer parameters set in the system in Table 3. You’ll also need these later.

Table 3
ES layer system parameters
Oracle Memory Configuration for SAP System BPI
Use transaction code ST04 and follow Performance > Additional Functions > Database Parameters on the left (Figure 17). You can see that the parameter value for sga_max_size is 8254390272 bytes, or 7872 MB.

Figure 17
SGA max size in transaction code ST04
SELECT ROUND ((VALUE/1024/1024),2) PGA_Allocated_in_MB FROM V$PGASTAT WHERE NAME = 'total PGA allocated';
In the resulting screen, you can see that the PGA used (rounded) is 348 MB (Figure 18).

Figure 18
Total PGA allocated
Memory Configuration for SAP System BPI
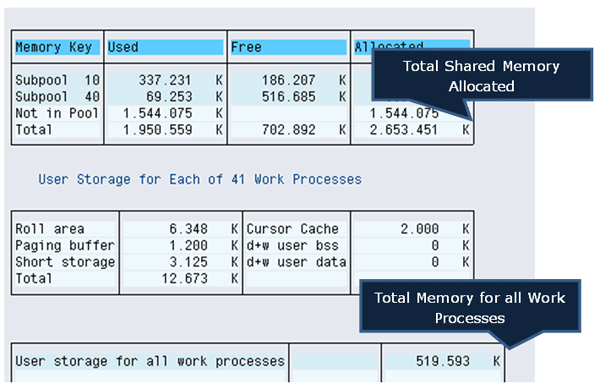
Use transaction code ST02 and follow Detail Analysis Menu > Storage (Figure 19).

Figure 19
Memory details for work processes and shared memory
Then go to transaction code ST02 (Figure 20). In the Extended memory row under In Mem [KB], you see the value 7086000. This is the extended memory set by parameter EM/TOTAL_SIZE_MB.

Figure 20
Extended memory
Table 4
Table 4
Important ES layer parameters set in the system
Oracle Memory Configuration for SAP System CPI
To see the SGA max size from PL/SQL, enter “show parameter sga_max_size” as shown in Figure 21. The SGA max size here is 3456 MB. To find the current usage of Oracle PGA enter the following query in the PL/SQL prompt at OS level:
SELECT ROUND ((VALUE/1024/1024),2) PGA_Allocated_in_MB FROM V$PGASTAT WHERE NAME = 'total PGA allocated';

Figure 21
SGA max size and total PGA allocated
Total Memory Requirement for SAP System CPI
You use the numbers you’ve found in these sections to get the total memory requirement for SAP system CPI: Add 3098, 6920, 3456, and 170 for a total of 13644 MB. Then to get the total memory requirement for SAP instances CPI and BPI, combine 13644 with 23326, which equals 36970 MB, or roughly 36.1 GB.
Analysis
If there is already 37.5 GB of physical memory and the memory requirement is only 36 GB, there is still high paging activity noticed in the system. Look at the ESMON output for BPI in Figure 22.

Figure 22
ESMON output for BPI
Currently, each segment’s size is 4096 MB (4 GB), as set by SAP parameter ES/SHM_SEG_SIZE. Hence, you can see that SAP instance BPI is unnecessarily blocking 28 GB (4 GB multiplied by 7) of physical memory. As the extended memory parameter is also not set by default, it takes extended memory as 256 GB (SAP default value). Therefore, there is almost no restriction on the use of extended memory and, with the ES layer on, it won’t even release memory back to the operating system as parameter values are too high.
In this case, SAP application BPI might perform very well but the SAP application for CPI and the Oracle application for both systems have to go through a high paging activity as physical memory is blocked from SAP application BPI. This affects the overall performance of both instances.
Solution
There are two key takeaways from this analysis. You can set the parameter for extended memory (EM/TOTAL_SIZE_MB) based on your actual usage, which you discovered via ESMON. You can also reduce the size of segments (i.e., decrease the value for SAP parameter ES/SHM_SEG_SIZE to a reasonable size such as 256 MB) so that even if few segments are reserved by the SAP instance it will not block too much physical memory.
Vipul Shah
Vipul Shah has a master’s degree in software engineering from BITS Pilani, India, and was an SAP Basis consultant and team lead for incident, change, and problem management. He started his career at Wipro Technologies as an SAP Basis consultant and was part of two implementation projects and a performance analyst for five different support projects. He also implemented Sarbanes-Oxley compliance for a Basis project with the ITIL process and ISO 20K standards. He has also achieved his certification in end-to-end root cause analysis from SAP.
You may contact the author at vipul.dineshshah@gmail.com.
If you have comments about this article or publication, or would like to submit an article idea, please contact the editor.


