A good conceptual understanding of the Flexible Planning component of SAP Sales and Operations Planning (SAP SOP) helps reduce the number of cyclic iterations in Information Structure configurations and test its impact on the planning type before choosing the final design. Learn the necessary steps to configure Flexible Planning in your SAP system, including configuring a self-defined Information Structure and a planning type and testing planning to verify the accuracy of the design.
Key Concept
You can plan and process planning data from the standpoint of practically any organizational unit, such as Sales Organization or Production Plant, using the Flexible Planning functionality of SAP ERP Central Component. The starting point of Flexible Planning is designing an Information Structure. An Information Structure defines a structure with organizational units, business planning values (for example, forecast values in different periods), their relationships, and different views of planning values from different departments’ perspectives, such as Sales or Production. Knowing how to define an Information Structure to meet business planning requirements is vital for successful Flexible Planning.
Instead you can use SAP’s Flexible Planning method to forecast demands from different sales offices to get, for example, the total manufacturing plant demand. In that case, Flexible Planning allows you to forecast a sales office’s individual demand or a manufacturing plant’s total demand in a planning table. Flexible Planning uses a hierarchical structure of organizational elements for planning called a planning hierarchy, which is master data created for the Flexible Planning application requirements.
In this article, I use an example case to explain the steps you need to take to implement Flexible Planning. After gaining an understanding of the basic Flexible Planning design method, you can then explore additional functionality required for their specific application and incorporate them as required.
A Flexible Planning table is designed using the basic steps of configuring a self-defined Information Structure, setting the parameters for the Information Structure and key figures, and configuring the planning type. With a clear understanding of these steps, you can test the planning table design for validating the Flexible Planning functionality. Any modifications may require logically thinking through the changes required and revisiting the configuration in the right order to make the changes. Repeated tests and modifications may be required until the desired design is achieved.
Note
Planning type configuration provides planning table layout and controls how planning values are interrelated with organizational units.
You can attempt other functionality not included in this article once the basic Flexible Planning table is working as expected, such as event creation and aggregating and disaggregating plan values using proportional value maintenance at different planning hierarchy levels. For aggregating plan values, the system would cumulate values from lower levels and populate this total value automatically for the higher level. As an example, if you enter forecast values for two different sales organizations in the planning table and use aggregation functionality in the planning table, the system would populate the forecast value for the division. Disaggregation does the opposite.
After you finalize the conceptual design of Flexible Planning, you configure the system and test data to verify the results. In this article, I’ll provide the basic steps to configure and test Flexible Planning in your SAP system, including:
- Configuration of an Information Structure
- Configuration of a planning type
- Testing the planning table
Configuration of an Information Structure
The configuration of an Information Structure requires the following activities:
- Maintain a self-defined Information Structure: Definition of the Information Structure; maintenance of characteristics and key figures
- Set parameters for the Information Structures and key figures: Maintenance of relevant planning parameters and indicators of the Information Structure
Figure 1 shows an example scenario to carry out Flexible Planning for forecasting product demand for different sales offices and a manufacturing plant.

Figure 1
A Flexible Planning scenario that shows planning for demand from different organizational units
My example carries out planning for the following planning hierarchy: Sales organization > Distribution Channel > Division > Sales Office > Material > Plant (Figure 2). These represent the characteristics of Flexible Planning. In this example, the forecasting is done in only one currency (USD). Note that each sales office may have its own forecast demand and the manufacturing plant would cumulate them to arrive at total demand. Also note that Plant must be below Material in the hierarchy.

Figure 2
Planning hierarchy for this example scenario
Let’s assume the planner needs to view the following key figures in the planning table:
- Own non-SAP Forecast — Forecast done by the forecast owner outside of the SAP system
- SAP Forecast — SAP forecast carried out in the planning table
- Previous Year Actual Sales — This is a standard planning line provided by SAP
- Actual Sales — This is a standard planning line provided by SAP
- Adjustment — This is the manual changes to be incorporated to the forecast
- Adjusted Forecast = SAP Forecast plus or minus Adjustment — algebraic sum
- Sales Price Average $ — This is a manual input
- Forecast Value Total $ — Forecast Value = Adjusted Forecast * Average Sales Price
- Production — The calculated production quantity. This is passed to Demand Management.
Maintain Self-Defined Information Structure
Now I am going to walk you through the first step in Configuration of Flexible Planning: how to maintain a self-defined Information Structure.
Follow IMG menu path Logistics-General > Logistics Information System (LIS) > Logistics Data Warehouse > Data Basis > Information Structures > Maintain Self-Defined Information Structures or use transaction MC21 to create and maintain a self-defined Information Structure.
Note
Creating an info structure and planning type may be an iterative process since it could involve changing field values and verifying the effects in other configuration steps. Therefore, it is good to know the configuration transactions for faster access to the configuration screens.
The first activity in maintaining a self-defined Information Structure (the custom Information Structure definition is technically called a self-defined Information Structure) is naming it. As per SAP naming convention, the Information Structure must be named SXXX where the value XXX must be between 500 and 999. In my example, the name is S599.
Enter the parameters as shown in Figure 3. I chose the application 41 for this example but you can choose other appropriate values. Press Enter.

Figure 3
Initial screen for creating Self-Defined Information Structure
In the next screen, click the Choose Characteristics button on the screen (not shown here) to select the characteristics required for defining the Information Structure. From the pop-up window of Characteristics Field catalogs, double-click SD: Sales organization (order) from the list of field catalogs, as shown in Figure 4.

Figure 4
Characteristics Field catalogs available for selecting the required characteristics
Select the characteristics checked off in Figure 5 one by one using the Copy button. Then click the Copy + close button. The selected characteristics are copied to a temporary area in the screen window.

Figure 5
The characteristics selected from the characteristics catalog and copied over to a temporary area
Note
Different characteristics are logically grouped under different catalogs for different business applications. The catalog I used in Figure 4, SD: Sales organization (order) Characteristics, is an example that shows the organizational units included in a sales order. If you need a set of characteristics for your self-defined Information Structure, you may need to access more than one catalog. It may not be obvious which catalog holds which characteristics. Look for catalog names that indicate that the characteristics you want may be available within.
Next, access a different catalog to select the remaining two characteristics: Material and Plant. Use the Selection list button to call up the list of catalogs. For my requirement, select the catalog SD: Article (Order), which contains the characteristics Material and Plant. Copy the two characteristics (Figure 6). Click the Copy + close button. The two characteristics are now copied to the temporary area where you copied the four other required characteristics from the previous catalog.

Figure 6
Copying the characteristics Material and Plant from the field catalog to a temporary area in the screen window
Click the Copy button provided at the bottom of the temporary area screen window to copy all the selected characteristics to the Information Structure. This completes the selection of all required characteristics for the self-defined Information Structure.
Note
While the characteristics represent the organizational structure, the key figures represent the key operating measures used in the planning process. Thus, Sales Organization and Plant are characteristics and Forecast values, Production values, and Stock values are key figures.
Using a similar procedure, copy the key figures into the Information Structure. Applying the same logic that you used for identifying characteristics in a catalog, look for the probable key figure catalogs for the key figures you want. Copy the required key figures into the Information Structure in the same way you copied characteristics earlier. The suitable catalogs for the requirements are:
- Sales, production, stock level, and target stock level (found in the Key Figures: SOP catalog)
- Net price and net value (found in the SD: Values, prices (order) catalog)
Note
Make sure that Net price is selected first followed by Net value when copying key figures into the Information Structure. The order of key figures in the Planning table is important. As you will see later in this article, you do a calculation by multiplying the Net price planning line with the quantity line to get the Net value planning line values for all periods. For this reason, you need to see the Net price line above the Net value line in the Planning table layout. If you copy key figures to the Information Structure in the correct order, this aspect of the Planning table layout is taken care of automatically.
If the Information Structure for Flexible Planning requires custom key figure fields created for specific customer systems, a custom key figure catalog to be created first to use them in Information Structure. Follow configuration path Logistics general > Logistics information system > Logistics data warehouse > Data basis > Field catalogs > Maintain self-defined field catalogs to maintain custom key figure field catalogs.
The complete selection of key figures for my example is shown in Figure 7.

Figure 7
Copy the key figures Net price and Net value from field catalog to a temporary area in the screen window
Copy all selected key figures to the Information Structure using the Copy button at the bottom of the temporary area of the screen window. This automatically copies all selected key figures to the main self-defined Information Structure maintenance screen. The Information Structure, with all selected Characteristics and Key Figures, now looks like the screen in Figure 8.

Figure 8
All required characteristics and key figures I’ve selected from catalogs and copied to the Information Structure
Click the generate icon highlighted in Figure 8 to generate transparent tables of the Information Structure S599 in the background. The system creates two tables, S599 and S599E, and the log is displayed (Figure 9).

Figure 9
The log displaying generated Information Structure tables information
Verify that tables S599 and S599E exist in the system using transaction SE11. Click the save icon.
Set Parameters for the Information Structures and Key Figures
Now that you have created the Information Structure in the system, you need suitable parameter values in the Information Structure to support planning. These parameters would, for example, help identify the factory calendar to be used in planning or performance improvements in the planning run. Follow IMG menu path Logistics-General > Logistics Information System (LIS) > Logistics Data Warehouse > Planning > Master Data > Set parameters for info structures and key figures or use transaction MC7F to open the Info Structure planning parameters maintenance screen.
Select the Information Structure S599 and choose the detail icon . Enter the required parameter values and set the indicators you would like to include for the Information Structure planning (Figure 10). Press F1 to use field input help documentation that explains the significance of the fields and indicators. Select the Planning method value K (consistent planning). This is because consistent planning automatically cumulates planning values from the lower levels of the hierarchy to get the next higher level planning value in the planning table. For example, the system would cumulate the forecast values from sales offices to get the forecast value at the division level automatically. If the value I (level-by-level planning) is used, you have to define a macro and do this manually in the planning table.

Figure 10
The detail screen to maintain Information Structure planning parameters
As shown in Figure 10, the Key-figure-restricted DB update: off indicator is selected because in our example, only one planning type is used for the Information Structure. If two planning types are used, the system needs to support updating two planning type values that use the same key figures from the same Information Structure tables. If you switch this indicator off, the system no longer looks for this functionality and you’ll see an improvement in system performance.
By using the Capacity figure field value PRODU, the user can work with production line values from the planning table while carrying out rough cut capacity planning. Similarly, by using the Figure to Dem. Mgmt field value PRODU, you ensure that the system uses the production line values while transferring the planned values to demand management.
Note
You can perform rough cut capacity planning in a planning table to see if the planned forecast values are within the constraints — for example, available capacity at a critical work center. If they aren’t, you can adjust the planned forecast values until the capacity load value is shown within permissible limits. For rough cut capacity planning, you use the production quantity from the planning table. The system selects the production quantities of different periods from the production planning line in the planning table to calculate the capacity requirement and display the capacity load as a percentage value.
For this example, you do not need new key figures. The existing key figures from the Information Structure are displayed as default, as shown in Figure 11. Click the save icon. This completes the configuration for the Information Structure.
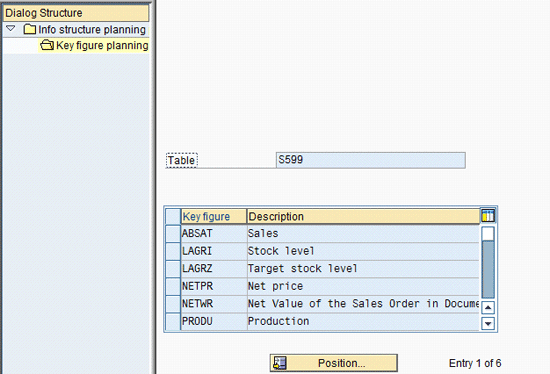
Figure 11
Displaying the key figures copied automatically from the Information Structure
Configuration of a Planning Type
Next, I will design a planning type using this Information Structure for the planning table used in Flexible Planning. Follow IMG menu path Logistics-General > Logistics Information System > Planning > Tools > Maintain planning types or use transaction MC8A to create the planning type (Figure 12). Enter a name starting with Y or Z as per SAP’s naming convention requirement and press Enter. Enter the Information Structure for the planning type.
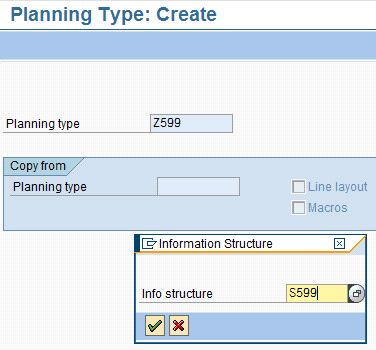
Figure 12
Initial screen for creating a planning type
The system pops up a screen in which you can enter header details (Figure 13). For this example, I’ve selected a historical period of 24 and a future period of 12. Accordingly, the planning table shows 24 periods from the current period extending backward and 12 periods extending forward in the planning table. Select the Aggr. planning indicator to get multiple objectives — for example, improved performance from the aggregation of planning values at the database level first before transferring to the application layer (instead of aggregation after transferring to application layer) and planning hierarchy drill-up and -down capabilities. The details of this functionality are given in the F1 help for the indicator. Select the Detailed selection indicator, which enables you to enter a range of Characteristics in the planning table selection screen. If this is not selected, you are restricted to entering only a single value for selection screen Characteristics. For example, if you don’t select this indicator, you can enter only one sales office for the Characteristic Sales Office. Press Enter.
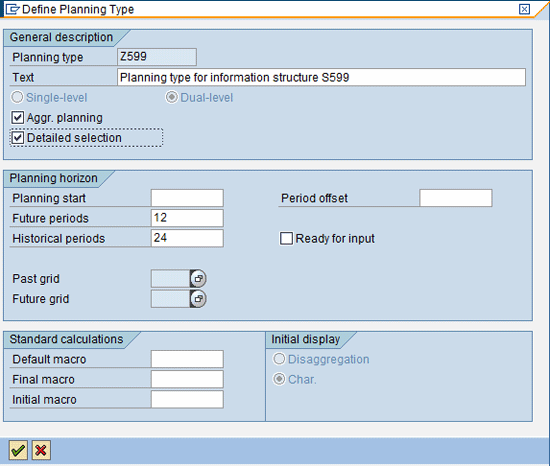
Figure 13
Planning type header detail screen
Now you need to populate key figures of the Information Structure as planning lines and create any additional lines manually. To populate key figures from the Information Structure, use menu path Edit > Assign structure. The key figures popup is shown in Figure 14. Select each Information Structure key figure one by one in order, clicking the enter icon after selecting each. The resulting planning type looks like Figure 15.
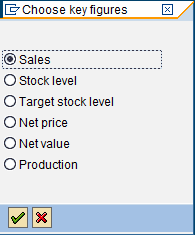
Figure 14
System prompt to select key figures for the planning type
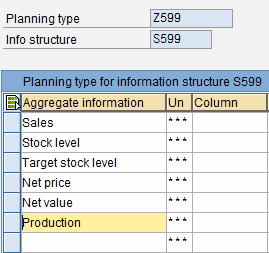
Figure 15
The key figures and their order of selection in the planning type
If you need past-year data to be shown in the planning table, you should bring in the respective lines using the Actual data, previous year and Actual data buttons in the screen’s tool bar. To insert actual data, previous year and actual data below sales, place the cursor on Sales and then insert Actual data followed by Actual data, previous year. Since they are historical values, the lines would be grayed out. Because the planner may add or subtract to the planned values based on his or her judgment, add a line Adjustment below the Stock level line by using the insert row icon. The screen should now look like Figure 16.
Note
The Actual data, previous year option shows the value of the planning data for the corresponding period last year. Similarly, the Actual data option shows the values for all past periods available and can be viewed by scrolling back in the planning line. Both data options are valid with reference to the planning line data under which these lines are created in the planning type.
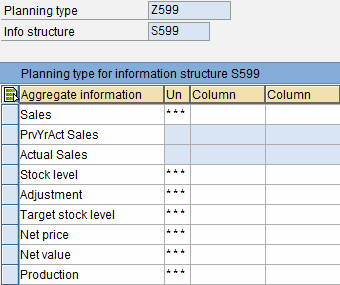
Figure 16
The key figures and additional planning parameters of the planning type
Note
When you carry out planning, the system stores the planned values in the Information Structure table (S599 and S599E in my example) scenario. The table fields are the same as the Information Structure Key Figures. The key figures are represented as planning lines in the planning table as shown in Figure 16. When a flexible plan is created and saved, the system stores plan values in the Information Structure table. When reporting is carried out, the system accesses the Information Structure table to retrieve plan values.
You can customize the planning table line names by double-clicking the current line and selecting the radio button Freely defined text. Enter the desired name (Figure 17). Also in this screen, you can select a Ready for input status such as Planning line, Output line, Text line, or Auxiliary line. An output line is grayed out if no planning values can be input into the line field. An output line is normally the result of a calculation of two planning values that are not input enabled but serve to display the calculated value. Another selection is Aggregation type and for my example it is Total created for all lines except for Sales Price Average $, for which Average calculated is selected, since the planning values for my example scenario must give the total if they are aggregated at a higher level of the planning table.
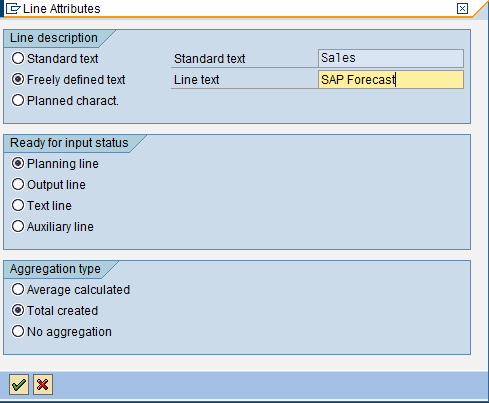
Figure 17
The line attributes of the key figure Sales
Freely defined texts, rather than standard texts, of the Information Structure key figures make the planning table display more intuitive and closer to the business terms used in your own company. Table 1 shows the free texts I’ve used for key figures in this example. The table also gives the parameters used for defining each key figure in their line attributes detail screen.

Figure 1
Key figures and their line attributes
The next step in the planning type maintenance is to define the macros you need for calculations in the planning table. As an example, if you want the production values for all months to be the same as the forecast values for the months, you can define a macro to copy these values from Forecast lines to Production lines. Select menu path Macro > Create to create a macro and enter a macro name and description (Figure 18). Press Enter. Here I’ll explain the macro for Adjusted Forecast line value.
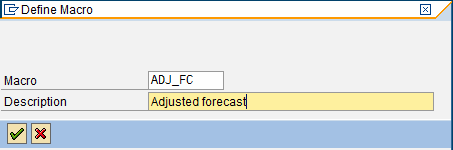
Figure 18
The pop-up screen for defining a macro
In the next screen, select SAP Forecast as the first operand (Figure 19). Press Enter.
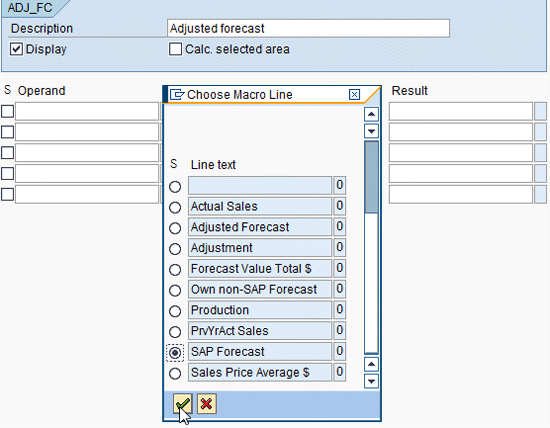
Figure 19
The screen for defining a macro
Keep the cursor in the field Op (short form for Operand) and press F4. Select Add line as the Op field value (Figure 20). Similarly, select Adjustment for the second Operand field value and Adjusted Forecast for Result.
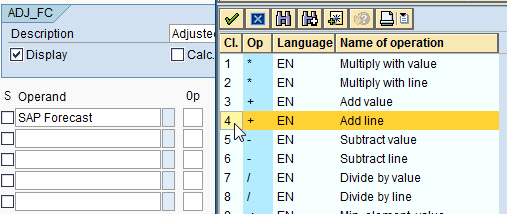
Figure 20
The selection of Operand for macro creation
The final macro definition should look like Figure 21. Save and navigate to the previous screen using the green back arrow.
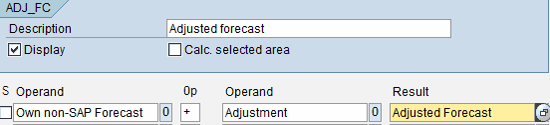
Figure 21
The final definition of macro ADJ_FC
In a similar way, you can define other necessary macros required for calculations in the planning table. The other two macros I’ve defined for my example case are:
- Adjusted Forecast * Sales Price Average $ = Forecast Value Total $
- Production synchronous to Adjusted Forecast
Since this macro definition is a bit different, it is shown in Figure 22 for reference. Save the planning type.

Figure 22
The definition for the macro Production synchronous to Adjusted Forecast
Testing the Planning Table
To test your planning table, you need to create planning hierarchy master data using the characteristics from the Information Structure. Then test the data in the planning table.
Assume that a planning hierarchy exists in the system with the characteristic values shown in Table 2. Using this planning hierarchy, you could carry out a Flexible Planning functionality test in planning table.

Figure 2
The characteristics and values used for defining a planning hierarchy
Note
This article assumes that readers can create a planning hierarchy using the characteristics and data from their own system.
Select the Revise option from the planning hierarchy transaction menu when adding or deleting planning hierarchy members at any time. For my example data, no proportional factor is used.
If the application requires proportional disaggregation of plan values in the hierarchy, maintain proportional factors in the hierarchy maintenance and execute the transaction Calculate proportional data using planning hierarchy (transaction MC8B). As the name implies, Proportional disaggregation splits the total planned value at a higher level and allocates it to lower levels in the planning hierarchy as per the proportional percentages maintained for each member in the same lower level of hierarchy. If proportional factors are not maintained, the system disaggregates the plan value from a higher-level hierarchy equally among members of a lower-level hierarchy. For example, a forecast of 100 units at a division could be allocated equally to five sales offices and therefore the disaggregation would be 20 units for each sales office. Aggregation is the opposite of disaggregation. If proportional value is maintained, the tests in the planning table should include verification for aggregation and disaggregation percentages of plan values at different planning levels in the hierarchy using simple buttons in the toolbar.
Note
Use the menu Flexible Planning under Logistics Controlling for accessing all transactions in Flexible Planning, as all the required transactions are made available at one place in this menu.
Figure 23 shows sample planning data showing the values of Characteristics in the hierarchy and the version number used for the test. This figure also shows the macros I defined.

Figure 23
The planning table display and the pop-up window of macro definitions
Run a forecast using the forecasting functionality within the planning table and populate the SAP Forecast line. For test purposes, they could be entered manually as well.
Note
Here is some additional useful information pertaining to Flexible Planning:
1. Forecasting is carried out by selecting the line SAP Forecast and executing forecast using menu path Edit > Forecast. The system prompts the screen to select a forecast model and to maintain historical values. Select forecast profile SAP, Automatic model selection, and use historical periods 24 or 36. Execute the forecast and copy the forecast values into the planning table. If you already know a suitable forecasting model for your application, selecting it improves system performance.
The system also provides features to carry out different versions of forecasting using different models and stores them. SAP automatic model selection analyzes different historical values to select a model from a historical pattern and uses the model to carry out the forecast. Since there is no historical data in the system when you start using the new design, you could use a loading program to load actual historical data in the productive system.
At this point in the process, I assume you already have an idea of how to execute the forecast and therefore do not go over that process in detail.
2. Planning versions 001, 002, and so on are inactive versions and A00 is an active version. Inactive versions are used for simulations and once finalized can be copied to an active version. The active version is transferred to Demand Management.
3. The actual execution of Flexible Planning in the production system runs using background jobs. Refer to Mass Processing functionality to learn about how to set up variants and background jobs to execute Flexible Planning. Follow menu path Logistics-general > Logistics Information System > Planning > Functions > Mass Processing to carry out configuration for mass processing. The accompanying documentation button provided before each step helps you know more about configuration. To view this help, for example at the mass processing root node in the IMG path, click the button.
To read about Mass Processing functionality, go to help.sap.com and follow menu path SAP Solutions > SAP ERP > SAP ERP Central Component > Logistics > Logistics –General > Logistics Information System > Sales & Operations Planning > Mass Processing.
Enter values for the Own non-SAP Forecast, Adjustment, and Sales Price Average $ lines manually. Execute the three macros in the same sequence shown. Verify the accuracy of the calculated data in the Adjusted Forecast, Forecast Value Total $, and Production lines. If there are any errors, check the previous steps for correctness, especially the macro definitions. Save and exit the planning table.
Display the table by entering the Characteristic values shown in Figure 24 in the selection screen in transaction MC95. The display of the saved plan does not show the adjustment value since it is available and valid only during the runtime of the session.
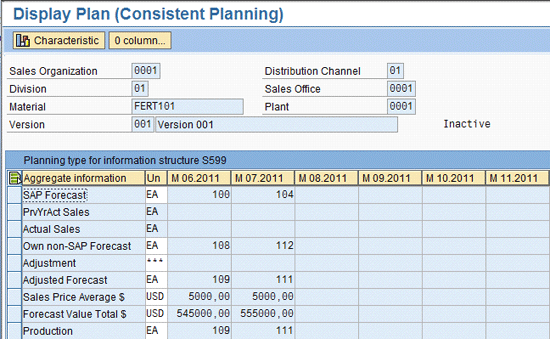
Figure 24
Planning table display with test plan values
You can verify the above plan in SAP reporting functionality as well. This is technically known as Standard Analysis. Follow menu path Logistics > Logistics Controlling > Flexible Planning > Environment > Reporting or use transaction MC9C. Enter the Information Structure name and version number (Figure 25).
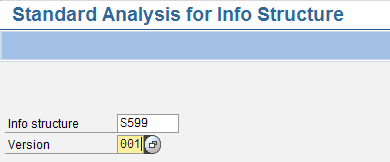
Figure 25
Initial screen for standard analysis of Information Structure
In the selection screen (Figure 26), enter the parameters for reporting. Execute the report by pressing F8 or clicking the execute icon. The report output is displayed as shown in Figure 27.
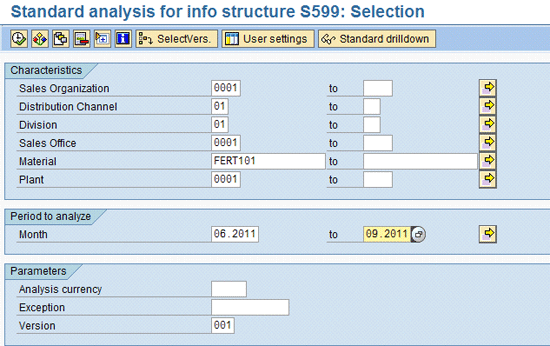
Figure 26
Selection screen for standard analysis of the Information Structure
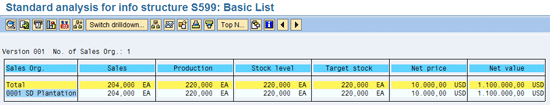
Figure 27
Standard analysis report
Note that the key figures are shown with the standard values and not the freely defined texts. One way to display the freely defined planning table key figure is to create a custom report as a copy of the standard transaction MC9C and change the key figure texts.
You can display the report for different data views. Switch the drill-down feature using the Switch drilldown… button and display monthly planning values as shown in Figure 28. Select Month and press Enter. The system displays the monthly planning figures (Figure 29).

Figure 28
Pop-up to select the drill-down option
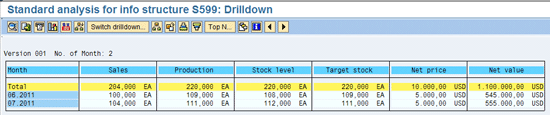
Figure 29
The monthly standard analysis drill-down report
This completes the test for Information Structure configuration and planning table design. You could perform further analysis of Flexible Planning such as:
- Maintain two or more sales offices’ inactive plan versions and note the Adjusted Forecast values. Create a manufacturing plant plan version using the selection screen values in Figure 30 as shown for the example data.
- Maintain Adjusted Forecast by populating the sum from Sales Office plan versions. Carry out all macro calculations in the planning table. Save the inactive version.
- An interested user could also carry out rough cut capacity planning for the manufacturing plant production values. Rough cut capacity planning is carried out to make a rough estimation of whether system resources would be able to meet the production plan. One of the resources commonly analyzed is capacity of critical work centers. Other resources for consideration include procurements of critical or long lead time materials, tools, or costs. If there are any changes required due to capacity constraints in the work center, the planning table plan values need to be modified until the capacity of critical work centers is balanced.
- Copy this manufacturing plant plan inactive version to Active version A00 using transaction MC8V
- Transfer the manufacturing plan version A00 to Demand Management using transaction MC90
- Run MRP. Display a stock and requirements list.
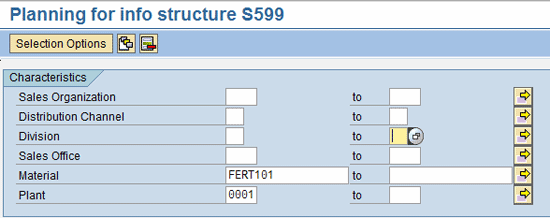
Figure 30
Selection screen for creating a Manufacturing Plant plan version
Note
Some applications may use transaction data values as key figures (for example, goods receipt to unrestricted stock) in the Information Structure. The system updates the Information Structure table upon saving such transactions. If the business application requires you to selectively exclude some organizational units from updates, you can use the update rule functionality in configuration. Follow configuration path Logistics general > Logistics information system > Logistics data warehouse > Updating to carry out the settings.
Where required, you can develop programs to populate planning table values. As in the example case here, this could be to upload data into a planning table or to add Sales Office inactive version Adjusted Forecast values to get the manufacturing plant plan version values to populate the planning table.
Janev K. Veettil
Janev K Veettil has more than 15 years of SAP experience in SAP Production Planning and logistics modules. He has worked on various SAP implementation projects for different industries and his key focus is on manufacturing.
You may contact the author at jveettil@deloitte.com.
If you have comments about this article or publication, or would like to submit an article idea, please contact the editor.