/IT
Some basic tips shed light on debugging ABAP. Learn how to trigger debugging, discover what the main differences between the classic and new debuggers are, and follow some scenarios in which debugging ABAP helps improve the processing of various transactions.
Key Concept
Debugging is the way to find the root cause of certain SAP transactional behavior (e.g., finding a reason why a certain value in a field was updated or determining why users receive an error, warning, or abandon message during the processing of a transaction). Debugging is necessary if the root cause cannot be determined from functional methods such as checking customizations or searching master data.
ABAP is the backbone of an SAP package, so at one point or another, every member of a functional team must have had to deal with SAP development technicalities behind the business functionality. This need for technical details can occur during various phases, such as writing functional specifications or analyzing a production environment issue when an error, warning, or abandon message appears.
I explain basic terminology for ABAP and various tools and techniques for debugging. This knowledge is helpful when you are trying to find the root cause of an issue or designing a needed functionality. I show the various objects for debugging with examples, such as debugging for an error message, debugging SAP script, and debugging a function module.
Note
You need to search for the root cause of an error by checking customization, master data, or correctness of your procedure before attempting any technical debugging.
How to Trigger Debugging
I now discuss some basic ways to trigger debugging. If you are not sure about which line of code you want to debug, enter transaction /h in the command prompt while executing any transaction. Press Enter to activate the debugging. The system opens the debugger, and you can start checking code.
In this example, enter /h as shown in Figure 1 just after you enter all the accounting document information (e.g., Document Date, Posting Date, Reference, Doc. Header Text, and Amount information).

Figure 1
Activate the debugger using a command prompt
Activate the debugger by pressing Enter on your keyboard. The message Debussing switched on appears (Figure 2).

Figure 2
Message for activation of debugging
After this when you do any action on the screen such as posting the document using the Save icon in Figure 1, the debugging screen appears (Figure 3).
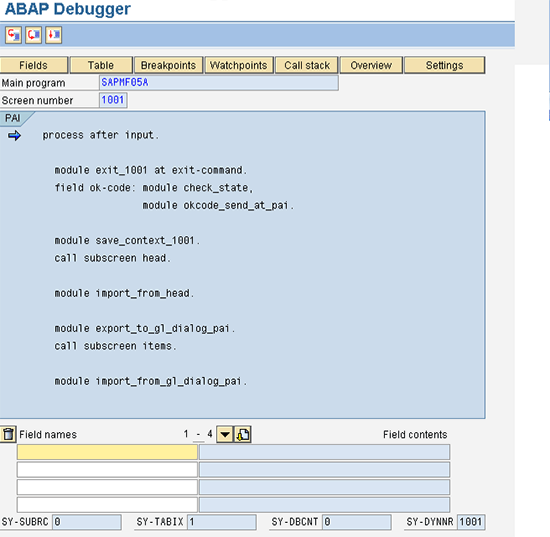
Figure 3
The debugging screen
Sometimes during the processing of a transaction, a pop-up appears in which there is no command prompt. For example, when you click the More button in an accounting document line item, a pop-up appears in which you can populate fields such as the Profit Center, Segment, and Functional Area. When you have filled in these fields, you then want to see what the logic program does after entering these details (Figure 4).

Figure 4
An example of a pop-up in which no command prompt is available
In this example you do not have the opportunity to use transaction /h as there is no command prompt available. To debug in the pop-up, create a text file (.txt) with the lines shown in Figure 5.
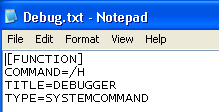
Figure 5
Text files with details for transaction /h to be used in a pop-up screen
Now drag and drop this text file onto the pop-up screen. The debugging is activated as if you had used transaction /h. Instead of creating the text file manually, you can also use the procedure shown in Figure 6 on any SAP screen. Now click the customize local layout icon shown in Figure 6 and select Create Shortcut from the options in the drop-down menu.

Figure 6
Procedure to create text file for transaction /h
Enter details as shown in Figure 7 and click the OK button to save the file to your system.
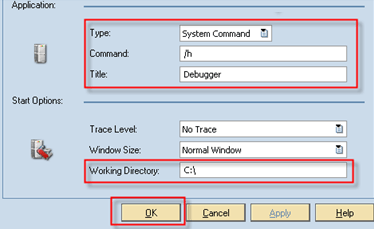
Figure 7
Procedure to create text file for transaction /h
In addition to this general procedure to trigger debugging, you need to know other ways to trigger debugging in different scenarios (e.g., debugging SAP script). I now discuss these different debugging methods.
Basic Elements of Debugging Screens and Processing Options
A debugging screen has various components. The information about debugging screens that I now provide for you is applicable for all debugging in nearly all scenarios. SAP systems include two types of debugging screens:
- The classic debugger
- The new debugger
You can select the debugging type by choosing the classic Debugger or the new Debugger in the ABAP Editor. Use transaction SE38 and follow SAP Easy Access Menu > Tools > ABAP Workbench > Development > SE38 - ABAP Editor. Now follow menu path Utilities > Settings. Go to the ABAP Editor tab and below that tab go to the Editor tab. Then select the new or old editor and press Enter as shown in Figure 8. The editor you selected is now the default editor for your debugging.

Figure 8
Set the default debugger in user master
You also can switch the debugger at any time during a debugging session under the menu option Debugging > Switch to New ABAP Debugger as shown in Figure 9 or under the menu option Debugging > Switch to Classical Debugger as shown in Figure 10.

Figure 9
Switch to the new debugging mode

Figure 10
Switch to the classic debugging mode
The main differences between these two debugging modes are as follows:
- The classic debugger runs in the same session as the application to be debugged. The new debugger executes in a separate session, while the application to be analyzed continues to be in the original session. Therefore, the new debugger provides you with more flexibility to see your initial application screen as well as the debugging screen.
- The new debugger has a flexible interface that can be configured as required and has more than eight desktops. This interface helps ABAP developers do more extensive debugging.
- The classic debugger analyzes a session. Consequently, all breakpoints or variables selected during the debugging not retained in the system after the main application is debugged are cancelled. The new debugger runs in a separate session. As long as this external session is active, the variables or breakpoints selected remain there even if the main application being debugged is cancelled.
Note
I focus on debugging for functional teams, so I explain the features of classic debugging that are also available in new debugging. After understanding the basic debugging, you can explore more technical aspects of the new debugging tool.
Now I discuss the various elements of a debugging screen.
Control Buttons
Figure 11 is the classic debugging screen you create when you trigger the debugging as explained in the section titled “How to Trigger Debugging.”
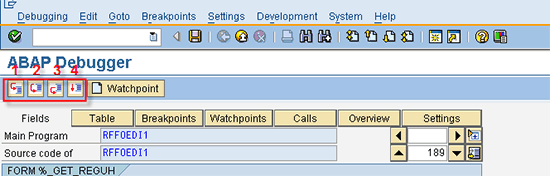
Figure 11
The control buttons in the debugging screen
In Figure 11 you can see four icons that correspond to function keys on your keyboard:
- Single step (the F5 key). When you click this icon, the debugger control moves to the next line of code in debugging. If the next line is a call to another program, (e.g., the function module), then the control shifts to that program.
- Execute (the F6 key). When you click this icon, the debugger control moves to the next line of code in the same program only, without going inside the code of the function module or program being called in the line of code in which you click this icon.
- Return (the F7 key). When you click this icon, the debugger control returns to the calling program. This icon is useful when you are in a loop or inside a function module or program called from the main program and you want to return to the main program.
- Run/Continue (the F8 key). When you click this icon, the debugger control moves to the next breakpoint set, if any. Otherwise, the debugging is switched off, and the program is executed completely.
Fields Display
During debugging, the fields display shows the field list at the bottom (Figure 12). If you click any field of the program, it shows the present value of that field. For testing using a different value for the field, you can change the field value using the change (pencil) icon, but this access in debug is generally given to developers only and not in a production system.
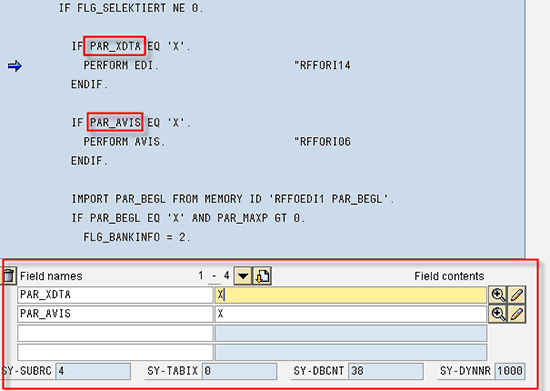
Figure 12
The fields in the debugging screen
Table Display
Using the Table button, you can see the values of various lines in an internal table used in a program. For testing, you can also change, create, or delete any row in the internal table with the buttons shown at the bottom of Figure 13. (Again, for this step you need access permission to replace rows in internal tables in debugging.) You can also transfer the content of an internal table into an Excel file using the save as Excel worksheet icon as shown in Figure 13.

Figure 13
The internal tables in the debugging screen
Breakpoints Display
The Breakpoints button enables you to see the various breakpoints set in current debugging. You can also delete, deactivate, or reactivate any particular breakpoint or all breakpoints via menu option Breakpoints. You can also set the breakpoint for any particular function module by following menu path Breakpoints > Breakpoint at > Function module…. Shift+F7 as shown in Figure 14.
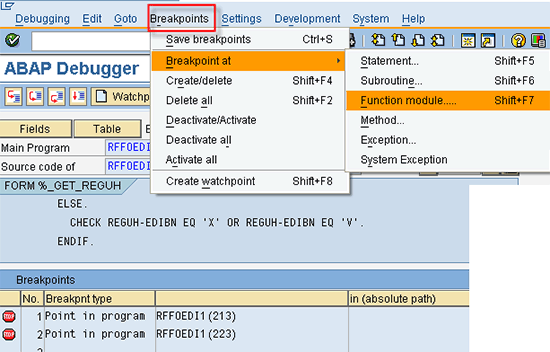
Figure 14
Show or create breakpoints in the debugging screen
Then a pop-up appears, and you need to enter the name of the function module in the Create Breakpoint pop-up (Figure 15). The program then stops at the point at which this particular function module is called. (Similarly, you can set a breakpoint for any particular statement, subroutine program, and so on.)

Figure 15
Enter the breakpoint for a particular function module
Watchpoint Display
The SAP system provides the Watchpoint facility during debugging to stop processing at a particular line in which a predefined field receives the predefined value. This button is useful when you do not know the exact location in a program to debug, but you want to see the area in a program in which a field received a particular value. Using the Watchpoint button, you can see the various watchpoints set in current debugging. You can also create a new watchpoint. For example, in the ABAP Debugger screen define the watchpoint by clicking the Watchpoint button (Figure 16).

Figure 16
Show or create watchpoints in the debugging screen
In the next screen (Figure 17) enter the value that you want to check (e.g., you can define the program to stop when the field flg_selektiert receives value 1).
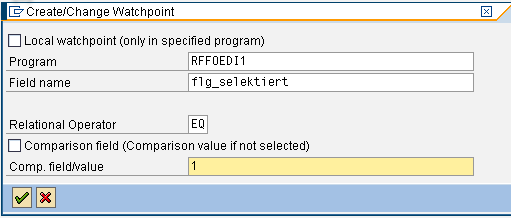
Figure 17
Enter values for watchpoint creation
Calls Display
The Calls button enables you to see how the debugger has reached the current line of code from the point you started the transaction (Figure 18). It lists everything (e.g., programs, function modules) called up to the current line of code. If you double-click these called lines, you can navigate to them.

Figure 18
Show calls in the debugging screen
Overview Display
Using the Overview button, you can see the various programs, function modules, or performs from the start to the end in the current application transaction processing. It also shows the exact position of the debugger in this entire flow (Figure 19).
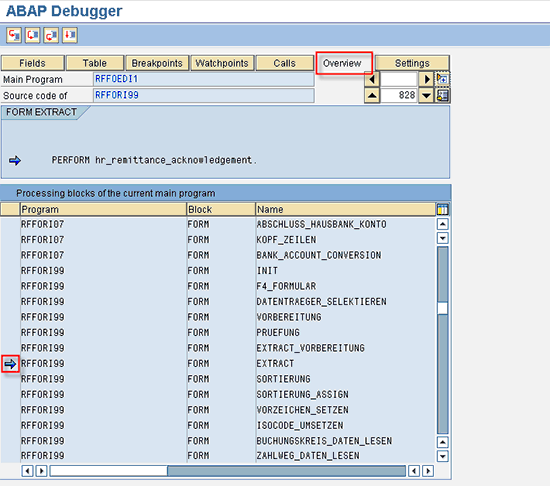
Figure 19
Show an overview of processing blocks in the debugging screen
Debugging for Various Objects or Scenarios
Now I show you various examples of different real-time scenarios (i.e., during some common business processes such as executing a payment run) and explain the debugging to determine the root cause of the system behavior.
Standard SAP Messages
Consider a simple scenario in which you execute an automatic payment program (APP) in transaction F110. Follow menu path SAP Easy Access Menu > Accounting > Vendors > Periodic Processing > F110 - Payments). You receive a warning message (Figure 20), but you are not sure why this message has appeared, and there is no long text available in the message.
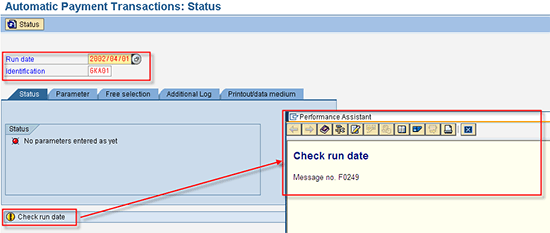
Figure 20
A warning message during APP processing
You want to know why the SAP system has sent this warning, so you need to debug the logic for this message. Your first step is to enter your run date and identification. To activate the debugger enter transaction /h in the command prompt. Press Enter. Now create a breakpoint for the statement message.
Follow menu path Breakpoints > Breakpoint at > Statement… Shift+F5. In the pop-up that appears (Figure 21), enter a message in the Breakpoint at statement field. This breakpoint stops the program at a point where the program tries to show any message output.

Figure 21
Enter message as the statement to debug
After you set the breakpoint, click the execute icon or press F8 to execute the program. The program stops during the point at which the warning message appears (Figure 22).
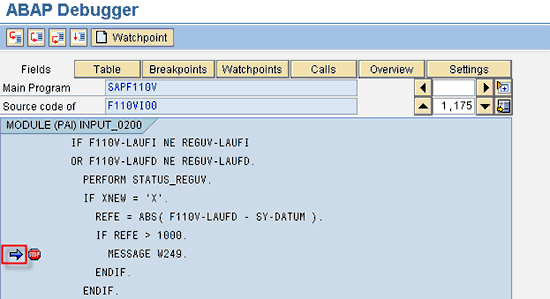
Figure 22
Stop the program at the defined breakpoint after execution
Now you can try to determine why you received this message. If you see the code, there is a comparison of field value of F110V-LAUFD and SY-DATUM. If the difference is greater than 1000, then the system shows this message. Click these fields to see the values of the fields in debugging (Figure 23).

Figure 23
Different fields values during debugging
You can see that the system has calculated the difference in days as 3,658 days between the Run date 20020401 and the system date 20120406. The maximum allowed difference is 1,000 days, so a warning message appears. The SAP system warns you if you try to enter a run date in transaction F110 earlier than 1,000 days to avoid any wrong date entry due to a typing mistake.
I just outlined the easiest way to debug for messages appearing during processing, but there is also another way to debug for messages. Each message contains a message class and a message number. The last three digits of the message are the message number followed by the message class. For example, for message F0249 (Figure 20), F0 is the message class, and 249 is the message number. Now execute transaction SE91. Follow menu path SAP Easy Access Menu > Tools > ABAP Workbench > Development > Programming Environment > SE91 – Messages. Enter this message class and number on the selection screen. Click the where-used list icon as shown in Figure 24.
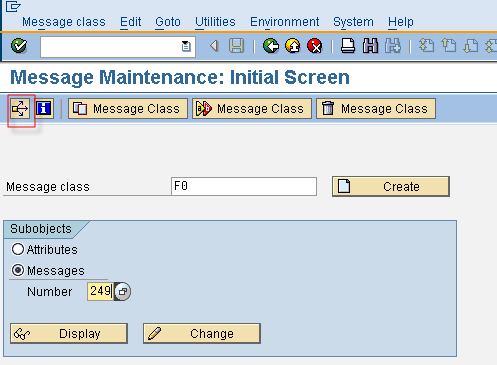
Figure 24
Display the message details
The next pop-up appears in which you can select the type of objects in which this message is used. Select all types and press Enter (Figure 25).
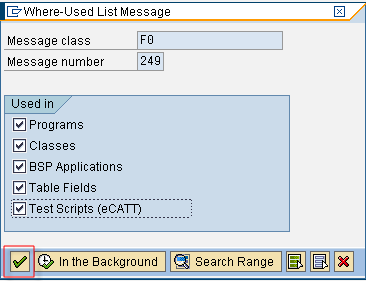
Figure 25
Select the message usage scope
On the next screen, you can see all the places where this message is used (Figure 26).

Figure 26
List where the message is used
Double-click the line of code in which the message appears (there can be multiple lines where this message may be used, so you need to put a breakpoint for those). On the next screen set the breakpoint using the set/delete breakpoint icon as shown in Figure 27.
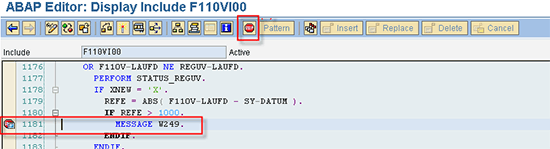
Figure 27
Set the breakpoint on a particular line
I have cited a simple example for understanding the way to debug for messages. However, based on the complexity of logic in the program, you may need to read more program logic to determine the root cause of the message.
SAP Script
SAP Script is a format for output used in various applications. For example, in financial accounting, various correspondence types such as dunning letters or account statements need to have a format defined in the background. Developers define this format as an SAP Script form. Sometimes in the output, the value may not be coming correctly for a field, such as a wrong invoice number coming in output, and you want to know how this value is populated in the output so that you can do the debugging for the SAP Script form. There are two ways to trigger the debugging for SAP Script forms:
1. If you know the SAP Script Form name, execute transaction SE71. Follow menu path SAP Easy Access Menu > Tools > Form Printout > SAPscript > SE71 – Form. Enter the form name and then from the menu select Utilities > Activate Debugger (Figure 28). Then when you trigger the SAP Script from the application (e.g., for Correspondence Type for a customer statement), the program stops at this form in debugging mode. To trigger the SAP Script from the application, execute transaction F.27 and follow menu path SAP Easy Access Menu > Customers > Periodic Processing > Print Correspondence > F.27 - Periodic Account Statements.

Figure 28
Activate debugging for an SAP Script form
2. If you are not sure of an SAP Script form name, execute transaction SE38. Follow menu path SAP Easy Access Menu > Tools > ABAP Workbench > Development > SE38 - ABAP Editor. Enter the program name RSTXDBUG and execute the program. This program activates the debugging. Whenever any application calls any SAP Script form, the system stops at that SAP Script form in debugging mode.
With regard to both these methods, when you execute the application for triggering output to trigger customer statement correspondence type SAP13, it stops the SAP Script form debugger, and you can see the debugging screen. To execute the application for triggering output, use transaction F.27 and follow menu path SAP Easy Access Menu > Customers > Periodic Processing > Print Correspondence > F.27 - Periodic Account Statements (Figure 29).
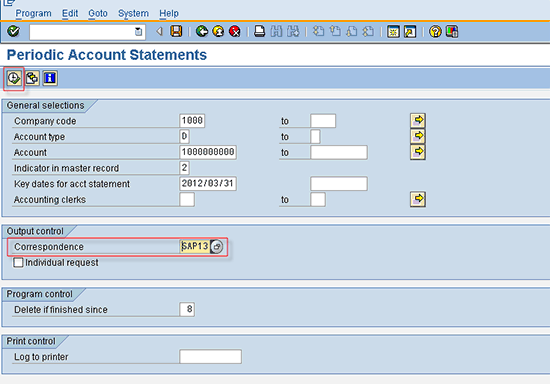
Figure 29
Triggering customer statement output
In the pop-up screen (Figure 30) click the OK button to continue debugging the script form.
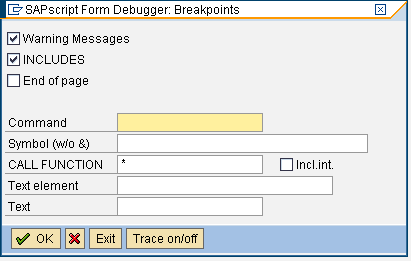
Figure 30
The pop-up during debugging of SAP Script
On the next screen you can see the Script Form Name and the Window of the Script form being processed (Figure 31).

Figure 31
The debugging screen for SAP Script for customer statement output execution
Smart Forms
An SAP system provides Smart Forms, an advanced tool that enables you to define the output formats without having to use the classic tool of SAP Script forms. In Smart Forms, you can define various fields in the output more conveniently. The Smart Forms tool is also easy to maintain for any changes. Many of the new developments in an SAP system are now using Smart Forms instead of SAP Script forms to provide greater flexibility. The procedure to debug the Smart Form is different from SAP Script forms. Every Smart Form generates a function module in the background dynamically, and the code of this function module is changed every time when there is a change done in Smart Forms. So the best way to debug Smart Forms is to put the breakpoint in this function module. Follow these steps:
Step 1. Execute transaction SMARTFORMS and follow SAP Easy Access menu path Tools > Form Printout > SMARTFORMS - Smart Forms. Enter the Smart Form name you want to debug and click the Display button (Figure 32).
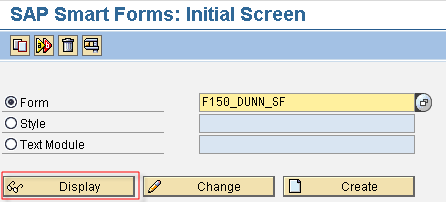
Figure 32
Display the smart form
Step 2. On the next screen, go to Environment > Function Module Name. The system displays the function module name as shown in Figure 33.

Figure 33
Display the function module name
Step 3. Execute transaction SE37 and follow SAP Easy Access menu path Tools > ABAP Workbench > Development > SE37 - Function Builder (Figure 34). Enter the function module name as noted in step 2.

Figure 34
The function module
Step 4. In transaction SE37, follow menu path GOTO > Main Program. A list of programs appears on the screen. Double-click the last include (program) in the list (Figure 35) obtained in step 4.

Figure 35
Display the program containing logic of smart form
Step 5. This program contains the entire logic for the Smart Form defined. Put the breakpoint at the start or at any particular line of code you want to debug (Figure 36).

Figure 36
Set the breakpoint in the program of the smart form
Step 6. You execute the application using this Smart Form by executing transaction F150 and following SAP Easy Access menu path Customers > Periodic Processing > F150 - Dunning for dunning letters triggering where a Smart Form such as F150_DUNN_SF is assigned in customization. Then the program stops at this breakpoint.
Background Batch Job
Sometimes you may need to debug the background batch job being executed. For example, when you execute the automatic payment program in transaction F110 (follow menu path SAP Easy Access Menu > Accounting > Vendors > Periodic Processing > F110 - Payments), the SAP system creates a background batch job. If you have set the breakpoint in the output program such as RFFOEDI1, then it does not stop at that breakpoint. For debugging such a background batch job, follow these steps:
Step 1. Put the breakpoint in the program you want to debug. For example, if you want to debug RFFOEDI1 program used to generate IDocs in payment run execution via transaction F110, then place a breakpoint in this program in transaction SE38 (Figure 37).
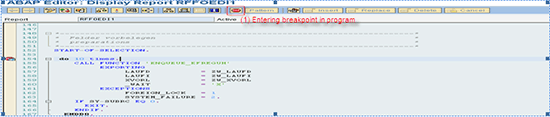
Figure 37
Set the breakpoint in the program in transaction SE38
Step 2. Run your application as usual to trigger the batch job, such as execution of the proposal run to trigger the background batch job for payment proposal execution as shown in Figure 38.

Figure 38
Trigger the background batch job for the payment run proposal
Step 3. Use transaction SM37 and follow SAP Easy Access menu path Tools > CCMS > Background Processing > SM37 - Jobs - Overview and Administration). Select your batch job as shown in Figure 39.
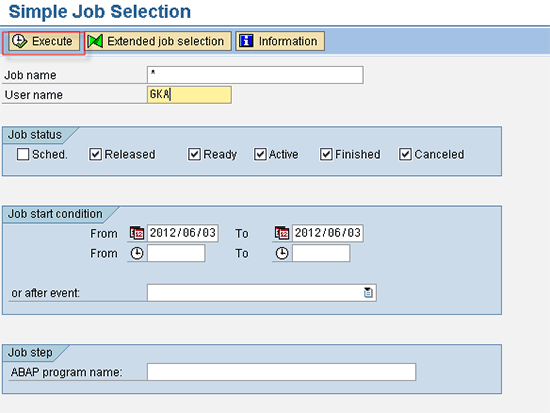
Figure 39
The batch jobs for the user
Enter JDBG in the command prompt as shown in Figure 40 and press Enter.

Figure 40
Trigger the debugging for the batch job
The debugging screen appears (Figure 41).
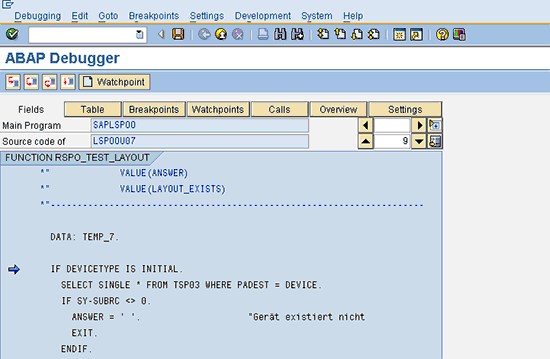
Figure 41
The debugging screen
Step 4. Click the execute icon and the program should stop at the breakpoint you set in step 1.
Validation and Substitution
You can define various validations and substitutions in the system for various applications. For example, for a financial account various validations are defined in transaction OB28 (or by using transaction SPRO and following menu path Financial Accounting (New) > Financial Accounting Basic Settings (New) > Tools > Validation/Substitution > Validation in Accounting Documents). Various substitutions are defined in transaction OBBH (or by using transaction SPRO and following menu path Financial Accounting (New) > Financial Accounting Basic Settings (New) > Tools > Validation/Substitution > Substitution in Accounting Documents). You might be interested in debugging these validations or substitutions for checking whether you have defined the logic correctly or to find the issue in real environment where a validation or substitution is not working as expected. There are two ways to debug the validations or substitutions.
The first way is to use the function module calling the validations or substitutions. Execute transaction SE37 and follow menu path SAP Easy Access Menu > Tools > ABAP Workbench > Development > SE37 - Function Builder. Put the breakpoint in the calling function modules. Then when doing the relevant application transaction, such as financial document posting to call financial accounting validations or substitutions, the system triggers the debugging. The disadvantage of this method is that you may need to navigate to multiple validations or substitution coding before you reach the one for your application. The function modules calling validations or substitutions are as follows:
- G_VSR_VALIDATION_CALL (for validation calling)
- G_VSR_SUBSTITUTION_CALL (for validation calling)
The second way is to use the actual program containing the code for a particular validation or substitution step. The advantage of this approach over the first one is that here you can directly debug the relevant code for your particular validation or substitution step. You do not need to go through the unnecessary code of other steps. Follow these steps:
Step 1. Make sure that your background program for the validations or substitutions is the current one. It is more necessary in case you have made any changes. To regenerate the background program, execute the program RGUGBR00 in transaction SE38 and follow SAP Easy Access menu path Tools > ABAP Workbench > Development > SE38 - ABAP Editor as explained in SAP Note 151065 (https://service.sap.com/sap/support/notes/151065).
Step 2. Execute transaction SE37 and follow SAP Easy Access menu path Tools > ABAP Workbench > Development > SE37 - Function Builder. Enter G_CLIENT_ENCODE for the function module name. Execute the function module and enter your three-digit SAP system client code (where you want to debug). When you execute this program, it returns a two-character code for your SAP system client. For example, this function module returns AA for client 100, C2 for client 200, FU for client 300, and IM for client 400.
Step 3. Execute transaction SE16 and follow SAP Easy Access menu path Tools > ABAP Workbench > Overview > SE16 - Data Browser and give table GB03T with language EN. Then find the two-character code for your application area that you want to debug. For example, for Financial Accounting it is FI, for Managerial Accounting (Controlling) it is CO, for Profit Center Accounting it is PC.
Step 4. Find the name of the master program that contains all the validation and substitution definition for your application area in your SAP system client, from the naming convention GBTmmaa0 where mm is the two-character code as obtained in step 2 for your SAP system client and aa is the two-character code as obtained in step 3 for the application area. So for FI, the program name in the SAP client 100 is GBTAAFI0.
Step 5. Go to transaction SE38 and follow SAP Easy Access menu path Tools > ABAP Workbench > Development > SE38 - ABAP Editor. Display the master program obtained in step 4. This program contains the various includes (programs) for various components; for example, for FI in client100, this master program GBTAAFI0 contains the following includes:
INCLUDE GBTAAFIA. "Rules
INCLUDE GBTAAFIB. "Substitutions
INCLUDE GBTAAFIC. "Substitution perquisites
INCLUDE GBTAAFID. "Validations
INCLUDE GBTAAFIE. "Validation prerequisites
INCLUDE GBTAAFIF. "Validation checks
INCLUDE GBTAAFII. "Application rules
INCLUDE GBTAAFIJ. "Subst. export routines
INCLUDE GBTAAFIM. "Trace/simulation
INCLUDE GBTAAFIS. "Subst. import routines
In this program you can find the coding for the validation or substitution step in the preceding list of includes and can put the breakpoint there to check your validation or substitution step.
System Dump
Sometimes you get a system dump during processing and the program is terminated. This might be because of incorrect coding logic or incorrect system behavior. To see those dump details and to start debugging, follow these steps:
Step 1. Execute transaction ST22 and follow menu path SAP Easy Access Menu > Tools > Test > ST22 - Dump Analysis. Select which dump you want to see in detail. You have the direct option to see today’s or yesterday’s dump. For any specific date, you need to give the selection parameters (Figure 42).

Figure 42
Display the system dumps
Step 2. Then double-click the dump from the list obtained in step 1, which you want to see in detail (Figure 43).

Figure 43
Display the details for a particular system dump
Step 3. On the next screen, if you click the ABAP Editor button, it takes you to the line of code in which the dump occurred (Figure 44).
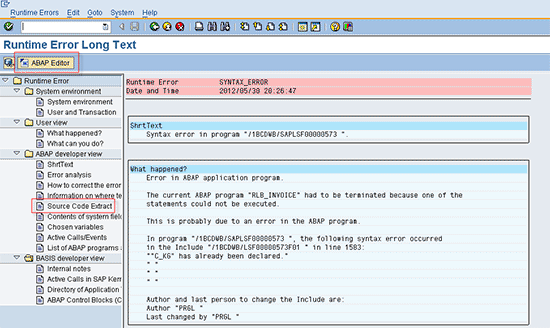
Figure 44
Go to the debugger from the system dump
Step 4. Place the breakpoint (Figure 45) in the program as obtained above and when you again try to execute the main application in which the dump occurred, the system stops at this particular breakpoint set.

Figure 45
Place the breakpoint in the program
Note
These scenarios are the most common ones generally faced by a functional expert. There are other more technical objects such as debugging Remote Function Calls (RFCs) used in interfaces between an SAP system and other systems or debugging events such as calling of a Business Application Program Interface (BAPI) by external applications. These more complex objects are beyond the scope of this article.
Other Tips and Tricks During Debugging
Here is a list of additional tips to refer to before debugging ABAP:
- If you set any breakpoint during debugging, save it. Otherwise that breakpoint disappears when you restart the transaction.
- During debugging, instead of pressing F5 each time, press F6 when you do not want to go inside a function module or PERFORM in the program. Pressing F6 enables you to bypass a function module or program and go directly to the next statement.
- Similarly, if by mistake you have gone inside a function module or perform during the debugging, then press F7 to return to the previous program calling it.
- During debugging, to see values for a field or internal table, you do not need to type the field name or internal table name in the display area in the debugging screen. Instead, double-click the field or internal table to see its content in the debugging screen display area.
- During debugging, you can also replace the values of a field or internal table to test in what-if scenarios. However, you need access for change in field values in debugging screen. This access is generally not provided in a production system for security purpose.
- If you are looking for why a particular field has a particular value, then use the watchpoint option in debugging for that field. This option enables you to avoid the unnecessary debug until the point when that field fetches the particular value.
Gaurav Agarwal
Gaurav Aggarwal is SAP S/4HANA lead consultant at Infosys Limited. He has more than 14 years of experience, including 11 years in SAP Finance. He has expertise in both SAP FI and Controlling (CO) with integration to other modules in manufacturing and process industries. He is a chartered accountant and SAP Certified Financial Consultant. He holds a bachelor’s degree in commerce and is a techno-functional expert with thorough knowledge of the necessary ABAP for functional experts. He is a veteran in G/L, AR, AP, banking, FA, Travel Management, and closing cockpit and has handled greenfield implementation, upgrades and conversions, rollouts, and support projects.
You may contact the author at gka2707@gmail.com.
If you have comments about this article or publication, or would like to submit an article idea, please contact the editor.