Learn how mySAP CRM Trade Promotion Management uses the data within buying patterns to distribute the predicted promotional volume. Then find out why the system might override a default buying pattern and what you can do to avoid this.
Key Concept
Trade Promotion Management (TPM) helps you plan and execute trade promotions. A part of Marketing Planning and Campaign Management within mySAP CRM, it works with Business Information Warehouse’s Business Planning and Simulation (BW-BPS), mySAP ERP Central Component (ECC) or R/3, and Advanced Planning and Optimization. With TPM, the key account manager (KAM) plans the trade spends offered to the customer for promoting the product. This translates into condition records and rebate agreements in R/3 or ECC. The KAM also plans the promotional volume expected as a result of these trade spends.
Imagine that you are a key account manager (KAM) planning promotional events with your customer. All of the customer’s promotional events start on a Sunday and run for three weeks. Depending on the reason for the promotional event, your customer may order most of the promotional product early and reserve the rest to cover potential stock-outs.
In other cases, your customer may elect to use its safety stock and then order the bulk of the product toward the end of the buying period to restock its warehouse. When you enter the promotional event in the system, you select the expected buying pattern, which adjusts the forecasted sales volume to reflect the expected customer behavior. Sometimes the system appears to ignore your selected buying pattern, leaving you to wonder, “Why was my buying pattern not used in this trade promotion?”
Here’s what you need to know about buying patterns in Trade Promotion Management (TPM), including how they work and how to calculate the buying pattern distribution to ensure that the system uses the appropriate one. This information is not found in either online help or in the IMG documentation.
Customer Default Dates and Buying Patterns
SAP developed buying patterns to facilitate the planning process and to improve the accuracy of the data shared with Advanced Planning and Optimization (APO). They allow the system to spread the promotional volume more realistically than with a straight weekly proration. This altered distribution provides a more accurate demand signal to APO and reduces the chance of stock-outs during promotional events.
Customer defaults allow a KAM to create customer-specific templates to simplify trade promotion creation. Buying patterns allow the KAM to store standard ordering distribution patterns that improve the demand signal sent to APO. Buying pattern distributions depend on the customer defaults created by the KAM, the calendar assigned to the trade promotion, and the starting day of the promotion. When the trade promotion does not meet the prerequisites of the customer defaults, the system ignores the entered buying pattern.
The system links both customer default dates and buying patterns to specific campaign types. If you’re implementing TPM, consider creating different campaign types to represent different promotional durations (e.g., one week, two weeks). KAMs can use customer defaults and buying patterns in the different campaign types to reduce data entry and improve demand signals sent to APO.
Maintain customer default dates and buying patterns in the Maintain Customer Defaults screen by following menu path SAP menu>Marketing>Marketing Planning and Campaign Management>Administration (transaction CRM_ MKTPL_DEFAULTS). In this screen the KAM sets up default time dimensions and volume spreads for specific accounts. The Campaign Type column stores the customer default values (Figure 1). For each campaign type, identify a calendar (called a factory calendar), the starting day of the promotion, the length of the promotion, and then the appropriate offsets from the planning dates, such as the buying period. For example, the buying period could start two weeks prior to the beginning of the planning period.
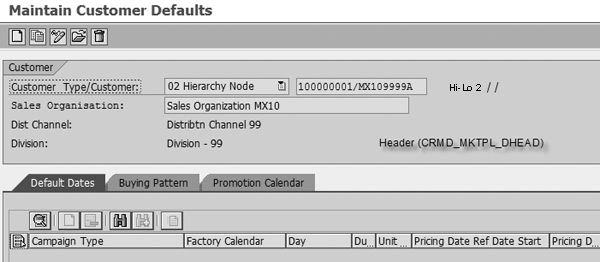
Figure 1
Maintain Customer Defaults initial screen
In addition to the planning (in-store) period, a typical trade promotion includes buying, pre-dip, and post- dip periods. The planning (in-store) period is the actual time the promotion is in effect in the store, with products displayed. The buying period either can be the same as the planning (in-store) period, or can include the post-dip and pre- dip periods. Refer to Table 1 for more information about the buying, pre-dip, and post-dip periods.
|
Buying period
|
The interval for which the pricing conditions are valid. This can be congruent with the planning period, but often starts earlier than the planning period and may end prior to the end of the planning period. The time difference allows for the time needed to move product from the customer’s warehouse to the retail shelves.
|
|
Pre-dip period
|
The time period during which the baseline order volume drops because customers often delay normal orders until the beginning of the buying period.
|
| Post-dip period |
The time period just after the promotion during which order volume drops because customers often order additional product (forward-buy) just prior to the end of the buying period to stock their warehouses with less- expensive product. |
|
| Table 1 |
Trade promotion periods |
Note
You can assign up to two additional date periods in a trade promotion, but currently no special processing exists for these date periods. To use these periods in a meaningful way (for example, to default the validity period of a condition record) requires programming Business Add-Ins (BAdIs) to change standard system behavior.
You can enter pre-dip and post-dip period values in the trade promotion and associated forecasted volumes to reflect customer purchasing behavior. The customer default record assumes a standard ordering pattern for a given customer. For example, a standard pattern could be that the customer always starts its promotions on a Friday and reduces its safety stock one week prior to a promotion. If you maintain the customer default record when you create a trade promotion, the KAM enters the customer name and the beginning date of the planning period and presses Enter. The system then completes the rest of the date ranges for the customer’s promotion.
The Buying Pattern tab in Figure 2 allows you to create buying patterns to influence the distribution of expected promotional volume. When the KAM selects the appropriate buying pattern in the basic data screen of the trade promotion, the system distributes the total promotional volume across the promotion period.

Figure 2
Define buying patterns
As with customer default dates, you link buying patterns to a specific campaign type. However, unlike customer default dates, the Buying Pattern Type column allows you to assign multiple buying patterns to the same campaign type. You maintain buying patterns on the Maintain Customer Defaults screen, but the system does not default to them in the trade promotion.
Note
The Buying Pattern Type is simply a label created in configuration — it has no specific meaning nor is there any validation behind the label. For example, in Figure 2, the labels include 3 week pattern and 4 week pattern. You could assign a duration of two weeks to either of these labels without raising an error.
A KAM must enter a buying pattern into the trade promotion manually. The rule is one set of default date assignments per customer and campaign type combination, although you can have many possible buying pattern schemes. After you select the buying pattern type, the KAM enters a duration and then a set of percentages based on the duration. You must remember three things when establishing default buying patterns:
1. If your planning layout is in calendar weeks, then your buying pattern must be in weeks, too.
2. The duration of the buying pattern in the trade promotion is based on the additional date configuration settings. These determine whether the system should consider a particular date in the buying pattern period determination (Figure 3). If the pre-dip and post-dip dates are not part of the buying pattern determination, then the system does not use them to determine the length of the buying period.
3. The sum of the percentages of the buying period must equal 100%. Although initially you could not begin or end a buying pattern with 0% in mySAP CRM 2005, SAP has lifted this restriction with Support Package (SP) 4. The need for 0% depends, in part, on how you configure the pre-dip and post-dip period date ranges. When you include these date ranges as part of the buying pattern, the system spreads the promotional volume to include those weeks. To prevent placing demand in the pre-dip period, for instance, you must enter 0% for this period.

Figure 3
Additional date assignments configuration — the system does not consider pre-dip and post-dip periods in buying pattern period determination
Tip!
In the Promotion Calendar tab, you enter known customer-initiated events. While they do not show up in individual trade promotions, you can view them from within the marketing calendar by using the customer view. This enables the KAM to coordinate the manufacturer’s trade spending and enhance the impact of a customer’s event.
In my example in Figure 4, I defined a three-week buying pattern with significant back- loading of the promotion. This means that the customer receives 70% of the volume in the last week of the promotion.
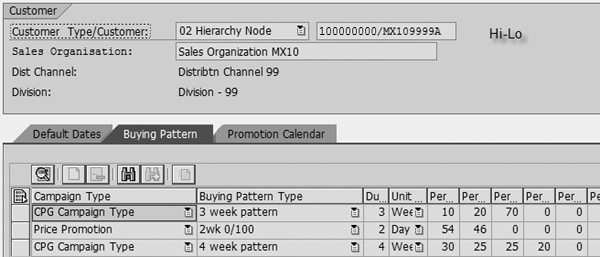
Figure 4
The defined buying pattern
This pattern makes the calculation process more obvious, although from a business perspective this type of buying behavior is not desirable for distributors. In this case, customers use the large shipments at the end of the promotional period to refill and overstock the warehouse with cheaper product bought at the promotion rate. The customer in turn sells the product for full price after the promotion ends and keeps the profits.
Buying Pattern in a Promotion
Figure 4 shows the basic data screen for a three-week consumer packaged goods (CPG) promotion. I’ll use this example to discuss how the system uses a buying pattern to distribute sales volume during the promotion period. To do this, a buying pattern must meet the following prerequisites:
- A buying pattern record exists for the combination of business partner, sales area, and campaign type. (The F4 help for this field displays all of the configured pattern labels; it is not restricted to the labels that the KAM maintained for that customer.)
- The duration of the buying pattern entered in the promotion basic data screen must be the same as the duration of the promotion. In Figure 5, assume that the buying period has the same duration as the planning period displayed. For my example, the buying pattern duration I entered in the master data must be three weeks because the promotional period is three weeks.
- You must enter a Workday Calendar into the basic data screen of the trade promotion. Without this calendar, the system ignores the buying pattern.

Figure 5
A three-week promotion. Click here to view a larger version of this image.
Note
When calculating the duration of the promotion, the system rounds to the nearest period of the buying pattern. If the buying pattern is in weeks, then any promotion that is at least 11 days long and no more than 17 days long is considered a two-week promotion.
The buying pattern in Figure 4 meets the prerequisites, so I can use it in the Volumes/Trade Spends tab in Figure 5. After entering the products involved in the promotion in the Products tab, I switch to the Volumes/Trade Spends tab and enter the expected total volume for the promotion (Figure 6). In this example, I spread the volume across the Shipping date range. Two things about the volume distribution may strike you as odd. First, Figure 6 shows four weeks (periods) in the Shipping area, not three. Second, the spread does not match the 10% – 20% – 70 % entered in the default record in Figure 4. What is happening?

Figure 6
Volumes/Trade Spends distribution
Calculate the Buying Pattern Distribution
Four periods are visible because each period within BW-BPS begins on a Monday. Since my example promotion began on a Sunday, the system needs four weekly periods to store the data in BW-BPS. The first period of the promotion consists of a single day and the last period displayed represents six days. To understand how the system arrived at a distribution of 1% – 11% – 27% – 60% instead of the 10% – 20% – 70% maintained in the customer defaults in Figure 4, let’s look at the detailed steps in the calculation process. The variance from 100% is due to rounding.
Step 1. Determine the distribution factor by reading from the master data record of the buying pattern. Find the buying pattern record by using the business partner, campaign type, and duration of the promotion. This returns the three-week pattern of 10% – 20% – 70%. If the promotion had started on a Monday rather than a Sunday, then you would see three periods displayed, not four. Also, the volume distribution for the 1,000 units would have been 100, 200, and 700 instead of 14, 114, 272, and 600.
Step 2. Determine the calendar factor for the first period. Calculate the number of working days in the first promotion period and divide that by the total number of working days in the week. In this case, the number of promotion days in the first period (the period starting 10/04/2010) is one and the number of working days in the first period is seven.
Note that the factory calendar used in the trade promotion affects both of these determinations. Normally the factory calendar has seven working days each week (barring holidays). The calendar factor equals the number of days within the promotion period for the week divided by the number of days in the week. In this case, the factor would be one day divided by seven days (approximately 14%). Because the total for the first week of the promotion is 100 cases, the number of cases in the period beginning 10/04/2010 is 14.
Step 3. Prorate the promotional volumes based on the calendar factors. Whenever a promotion starts mid-week, the system splits each buying pattern factor between two calendar weeks. In my example, the 100 cases from the first buying period are split into 14 and 86 (100 - 14). The system stores this until you calculate the next period splits.
Each period is split into 1/7 of the amount to be placed in the current period and 6/7 of the amount to be rolled over into the next period. For my example, you calculate the second period number by determining the second period split (1/7 x 200 = 28 cases). Then add the 28 cases from the first buying period rollover (86) to get 114 cases. Repeat the same process for the last two periods.
Factors That Influence the Calculations
Factory calendar. Recall that the calendar factor equals the number of days within the promotion period for the week divided by the number of days in the week. The calendar factor’s numerator (number of days on promotion for the week) and the denominator (number of working days this week) are based on working days. If a holiday falls during the promotional period, it changes the ratios for the week that includes the holiday.
For example, suppose Columbus Day (October 12th) is marked as a holiday during the first week in the factory calendar assigned to the trade promotion. The ratios would be 1/6 and 5/6 for the first period, instead of 1/7 and 6/7. With the holiday, the system would report 17 cases (17% of 100) in the first week. The first buying period rollover in this case would be 83 cases instead of 86 cases (100 - 17). The 28 cases in the second period split would remain the same because the second week reverts to the standard 1/7 and 6/7 ratios, so the second week total would be 111 cases (83 + 28). The actual algorithm is a bit more complicated that this, but conceptually this is the impact on the distribution.
Volume entry column. The Volumes/Trade Spends tab enables you to enter either total volume, which then calculates uplift (total volume - baseline volume) or uplift volume, which then calculates total volume (uplift + baseline). Although it is possible to maintain negative percentages in the buying pattern default, if you enter total volume in your trade promotions, then you should not use negative percentages in your buying pattern. A negative promotion results in a negative uplift greater than your baseline shipments. In other words, you forecast returned stock in that period.
Pre-dip and post-dip volumes in buying pattern. If you include pre-dip and post-dip volumes in the buying pattern, then the total volume period is the sum of the pre-dip, buying, and post-dip periods. The total volume entered is distributed to include the pre-dip and post-dip periods. You must include percentages for those periods in your pattern. (If you do not maintain pre-dip and post-dip dates in the trade promotion, they are not included in the length of the buying pattern period.)
For example, if you assume a one-week pre-dip period, a three-week buying period, and a one-week post-dip period, then the total buying period is five weeks. You must select a buying pattern that is maintained for the five weeks.
Alternatively, if the pre-dip and post-dip periods are not part of the buying pattern (as in Figure 3), but you enter dates for those periods into the system, then (assuming you enter total volume) the system records the total volume in the pre-dip and post-dip periods as zero. It then distributes the total volume entered among the three weeks of the buying pattern. In effect, with this setting, the system assumes a negative uplift equal to the baseline forecast for those two periods. You can manually override this default if necessary.
Promotions Not Equal to the Calculated Duration
An 11-day promotion is considered to be a two-week promotion for buying pattern purposes. The proration calculation process results in buying pattern factors that total less than 100% because the second week is an incomplete week. If you multiplied the total volume by the sum of the calculated percentages, some of the volume would be unaccounted for. This “missing” volume is spread across the periods based on the ratio of the calculated percentages.
Michael Debevec
Michael Debevec is president of Debevec Consulting, Inc., and is a senior consultant with more than 14 years of experience with SAP. He has worked with SAP CRM for the past nine years and assisted in implementations in the high tech, consumer products, and pharmaceuticals industries. Prior to working in SAP, Michael was an IS manager in charge of logistics systems.
If you have comments about this article or publication, or would like to submit an article idea, please contact the editor.


 Premium