See the added functionality that comes with the SAP Enterprise Performance Management 10.0 Add-In for Excel. Learn how you can use the Add-In to enhance your SAP NetWeaver BW and SAP BusinessObjects BI reports.
Key Concept
You can find enhanced reporting capabilities within the new functionality and features in the SAP Enterprise Performance Management (EPM) 10.0 Add-In interface. These enhancements include, but are not limited to, refresh features and connection options to InfoCubes in SAP NetWeaver BW and SAP Planning and Consolidation. The Microsoft Excel interface of the EPM 10.0 Add-In is a key entry point for reporting on all components within this suite, as well as basic SAP NetWeaver BW InfoCubes.
The ramp-up process for SAP Enterprise Performance Management (EPM) 10.0 is underway. All the components in that suite are either moving forward with ramp-up companies or have recently moved out of ramp-up to general availability. One of the significant areas to change in this version is the user interface (UI) that goes across the entire suite of products.
Each of the toolsets for EPM products in the past has had its own UI, but with version 10.0, that approach has changed. There are reporting options within each of the products that are inherent to the specific component, but the focus is on using the Microsoft Excel interface of the EPM 10.0 Add-In for reporting on all components within this suite. The Add-In is incorporated into the EPM 10.0 suite of products and is the primary UI for version 10.0. If your focus is SAP Planning and Consolidation (BPC), then this UI is required for reporting and input functionality as well as for direct access to the Data Manager portion to execute BPC-specific activities.
One of the by-products of the EPM 10.0 reporting component is that it not only supports the EPM products — including the Microsoft and SAP NetWeaver versions of BPC, Strategy Management, Profitability and Cost Management, and Financial Information Management — but it also can work with the core BI InfoProviders in SAP NetWeaver BW.
From a reporting point of view, you now have to include the EPM 10.0 Add-In in the mix of all the components to choose for reporting. Will it be Crystal Reports, Analyzer, Web Intelligence, Dashboard Designer, BEx Analyzer, BEx Web Analyzer, or Business Explorer? Even though the Analyzer and BEx Analyzer support the use of the Excel component of the Microsoft Office suite, the EPM Add-In separates itself from the rest in a number of ways.
The core functionality of the Excel interface of the EPM Add-In is about as close to a native Excel spreadsheet as you can get. If you compare the three Excel-based reporting components (BEx Analyzer, Analytics, and EPM Add-In) based on their Excel functionality, I believe the EPM Add-In comes out on top.
There are differences within the EPM Add-In when you use it based on one connection versus another. I only address the connection that allows you to use the OLE linking process rather than the inherent linking process that’s available based on the BPC integration. Looking at the most current version with SP07 Patch 5 applied, I focus on the larger audience of SAP NetWeaver BW InfoProviders versus the audience that uses BPC InfoProviders exclusively.
Figure 1 shows the user groups that this EPM Add-In accommodates. The Excel Add-In offers the ability to cut across multiple types of users as well as the different activities and processes in which each of the user groups is involved. Not only can you do significant amounts of slicing and dicing with the Excel interface, very similar to the use of a pivot table, but you can also develop production level reports to be distributed to management groups for analysis.
If you drill down one additional layer in the EPM Add-In, you see that it is geared more toward users who are comfortable with Excel functionality and need to be able to organize their information very quickly and on the fly for detailed analysis. This type of user can be found in just about every department. Many companies need additional analysts to organize the data for certain stakeholder groups in a particular manner, and this functionality helps facilitate these requirements.
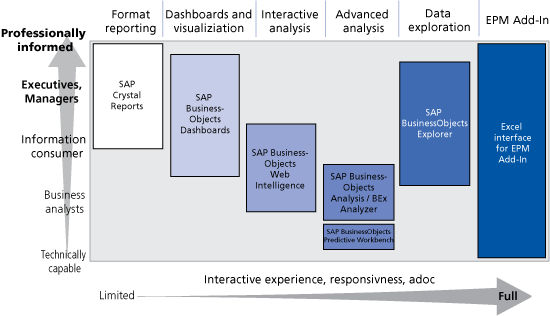
Figure 1
How the EPM Add-In relates to different user groups
After installing the EPM Add-In, you see a couple of added tabs to your Excel ribbon, one each for EPM and Data Manager (Figure 2). Generally, Data Manager is specific to BPC, and therefore I do not discuss this option in this article.

Figure 2
Additional tabs on the Excel spreadsheet for the EPM Add-In
Click the EPM tab and you see the initial set of options available (Figure 3). Because I did not log on, much of the ribbon is grayed out. Now I log on to an SAP NetWeaver BW InfoProvider to see the different approaches.

Figure 3
EPM ribbon features and functions
It is important to understand the different connections that are possible with this Excel Add-In.
If you click the Log On button, you see a screen that is similar to the one in Figure 4. By clicking the … button to the right of the Connection field, you can access the connection options.
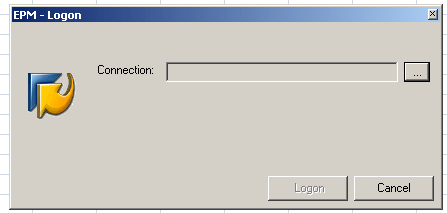
Figure 4
Log on by clicking the … button
Once you execute that option you see a screen that is similar to Figure 5. You probably see something slightly different depending on your authorization and EPM Support Patch level. Once the connections are set up the links to InfoCubes are available. In addition, you see connections to both true SAP NetWeaver BW InfoCubes (the ones that start with either 0 or Y or Z) and the BPC-based InfoCubes (the ones that start with CPMB). What this means is that even though you normally access the BPC cubes via other connections, you can also get to a BPC cube using the OLE link.

Figure 5
Display the links to InfoCubes
On the right side, click the Create button, which allows you to display all the available connections (Figure 6).
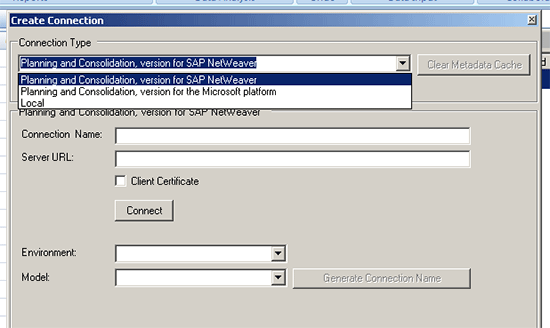
Figure 6
Options for links
The initial option for the different links — Planning and Consolidation, version for SAP NetWeaver; Planning and Consolidation, version for the Microsoft platform; and Local — dictate what the other fields show you during the creation process. In my example, I want to take a look at the Local connection, which allows you to get to the underlying BW InfoCubes. (I’ll be referencing the two different connections — Local link and the BPC link — throughout this article.)
Once you select the Local connection, you see several parameters in the Local area of the screen. Figure 7 shows that the next option is to access a system based on one of the connections. You can get to the SAP NetWeaver BW-based InfoCubes either with a BAPI provider or an OLE database provider. I use the latter.
The parameter that appears just under the Connection Type field (Do not Load Members at Connection) is new to the SP07 for high data volumes. If you know that the specific InfoCube to which you are linking has high data volumes for both transactional and master data, you should check this parameter by clicking the check box.

Figure 7
Parameters for the Local connection
This parameter manages the amount of data that is uploaded into the local cache of the Excel component during the initial execution of the Excel document. If you have significant amounts of data, the ability to access the Excel front is affected. To avoid long wait times, use this Do not Load Members at Connection parameter and only upload the data that is required for the initial query to execute. It works nicely with the combination of the SAP NetWeaver Business Warehouse Accelerator (BWA) to help with all the data. This is the enhancement in SP07 that allows the use of the EPM Add-In against SAP NetWeaver BW InfoProviders more effectively. Without that option, it is difficult to sell your business users on the EPM Add-In since the report runtimes are affected.
Once you choose the OLE link in Figure 7, the rest is straightforward. Click the Connect button that appears directly in the middle of the screen in Figure 6. You see a dialog box, similar to the one in Figure 8, for all the connection information to the server. Once you fill in the fields, the connections are stored and you don’t have to do this again for the same InfoCube. The information for these fields is the same as what you would do for the setup of access for entering the SAP system via the GUI. Once these fields are filled in click the Next button and then log in with the user and password that you have for your BW system. Once you log in you are directed back to the original screen where you can then choose whatever InfoCube or InfoProvider you like.
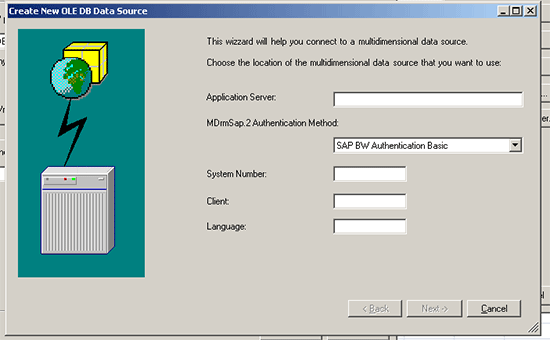
Figure 8
Enter the system connection information
Figure 9 shows the final step in this process. You can choose among the available InfoProviders by scrolling down the list and identifying the InfoCube you want to use for your report. You have now created the connection to an SAP NetWeaver BW InfoProvider using the OLE link. Once you identify the InfoProvider, click the OK button on the screen and log on the same way as logging onto an SAP system. Don’t forget about the parameter for the high data volumes.
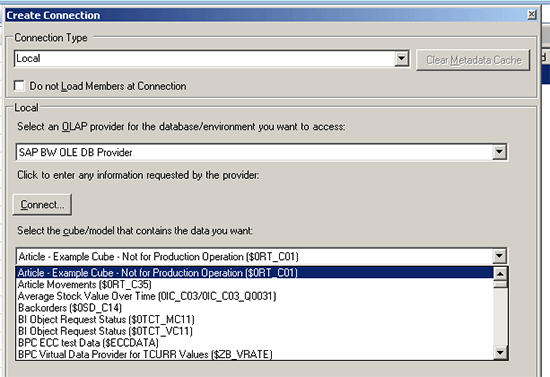
Figure 9
Choose an InfoProvider
Once you log into your EPM Add-In, it shows your characteristics and key figures for the InfoCube. You are ready to create your report. Figure 10 shows that most of the EPM tab options are now available and that the characteristics and key figures are available.
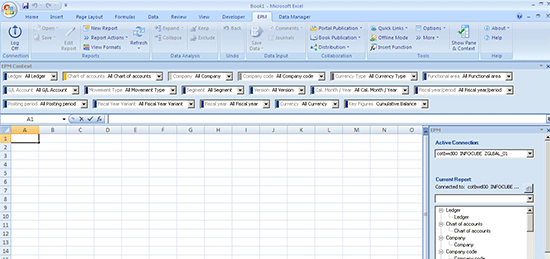
Figure 10
The initial screen for the EPM Add-In
Some of the options are specific to a BPC process so those are still grayed out (e.g., the Save Data option under the EPM tab). This is an entirely new component with quite a bit of functionality that is beyond the scope of this article. The functionality is slightly different when it comes to accessing the data from an InfoProvider if it’s an SAP NetWeaver BW basic InfoCube versus a transactional InfoCube.
Note
A transactional InfoCube is one that normally is integrated into Strategic Enterprise Management, Integrated Planning, or a BPC process. It therefore has the ability to get data from an input template, such as the EPM Add-In, rather than only being able to get data via an upload using standard SAP NetWeaver BW data flow processes.
I recently was involved in testing of an EPM Add-In that was done to measure performance. Some of the data volumes were large. For example, the report testing was done on more than 1.2 billion records and more than 1 million values for all the characteristics. We included more than 300 hierarchies and the reports ran within seven seconds.
Options in EPM Add-In
Now let’s look at some of the functionality, starting with Refresh, which is available in the EPM Add-In. The Refresh function offers a number of different options compared to BEx. The Refresh options are found in the Report section of the Add-In ribbon. Additional parameters are in the Options area either in the User or Sheet options. Figure 11 shows the functions available from the Report section for Refresh:
- Refresh Worksheet refreshes the current worksheet that is being used.
- Refresh Workbook refreshes the entire workbook that is currently being used. When you use this option and your workbook has 10 worksheets, for example, the system highlights each of the tabs going across as the system is working to refresh that set of data. You are able to see where your refresh is at a given time rather than guessing if the refresh is actually ongoing. (This is an enhancement to be delivered this year.)
- Refresh Selected Data allows you to specify refreshed data. If you highlight a section of the report and execute this option, the system pulls the data for that particular section rather than pulling the data for the entire worksheet or report. This can reduce the refresh time required on a report.

Figure 11
Refresh options
Additionally, the Refresh options from the Sheet Options portion of the ribbon include those found in Figure 12. In this case, some of the options are familiar to you, such as Keep Formula on Data. This is the function that helps with formula collisions. If you have a formula in a row and one in a column, at the intersection of the two formulas the user needs to tell the report which formula to use. Once that’s done and if this parameter is checked off, then the formula is kept and the result stays consistent with what you want to see.
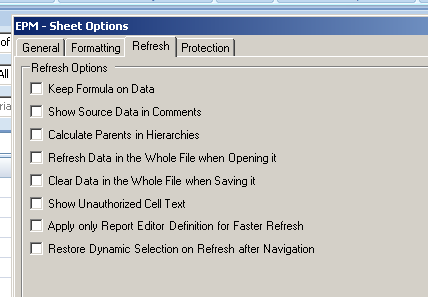
Figure 12
Sheet options for refresh functions
The parameter Refresh Data in the Whole File when Opening it refreshes all the data for the whole workbook upon opening. The parameter Clear Data in the Whole File when Saving it clears all the data from the workbook upon saving, which helps with security since the next time you execute the report, you do not see a set of stale data. Someone who is unauthorized to see the data of a specific report can’t just open the report and possibly see stale data, but instead sees either a blank report or a report with just their data included.
In the User Options (Figure 13), Freeze Data Refresh comes in handy when you want to navigate several steps. Rather than waiting multiple times for a database refresh to the report, you can turn this option on and then navigate and execute one refresh. The additional options of Automatic Refresh on Context Changes and Refresh Charts Automatically are useful during basic filter changes to the report information.

Figure 13
List of user options
One basic feature that always frustrated me a bit in the EVDRE process was the inability to quickly add another row or column to the report once it was completed. You had to work with the control panel to realign the range of columns and rows to get another dimension into the report. Now you have the Report Editor (Figure 14). The ability to drag and drop another dimension or characteristic from the list and move from the rows to columns are basic features in the EPM Add-In.

Figure 14
Drag and drop functionality in the Report Editor
Figure 15 shows the Member Selection screen for the OLE link to use the EPM Add-In. To get to this screen, you click a specific characteristic and the filter and selection screen shows up. Those currently using the EPM Add-In front end for BPC links will notice a significant difference. All the functions work in a similar way to the BPC link view, but the display of the members is different. When using the BPC link, you see the hierarchies and members in one list, but in the OLE view you see hierarchies as a flat format and not the hierarchical level views. The relationship process is similar, but the display is different.
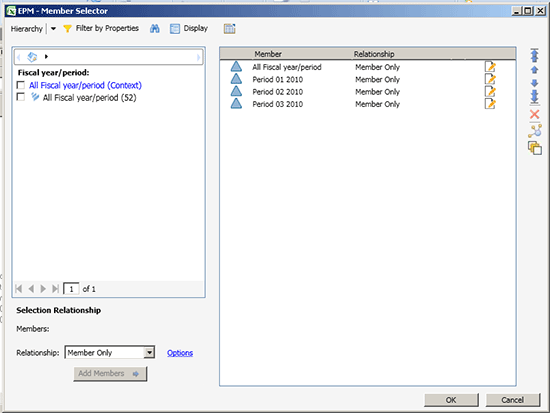
Figure 15
Member Selector screen for EPM Add-In on SP07
One of the more talked-about new features is the ability to turn on or off a function called Member Recognition in the EPM Sheet Options (Figure 16).

Figure 16
Member Recognition option
Member Recognition allows the user to start to type in either the technical ID or description of a member value, and the system attempts to recognize it. It offers either the exact match or a list of members available based on what you are typing into a field. If a list appears, you can choose from the list and then it defaults into the report. This is something that wasn’t available in any of the SAP reporting components without giving up significant features.
You can start to type the nodes of a hierarchy and build your report using this approach or just type in account numbers and they default into the report. Then enter some time periods across the top of the report and you have a working ad hoc report (Figure 17). Notice that the EPMOLAP format is recognized by the report in the fx field.

Figure 17
An ad hoc report created using Member Recognition
Once the report recognizes the values, perform a simple Refresh and your report is sourcing the data as shown in Figure 18. Note the additional parameter in the lower corner of the dialog box for Cancel. This is new. You can use it to stop the report from running not only in the foreground but also at the system level. This is something that was not available before.

Figure 18
A new report is sourced after refreshing
Once this is complete, you have started to develop your report as shown in Figure 19.

Figure 19
The initial screen for an ad hoc report
Double-click the Total Assets button and it expands to the next level down as shown in Figure 20. This is something you can also control by the settings in the Sheet Options. You can have the report show the top node as well as the descendants (as shown here) or other views (e.g., only the next level down or removing the highest node from the report). At this point the report is a fully functional ad hoc report.

Figure 20
Expand the Total Assets node
Another new feature of the EPM Add-In is the ability to create and use asymmetric reports while still keeping all the available reporting functionality. An asymmetric report is a report that is not the same across all the columns or rows. For example, you don’t want to see your columns by version Actual – Plan all the way across the report, but you may want something like Actual – Plan – Budget – Budget – Forecast – Actual on each of the columns in a report. Or perhaps you want to see non-sequential time. Rather than Jan through Jun, you might want to see Jan – Feb – Mar – Q1. By comparison, a symmetric report only allows you to have the same sequence across the columns.
In my report, I decided to add Version to the columns (Figure 21). Notice the system prompts me to select Version after I have typed in Actual in the column by showing me the member selector screen.

Figure 21
An example of an asymmetric report
From here I can just type in the other values of the version that I might have, or I can choose to use the Edit Report feature found on the EPM ribbon to bring up the Report Editor to organize my columns. I’ll just continue to type in the versions across the top of the Period dimension. I could also cut and paste the values as shown in Figure 22.

Figure 22
Editing options
Once you enter the values by typing, cutting, and pasting or using the Report Editor, you can generate your report. As Figure 23 shows, you now have an asymmetric report in which the columns are not consistent across the report. In my example, I have filtered each column with Version and Time so across the columns you see, for example: Plan/actual version: Budget & Period 01 2010; Plan Version: Change1 & Period 02 2010; Plan/Actual version Budget & Period 03 2010. If you take this one step further you can see that reports, such as those with columns with multiple TIME, are possible, so you can have your columns look like this: Jan/Act; Feb/Act; Mar/Act; QTD/Act; QTD/Plan; YTD/Act; Last year-YTD/Act.

Figure 23
A report with different column headings
Now, let’s enhance the report by adding a subtotal (Figure 24). You insert a row and use a formula to generate the result. By just inserting a row, typing in a heading, and using an Excel formula to create the result, you can add rows or columns to your report. In the example in Figure 24, I inserted a row and typed in the words Total Assets and Prop, Plant & Equipment. Then, by using an Excel formula, I added a subtotal for this row.
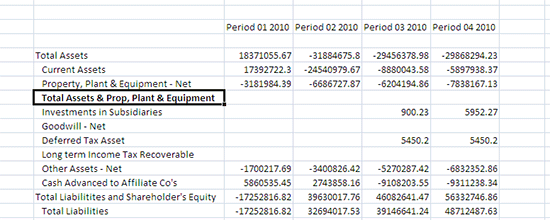
Figure 24
Add a subtotal
Now if you have Member Recognition turned on, in the Sheet Options, you see that the formula populates the entire row. If you turn off Member Recognition, you can use a basic Excel formula and the result is just about the same. The only difference is that after you’ve created the formula for one column, you have to drag the formula to the other columns for it to finish the process of populating them.
Notice in the fx field in Figure 25 that the Excel formula is being used. If the Member Recognition is turned on, then your formula is created and stored as a Local Member. This means that you have a bit more flexibility with the formula to control its use in the report due to the ability to reuse that formula in other portions of the report without having to recreate it.

Figure 25
An Excel formula in use
In Figure 26, if you double-click the Current Assets line, it expands to all the lower level values. The subtotal moves with it. During the collapse, it moves back to the original position. This is something that works with both the Local Member approach as well as the basic Excel formula approach in the OLE link.

Figure 26
The Current Assets line expanded
Figure 27 shows the Local Members in the Report Editor. You can change the name, adjust the description, and align the formula with different members in the report. Now, rather than needing a number of key figures created by the IT department to use during the report build, you can create your own on the fly and store them in this report.

Figure 27
Make changes to Local Members
Figure 28 shows a similar process for the columns. I add a column for Quarter 1 information.

Figure 28
Add a Quarter 1 column
Let’s finish by adding some formatting and headers to the columns of the report. In Figure 29, I use the Excel-based format to enhance the report’s look and feel. Any Excel formatting that is used continues to be supported by the report. You can save the report, and when you execute it again, you still have the formatting that you applied before.
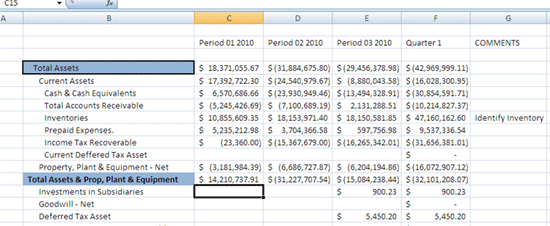
Figure 29
Add formatting
You can also use the EPM Formatting template, which offers a central approach to formatting reports. You can find this EPM Formatting template on the EPM ribbon (Figure 3) – View Formats. You can create unique EPM formatting templates. Business users can select the one that supports their formatting requirements. Figure 30 shows the EPM Formatting Sheet. To change or adjust the formatting, all you do is click the field you want to change and use the standard Excel formatting options. The EPM Formatting Sheet has selections for rows, columns, hierarchies, and header and footers.

Figure 30
EPM formatting options
You also can change the description of the dimension member in the report so that the business user can customize the look and feel. In Figure 31, I decide that the time in the columns needs to be more user friendly. Rather than Period 01, 2010, I want to show JAN 2010. Access the Report Editor again and use the Member Name tab to make the adjustment.

Figure 31
Customize the time period to make it more user friendly
In Figure 32, you see the change. The column headings have switched from numerical time to more user-friendly month titles.
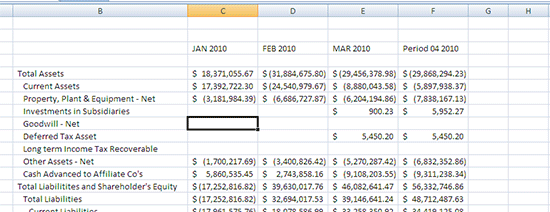
Figure 32
Time columns listed as months
In addition to the features I have mentioned, the EPM Add-In also has the following new features:
- Ability to generate a book of reports for publishing
- Distribution of reports via email, share drives, or printers
- Support for multiple reports on one Excel worksheet
- Support for multiple reports on one Excel worksheet from multiple sources (more than one InfoProvider on one worksheet)
- Support for multiple worksheets in a workbook
- Ability to remove all data from a worksheet during the process of having someone close it, which allows for additional security around the view of data
- Multiple different options during drilldown from one level to another
- Support for the use of BWA
- Copy and paste of a report from one worksheet to another is enhanced and takes only seconds to accomplish rather than multiple activities to create
- Full list of EPM fx and FPMXL features that support additional functions within the report, such as Visual Basic for Applications and macros

Peter Jones
Peter Jones is a business intelligence solution architect in the areas of CO, EC, SAP BW, BI, BusinessObjects, Planning and Consolidation (BPC), and SEM for MI6 Solutions. He is certified in all these areas and is a subject-material expert for SEM, CO, BI, and BPC, with over 14 years of experience in these areas working for SAP and MI6 Solutions. Currently, he is involved in projects incorporating SAP BW 7.4, HANA, BPC 10.0, and EPM 10.0. He has consulted in all those areas for the last nine years. Peter was an SAP instructor for seven years and has written several books about SAP NetWeaver BW, FI/CO, and has recently revised his book about BPC Implementation to version 10.1. He is a contributor to Best Practices for Financial Reporting in SAP, an exclusive anthology of articles that delivers unparalleled guidance on how to optimize financial reporting processes with SAP applications.
You may contact the author at peter.jones@mi6solutions.com.
If you have comments about this article or publication, or would like to submit an article idea, please contact the editor.


