Find out what you need to know about Pipeline Performance Management, a tool offered with SAP CRM on-demand, SAP CRM 2006s, and SAP CRM 2007. See the options available to the sales team and managers and then see how to set them up in your system.
Key Concept
Pipeline Performance Management is an analytical application designed to help sales managers plan sales quotas and manage the pipeline with respect to the plan. In turn, sales reps can review and analyze their performance, identify the goals in the sales pipeline, and take required actions to achieve quotas.
The biggest challenge that sales professionals have is to plan and manage against the planned sales quota in an integrated, real-time application. I will introduce you to an interactive tool for sales pipeline analysis available in SAP CRM 2006s called Pipeline Performance Management (PPM). This tool was first introduced in SAP CRM on-demand in 2006, is included in SAP CRM 2006s, and will be available for subsequent releases.
PPM is built on the pre-existing business processes in SAP CRM and uses existing SAP standard sales processes in SAP CRM 2006s. PPM provides the opportunity pipeline information in the form of tables and bar charts to check won deals, expected deals, sales targets, and the remaining difference between won, expected deals, and sales targets.
PPM merges analytics and actions into one application. Sales professionals can simulate opportunity changes and what- if scenarios to close potential gaps in the sales pipeline. Furthermore, sales managers or authorized employees can easily maintain sales targets with integrated sales quota planning. They can also maintain individual churn rates to calculate the target in the Sales Pipeline view.
Let me introduce you to some of the detailed functions in PPM, such as the views available, the briefing card functionality, and the application settings. Then I’ll walk you through the steps to set up PPM in your system.
Detailed Functions
Let’s explore the various functions of PPM in detail starting with the different views that are available. After that, I will review the application setup and configuration details.
Views
The data derived from opportunities is presented in four views that cover the following areas:
- Target to date
- Closing date
- Sales pipeline
- Sales pipeline change
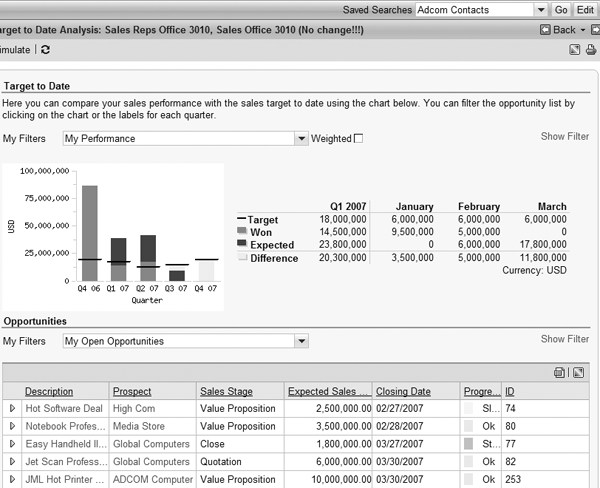
Target to Date. This view shows the total value of expected sales and sales targets in the sales pipeline up to the current date. Sales managers can monitor the sales team’s sales performance with respect to the revenue target reached up to the current date.
On the Target to Date page, you can view the list of opportunities that are involved in the deal (Figure 1).You can manage the sales pipeline by changing information for these opportunities directly in the list and viewing the results immediately in the bar chart and table at the top of the page.

Figure 1
The Target to Date page shows the revenue achieved up to and including the current date
In each chart you can decide whether you want to see weighted or unweighted figures. With weighted figures, the anticipated target-to-date sales in the target-to-date simulation are influenced by the opportunity’s sales stage, which has a predefined probability of success factor. The system uses this factor to calculate the predicted sales volume for a specific time frame in the weighted calculations. For example, if an opportunity is in the quotation stage and the probability factor for the quotation phase is 20%, then the weighted volume uses the 20% factor to reflect the expected volume. The weighted expected sales volume is a conservative estimate of the sales revenue figure.
With unweighted figures, the probability of success factor does not influence the forecasted revenue. The full value of the opportunity is reflected in the overall pipeline calculations.
Another possibility is to filter the opportunity list by Relevant for Target. An opportunity is target relevant for a sales team if the sales team or one of the sales teams in the organizational model is set as the organizational unit of that opportunity. An opportunity is target relevant for a sales representative if he is the owner of that opportunity and his sales team is the organizational unit of that opportunity. These rules prevent double counting opportunities.
Closing Date. This view shows the expected sales volumes compared with the sales targets on a monthly and sales stage basis (Figure 2). The closing date is the estimated date on which you plan to complete an opportunity through a successful sale. This date is particularly important for monitoring and analyzing your sales pipeline. Sales managers can view the total values of won and expected deals compared with monthly targets in the sales pipeline and the difference between those values. Five months are displayed by default — one month in the past, the current month, and three months in the future.

Figure 2
The Closing Date view provides an overview of the expected sales and closed sales with respect to the target in a given month
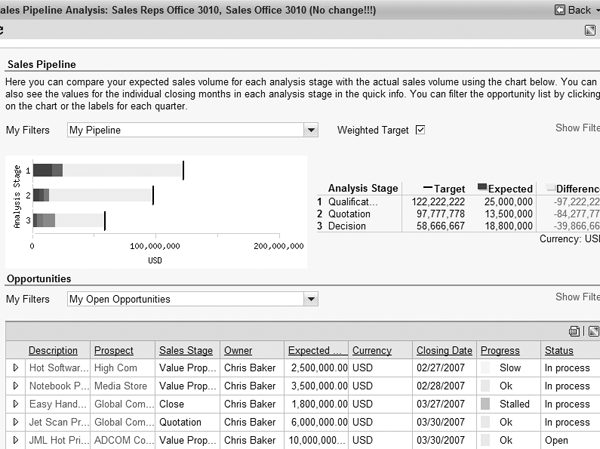
Sales Pipeline. This view shows the expected sales volume for each analysis stage compared to the actual sales volume (Figure 3). The target line in the Sales Pipeline page is calculated based on the average sales cycle, growth factor, and opportunity churn rate factor of the sales team in consideration. This target calculation is different than the target calculation in the Target to Date view in which the target is not calculated, but inherited from the superseding organization.

Figure 3
The Sales Pipeline page shows the expected sales volume for each analysis stage compared to the actual sales volume
When you move your cursor over the target line, it displays the target figure in the relevant currency. Expected deals are potential sales that you predict for the sales stage after won deals. The Difference column shows the gap that remains between expected sales volume and target for that sales stage.
Sales Pipeline Change. This view displays all the opportunities in the sales pipeline that have changed (Figure 4). You can monitor the changes to the sales stage, expected sales volume, closing date, and progress. Changes to the expected sales volume are shown in light blue with an arrow to indicate how a value has changed. Opportunities are listed with relevant details, such as the prospect name, the sales stage in which the opportunity currently resides, and the opportunity’s progress. I’ll discuss the speed status, progress status, and respective settings later in the “Application Setting Options” section.

Figure 4
The Sales Pipeline Change view displays the changed opportunities in the pipeline
Briefing Card Functionality
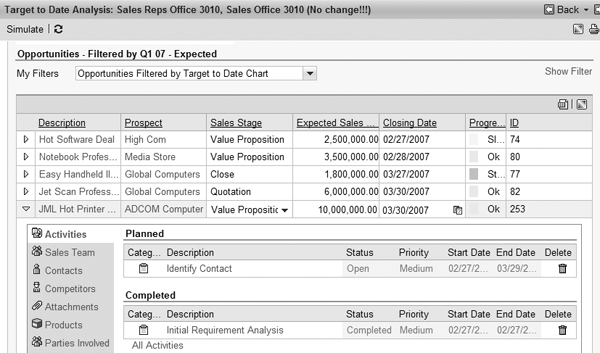
The PPM views display the relevant information regarding the pipeline analysis. To get to detailed information for an opportunity, you should open a briefing card, as shown in Figure 5. The briefing card provides a summary for every opportunity and contains the following categories of information:
- Activities
- Sales team
- Contacts
- Competitors
- Attachments
- Products
- Parties involved

Figure 5
Briefing card displays the summarized view of an opportunity
You can select one category at a time and view respective information. If you change the information here, the opportunity also reflects these changes. Each category contains a link to jump directly to the opportunity overview screen. For example, if you select the category Activities, clicking on All Activities takes you to the opportunity overview page in which you can view and change information.
Application Setting Options
Sales managers and other users with appropriate authorizations may access other PPM settings. The main ones are Quota Planning Management and Opportunity Churn Rates Management. Other settings include those for the progress rate and speed status.
Quota Planning Management. Sales managers define the sales quotas for teams and employees for the next planning period. These quota values are filtered through various levels of the organizations. Sales managers can define the quotas for the next subordinate level and transfer the planning to the sales manager on the next subordinate level of the organizational hierarchy.
The Quota Planning Management page is divided into Organizational Hierarchy and Quota Planning (Figure 6). The organizational hierarchy expands automatically up to your level. You can see all organizational levels below your own, but no parallel levels. In the Quota Planning section, you can see a list of all the organizational units and employees in your organizational unit.

Figure 6
The sales team uses the Quota Planning Management page to assign and manage quotas
The first line contains the quota for the entire organizational unit. The responsible sales manager, usually a sales manager or a superior, enters this quota in the planning list. The second line is the total of the quotas distributed in the following lines, which could be sales individuals or organizations. The manager can enter the specific quota values for sales individuals or organizations. The sales manager on the next lowest level does the same for his or her organizational unit.
Opportunity Churn Rates Management. An opportunity is considered churned if it fails to become a sale. Generally, a percentage of the total number of sales opportunities is lost from one sales stage to the next.
Every sales representative has an individual opportunity churn rate factor for each sales stage. One sales representative may be good at following up on opportunities at the beginning of the sales cycle, but may lose many opportunities in the closing sales stage. Another sales representative may not be very strong at the beginning of the sales cycle, but closes many opportunities in the later sales stages. The opportunity churn rate factor takes this into account. If the opportunity churn rate factor is high, the sales representative must fill the sales pipeline with more opportunities to meet the target.
Sales managers need to take the sales team’s and individual sales representatives’ churned opportunities into consideration when planning sales quotas and total sales targets. The rate at which opportunities churn is measured as a percentage value of the total number of opportunities. Sales managers can manage opportunity churn rates by entering them as percentage values for each sales stage and each sales representative (Figure 7). If the individual churn rates are not maintained then the sales team’s churn rates defaults at the individual sales representative level. The churn rate values are used for calculating the sales targets in the Sales Pipeline pages.

Figure 7
Maintain the expected churn rates for individual sales professionals in the Opportunity Churn Rates Management page
Other settings. Sales managers and other users with appropriate authorizations can access the Option page, shown in Figure 8, to adjust the following settings and key figures:
- Progress status: This defines the level of progress that is assigned to an opportunity, depending on the length of time an opportunity spends in each sales stage. The Progress Status Settings value defines the level of progress of each opportunity. This helps monitor the status of opportunities through the sales pipeline.
- Speed status: This defines the minimum length of time an opportunity should spend in a sales stage. It helps determine if some opportunities are moving too fast and skipping sales stages or rushing through the sales pipeline. The Speed Status Setting compares the date of the last sales stage change with the previous change. For example, if the duration of the last sales stage was equal to or less than the minimum number of days entered as a setting on the Options page, the opportunity is assigned a Fast status.
- Sales cycle duration: This is a time value that indicates how long a sales cycle lasts from the first sales stage to the final sales stage. The system uses this value to calculate the targets in the Sales Pipeline view.
- Planned growth factor: This reflects the sales target. The basis for calculating the target line is the sales target defined for a specific time frame. If the opportunities sales cycle is very long, opportunities may close in a calendar year in which another, higher target is relevant. If the target is higher in the future, the sales representative has to adapt to this by filling the sales pipeline with other opportunities.
- Opportunity churn rates: Default values appear in the Opportunity Churn Rates Management page in Figure 7. You can change these as your business needs require.

Figure 8
Additional settings allow sales managers to define progress settings, speed status settings, and opportunity churn rates at the organizational level
PPM Configuration
PPM is based on existing SAP CRM processes. As a result, it uses the configuration settings for areas such as business partner, organizational management, authorization profiles, activity management, and opportunity management. In addition to the standard configuration, follow these four steps to set up PPM.
Step 1. Define and assign analysis sales stages: Using transaction SPRO, go to SAP Implementation Guide>Customer Relationship Management>Transactions>Settings for Opportunities>Define Sales Cycles and Sales Stages. First select Define Analysis Stages to enter the associated sales stages followed in your organization. Figure 9 shows an example with three sales stages. After you define the sales stages, select Assign Sales Stages to Sales Cycles and define the sequence and probability associated with each stage, as shown in Figure 10.

Figure 9
Shows defined sales stages to be associated with an opportunity

Figure 10
Define the sequence and probability associated with opportunity sales stages
Step 2. Set the application flag. PPM is available for SAP CRM on-premise and SAP CRM on- demand. SAP CRM on-demand essentially uses the CRM suite in the background, so this setting identifies if the PPM application is for the on-demand or on-premise environment. Follow IMG menu path SAP Implementation Guide>Customer Relationship Management>Transactions>Settings for Opportunities>Set Application Flag. The default value of 0 for the App.Indicator field corresponds to SAP CRM on-demand. Set this value to 1 to use PPM in an SAP CRM on-premise environment (Figure 11).

Figure 11
Select the respective application
Step 3. Activate PPM HTTP services. You must activate multiple HTTP services for PPM to help make all the functions available for use to sales managers and sales reps. This is done via transaction SICF (HTTP service hierarchy maintenance). Table 1 lists the services you need to activate.
| crmcmp_ppm |
Main component for PPM |
| ppm_advsearch |
PPM: Advanced search |
| ppm_bcard |
PPM: Briefing card |
| ppm_charts |
PPM: Target to date and closing date charts |
| ppm_chart_pers |
Business Server Page (BSP) Web Dynpro component |
| ppm_churnrate |
PPM: Opportunity churn rates |
| ppm_dynsearch |
BSP Web Dynpro component |
| ppm_opplist |
Pluggable opportunity list for PPM application components |
| ppm_options |
PPM: Options |
| ppm_pcr |
Sales pipeline change |
| ppm_printview |
PPM: Print page |
| ppm_quota |
BSP Web Dynpro component |
| ppm_savechanges |
Save changes from simulation |
| ppm_org_model |
BSP Web Dynpro component |
| wcc_ppm |
Work center page component for PPM |
|
| Table 1 |
HTTP services to activate for PPM |
In addition to these HTTP services, you must maintain the Business Document (BDoc) entry BUS_TRANS_MSG to monitor the Sales Pipeline Change view. Open view SMW3FDCUST using transaction SM31 and select and save the entries listed in Table 2.
| BDoc type |
BUS_TRANS_MSG |
| Context |
mBDoc notification (additional calls) |
| Counter |
60 |
| Service ID |
|
| Function name |
CRM_CHANGE_HISTORY |
| Active |
Set this indicator |
| Mobile |
Do not set this indicator |
|
| Table 2 |
Entries required to monitor the Sales Pipeline Change view |
Step 4. Set up Internet Graphics Service (IGS). For PPM graphics or bar charts to work, you need IGS version 7.00, patch 4 or higher. First, execute the administration report for the IGS by using ABAP Editor (transaction SE38). Insert the Remote Function Call (RFC) destination into the field provided, as shown in Figure 12. The system displays a status page with IGS, in which you can find the appropriate version. If the version is not 7.00 patch 4 or higher, contact your IT department to install it.

Figure 12
Enter the RFC destination to set up IGS
Now PPM is ready to use in the on-premise CRM application. PPM aims to provide the value to the entire sales organization, so that sales managers can set the direction and monitor the progress and sales reps can review and analyze individual performance, identify the goals in the sales pipeline and quota, and take required actions to achieve quotas. Overall the management and sales team work collaboratively in one integrated tool to achieve the organizational targets.
Seema Thomas
Seema Thomas is a solution manager in the CRM solution management group of SAP Labs, LLC. She has been involved with CRM on-demand since 2005. Seema has more than 10 years of SAP experience in customer project implementations and development projects in many different capacities, including functional, technical, and project management roles. She has a bachelor of engineering degree in computer sciences from Birla Institute of Technology and Sciences in Pilani, India. Currently, she is studying for her MBA at Villanova University.
You may contact the author at seema.thomas@sap.com.
If you have comments about this article or publication, or would like to submit an article idea, please contact the editor.


