1 minute read

By Kumar Singh, Research Director, SAPinsider
Supplier Selection Problem: Ranking of Suppliers
In the real-world, sourcing executives generally have a large pool of suppliers to select from. In terms of leveraging analytics, the problem of ranking suppliers (pre-qualification) represents a class of multiple criteria optimization problems that deal with the ranking of a finite number of alternatives, where each alternative is measured by several conflicting criteria.
Explore related questions
Ask SAPi
In this article, I will be sharing several multiple criteria ranking approaches for the supplier ranking problem, namely, the pre-qualification of suppliers.
In the pre-qualification process, which is generally Phase I, readily available qualitative and quantitative data are collected for the various suppliers. This data can be obtained from trade journals, the internet, and past transactions to name a few sources. Once this data is gathered, these suppliers are evaluated using multiple criteria ranking methods. The decision-maker (DM) then selects a portion of suppliers for extensive evaluation in Phase II.
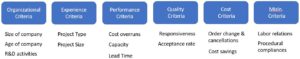
Examples of criteria:
The sourcing professional will determine the criteria based on the unique sourcing objectives but based on my experience, below are some criteria that can be used:
Suggested Analytical Methods
Each method has advantages and limitations and a sourcing professional will need to collaborate closely with their Data Scientists to evaluate which methods will suit their unique needs. Suggested methods that we will touch upon are below. I will explain them at a very high level in this article and will follow-up with detailed articles describing each of these in detail in separate articles.:
I. LP Metric method
II. Rating method
III. Borda Count
IV. Pairwise comparison of criteria
V. Analytical Hierarchy process
I. Lp Metric Method
In Mathematics, Lp represents the distance between two vectors x and y. In the context of supplier ranking, the ranking of suppliers is done by calculating the Lp metric between the Ideal solution and each vector representing the supplier’s rating for the criteria. The ideal solution represents the best values possible for each criterion from the initial list of suppliers. Since no supplier will have the best values for all criteria, the ideal solution is an artificial target that can’t be met. The Lp metric approach computes the distance of each supplier’s attributes from the ideal solution and ranks the supplier’s based on that distance- The Smaller the better.
II. Rating (Scoring) method
Rating is one of the simplest and most widely used ranking methods under conflicting criteria. In this method, first, an appropriate rating scale is agreed to. The scale should be clearly understood by the decision-maker (DM) to be used properly.
Next, using the selected scale, you need to provide a rating for each criterion. The same rating can be given to more than one criteria. The ratings are then normalized to determine the weights of the criteria.
III. Borda Count
This method, named after Jean Charles de Borda, a French Physicist, follows the following logic:
Step 1: Let us say we have n criteria. In this step, the n criteria are ranked 1 (most important) to n (least important):
Criterion ranked 1 gets n points, 2 nd rank gets n-1 points, and the last place criterion gets 1 point.
Step 2: Calculate the sum of all the points = n(n+1)/2
Then calculate the weight for each criterion as shown below:
Criterion ranked 1 = n/s
Criterion ranked 2 = n-1/s
Using this approach, calculate a total weight for each supplier based on all criterion
IV. Pairwise comparison of criteria
When there are many criteria, it will be difficult to rank order them precisely. In practice, pair-wise comparison of criteria is used to facilitate the criteria ranking required by the Borda count. Here, the decision-maker is asked to give relative importance between two criteria Ci and Cj, whether Ci is preferred to Cj, Cj is preferred to Ci or both are equally important.
When there are n criteria, the decision-maker has to respond to n(n-1)/2 pair-wise comparisons. Based on the decision maker’s response, the criteria rankings and their weights can be computed using the following three steps:
Step 1: Construct a pairwise comparison matrix. As an example, if there are five criteria A,B,C,D and E, the matrix will look something like this (1 indicates that the criteria is more preferred)
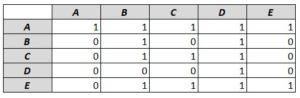
Step 2: Compute the row sums for the matrix
Step 3: Rank the criteria based on row sums and compute their weights. Ex: If for Row A, Row Sum = 5 and the total of Row sums for all rows = 15, then Wa = 5/15
Note: Scaling criteria values
One drawback of the ranking methods discussed so far is that they use criteria weights that require the criteria values to be scaled properly (we assume that they are already scaled). In practice, supplier criteria may be measured in different units. Some criteria value may be very large while others may be small. If the criteria values are not scaled properly, the criteria with large magnitudes would simply dominate the final rankings, independent of the assigned weights.
V. Analytics Hierarchy Process
The Analytics Hierarchy process is a multi-criteria decision-making method for ranking alternatives. Using AHP, you can assess not only quantitative but various qualitative factors as well, such as financial stability, trust level etc. in the supplier selection process. The buyer establishes a set of evaluation criteria and AHP uses these criteria to rank the different suppliers. Basic principles of AHP are:
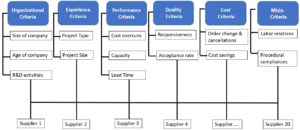
- Design a hierarchy – Top Vertex is the main objective and bottom vertices are the alternatives. Intermediate vertices are criteria/subcriteria (which are more and more aggregated as you go up in the hierarchy),
- At each level of the hierarchy, a paired comparison of the vertices criteria/sub-criteria is performed from the point of view of their contribution weights to each of the higher level vertices that they are linked to.
- Uses both rating AND comparison method.
- Uses pairwise comparison of alternatives with respect to each criterion and gets a numerical score for each alternative on every criterion.
- Computes total weighted score for each alternative and ranks the alternatives accordingly.
More Resources
See All Related Content
Turning data chaos into data value with SAP Data IntelligenceIn the age of big data and business intelligence, data catalogs are becoming the essence of metadata management, helping and guiding data users better understand their data and its importance. A data catalog focuses on data assets and connects the data sets within the assets with its related metadata to help the users of the data understand it better. Data Catalogs are rapidly and widely being integrated into the systems across industries to manage the extensive data at hand. Integrating and implementing data catalogs is the first step in data governance. A Data Catalog can be defined as a collection of metadata, typically used for data management with query access to help analysts and other data users find the data that they need. It serves as an inventory of available data within the organization and provides access to evaluate the fitness of data for its intended use. With all its benefits, the effectiveness of the Data Catalog depends on the central capacity to provide a collection of metadata.

AI-driven Masking with SynthesizedSynthesized showcases a video demo of its SAP-native test data management platform, highlighting fast sensitive data detection and masking while preserving document relationships, business rules, and full end-to-end test data lifecycle capabilities in one solution.
1 minute read
How to use Tricentis Tosca with Synthesized for Intelligent Test AutomationIn this video, you’ll learn how Synthesized and Tricentis Tosca integrate to solve one of the hardest problems in SAP testing: getting reliable, compliant, production-like test data exactly when your automated suites need it. The walkthrough shows Tosca calling Synthesized APIs and workflows to generate, mask, or subset SAP datasets with the right business logic and referential integrity preserved, then injecting that data into test cases that span core processes across SAP and connected applications. Instead of waiting on manual data preparation or reusing stale records, teams can stand up fresh, governed test data as part of their CI/CD pipelines.
You’ll also see how this approach fits into an enterprise continuous testing model for SAP, where Tosca orchestrates codeless, AI-powered automation and Synthesized handles the underlying test data layer across SAP GUI, Fiori, and S/4HANA scenarios. The result is higher coverage and more stable regression suites, because your tests always run with valid IDs, entities, and end-to-end scenarios that behave like production but keep PII out of non-production systems. This session is ideal for SAP QA leaders, SDETs, and DevOps teams who are looking to modernize SAP quality and testing with AI-native tools
1 minute read

Bringing Data Access and Analysis to all Businesspeople with Phocas SoftwareIn the current corporate landscape, aligning data across the enterprise for robust decision-making presents a continuous challenge for many organizations. The vast amount of data that organizations produce is not only difficult to handle, but also even more challenging to analyze due to data complexity or a lack of in-house expertise. Additionally, with businesses drawing data from various sources including ERPs, finance, sales, or operational systems, and external parties, complexities escalate and complicate the integration of comprehensive business data. Manual integration of data is an arduous and time-intensive task, often requiring specialized skills. Consequently, only a few people hold and comprehend this data, which creates a bottleneck when there is a need for quick decisions and effective analysis based on accurate, real-time data. Integrating a business planning and analytics platform can significantly reduce the hassle of data management. Phocas Software provides a business planning platform that manages all your data and is compatible with more than 200 data sources enabling financial and operational data integration. Phocas is an all-in-one platform for business planning and analytics - connecting everyone with the information they need, when they need it.
6 minute read