Although BW provides filter and drill-down functionality, many BW users miss the pivoting functionality of MS Excel. The author provides seven easy steps to enable drag-and-drop functionality in SAP BW queries. This gives end users the power to optimize their BW queries.
I know from many talks with FI/CO end users who are running BW that they want to continue using the pivoting functionality of MS Excel.
BW reporting provides filter and drill-down functionality, and with the help of SAP Business Explorer (BEx), you can use the toolbar or select items from the context menu for BW reporting. However, some FI/CO users may not like the menu of the regular SAP BEx Analyzer, which analyzes data in reports. Instead, they prefer the drag-and-drop functionality of Microsoft Excel, which can add new characteristics (customer or invoice numbers) or key figures (net value, margin in percent, number of sold items) to rows and columns.
I'm going to show you a way to use the MS Excel pivot functionality based on SAP BW data. Using Excel functionality, I'll connect to SAP BW and query the data of a specific SAP BW query or InfoCube. You'll see how to combine the filter functions provided by Excel with the authorization and data quality functionality of BW.
Note!
An InfoCube in terms of BW is an object storing data of a predefined area such as CO-PA. Data from R/3 is loaded to BW InfoCubes to take the performance load off R/3 for reporting matters. A query is a report definition that can be run by users without any knowledge of a programming language. It describes characteristic objects such as account types, customers, and invoices numbers, and key figures such as net value, quantity, and number of invoices.
The following steps assume that you are running an SAP BW system and that you are able to access your SAP BW system with the help of a valid BW user ID and password. I tested the functionality with MS Excel Office 2000 and higher. For steps 1 and 2, SAPGUI must be installed at your PC client. Your BW administrators must have already defined InfoCubes and queries that you can connect to. Names and data content should be provided by your BW team.
Although you can go directly to the InfoCube to obtain your data, I think a better approach is to use queries with the help of SAP BW Query Builder. The reason is that all restrictions and authorizations are based on the query and you don't have to be concerned about authorization in your pivoting queries. Therefore, the following steps and explanations are based on a specific query rather than the InfoCube.
Step 1. Open BW Query
Make sure the query can be accessed by non-SAP tools such as Excel. Open the query with the help of BW query builder and select the query properties icon in the upper toolbar. (See Figure 1.)

Figure 1
Selecting the query properties icon
Step 2. Enable the OLE DB for OLAP
Next, select the Specific tab to enable the Release for OLE DB for OLAP functionality for your selected query and select the check box. (See Figure 2.) This enables third-party tools such as MS Excel to directly connect to your query data.
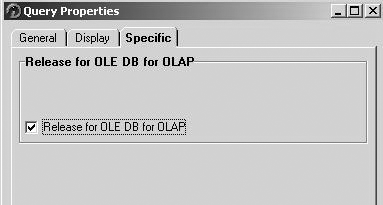
Figure 2
Enabling MS Excel to connect to your query dat
Note!
A word about security concerning OLE DB for OLAP: All connections to the query are subject to SAP BW log-on, query, and data authorization (such as authorization to a specific cost element), so don't worry. This method is as safe as your regular BW queries.
Step 3. Set Up the Data Connection
After releasing the query to OLE DB for OLAP, you can start using pure Excel functionality to connect to the query. Remember, you will not use BEx from now on. You do not need an SAPGUI installation, either. This can be very useful if you like to work from your home office without installing SAPGUI on your PC. However, note that step 2 can be done only if SAPGUI is installed.
Start MS Excel and click the menu path entry Data>Import External Data>Import Data. Make sure that you have a blank Excel sheet available.
After you select the Import Data entry, Excel leads you to the Select Data Source screen where you select the New Source button.
In the upcoming Data Connection Wizard screen (Figure 3) that is responsible for the type of data connection, select the Other/advanced entry. Proceed by clicking on the next button.
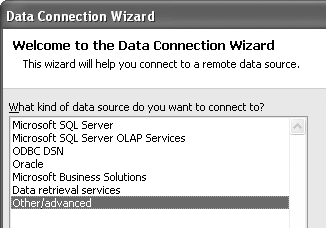
Figure 3
Data Connection Wizar
Select SAP BW OLE DB Provider (Figure 4). It is important to select SAP BW OLE DB Provider because all other entries will not work with your BW system. However, the steps I am describing can be used to connect to all other data providers your company is using.

Figure 4
Selecting Data Link Propertie
Step 4. Connect to the BW Query
It is now up to the user to enter data to connect to the query. (See Figure 5.) In the entry field Data Source, enter the name or IP number of the BW system you would like to connect to. Enter the User name and Password in the appropriate fields. For security reasons, you have to enter the password again when using the query.
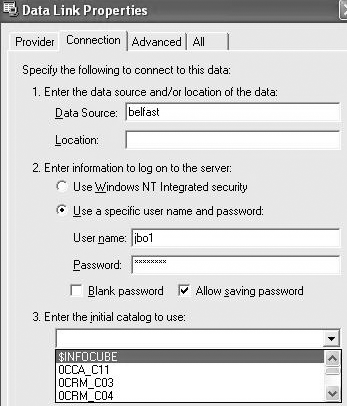
Figure 5
User dialog to enter data to connect to quer
After selecting the query that was released before from the menu, you should test the connection by using the test connection button. The system should tell you Connection succeeded and send you to the log-on after you select the OK button.
Step 5. Set Up the Workbook
The following step has to be done only for the initial setup of your workbook. (In BW terms, the workbook is an Excel workbook that contains at least one Excel sheet and at least one report retrieving data from BW.)
Select either an InfoCube (Figure 6) or query by scrolling down the screen. Queries will appear at the end of the list (Figure 7).

Figure 6
Data Connection Wizard with selected cube from list
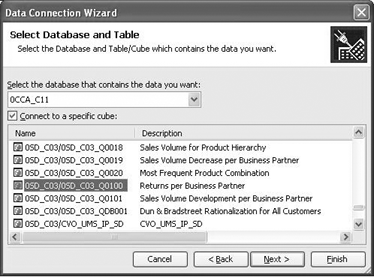
Figure 7
Data Connection Wizard with selected query from list
Step 6. Insert the Query into the Excel Sheet
The last step is to insert the query to the new (blank) Excel sheet by selecting an Excel cell. Now you only have to save your data connection. You provide a name (Figure 8) and click on the finish button to connect to the data provider/ source you just saved.

Figure 8
Data Connection Wizard for defining nam
The step to insert the data into Excel is achieved by selecting the connection you just saved. (See Figure 9.) If you use the described technology for more than one BW query, then the number of entries in this dialog increases. Therefore, it is advisable in the previous step to give names you will remember later on.
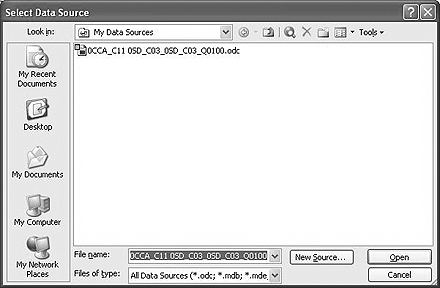
Figure 9
Select Data Source provider for your report
Import the data to the appropriate range in your Excel sheet, as shown in Figure 10. Whatever Excel range you select becomes the upper left corner of your report.
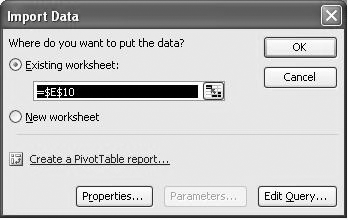
Figure 10
Import data to Excel
Step 7. Run Your Reports and Analyze Your Data
It will take a second (or two) due to performance of your BW system to read the data from BW. You can see the overall result in Figure 11. Note that Excel does not differentiate between data from "normal" Excel sheets and data coming from BW. You can pivot your data by dragging and dropping the information you want into the rows or columns you choose.
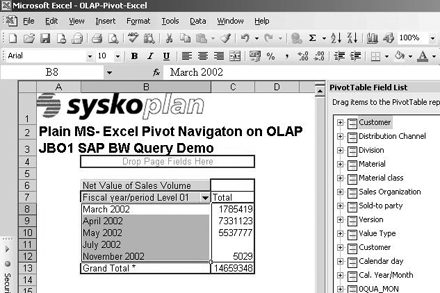
Figure 11
Finished Excel BW pivot repor
All further filters and navigational steps can be achieved by the regular Excel pivot menu (Figure 12). Selection of single or multiple entries affects your data display. For example, you can select only data for March 2002 by checking that box.

Figure 12
Example of a selection list
Joerg Boeke
Joerg Boeke is an SAP NetWeaver BW solution architect and senior consultant working with BIAnalyst GmbH & Co.KG, with 19 years experience in SAP NetWeaver BW, having worked on it since SAP BW 1.2A. He offers significant expertise in the SAP NetWeaver BW reporting area, including design, data integration, data visualization, performance optimization, and the cleanup of existing SAP NetWeaver BW systems. He is the author of SAP BW 7.x Reporting - Visualize your data.
You may contact the author at Joerg.boeke@bianalyst.de.
If you have comments about this article or publication, or would like to submit an article idea, please contact the editor.