Learn the process flow of how data can be extracted from a planning area in Demand Planning to an InfoCube in the SAP Advanced Planning and Optimization (SAP APO) database. Follow a step-by-step procedure to understand the prerequisites, importance, and configuration steps with the help of an example case study.
Key Concept
Demand Planning in SAP Advanced Planning and Optimization (SAP APO) helps to generate forecasts based on historical values. A planning area is one of the most important functions in SAP APO. A planning area is where most of the planning activities take place. A planning area groups together both characteristics and key figures under a single domain. Planning area data resides within liveCache, a database that resides in memory and is used to speed up planning and processing capabilities within SAP APO. InfoCubes are central, multidimensional data models that are used for data backup and reporting purposes in an SAP system. By extracting the data, forecast data is saved in a back-up cube and it can be further used for reporting purposes.
Demand Planning (DP) within SAP Advanced Planning and Optimization (SAP APO) helps to generate forecasts based on historical values. A planning area as you know is one of the most important functions in both DP and Supply Network Planning (SNP). It defines the area where most of the planning activities take place, grouping together both characteristics and key figures under a single domain. To maintain data consistency and to avoid loss of data, it is generally a good practice to back up the data in the planning area to an InfoCube.
SAP APO does not need a separate SAP Business Warehouse (SAP BW) instance as it is built on top of SAP BW technology and uses many SAP BW objects, such as InfoObjects and InfoCubes. Although SAP APO is a separate information warehouse that is needed to support the planning process, planning data can be saved in SAP BW objects such as InfoCubes for better reporting. Figure 1 shows the data flow of saving the planning results in a back-up cube.

Figure 1
Data flow
Business Scenario
Consider an example of an automobile manufacturer that manufactures cars with various models. Past historical sales data is used to carry out forecasting with different statistical forecasting models to develop the baseline forecast. The forecast is carried out at different regions, and these regions are then consolidated at the global level. This forecast is then released from DP to SNP to carry out multilevel and downstream planning. As part of a monthly sales and operations planning (S&OP) process, sales regions, field teams, marketing, finance, and operations share knowledge to improve forecasts through collaborative forecast development.
As part of the DP setup, the following objects are used as characteristics to carry out the monthly S&OP process:
- APO Product
- APO Location
- Region
- Country/Market
- Territory
- Brand
- Model Year
- Forecast Type
- Customer
Prerequisites in DP
Before extracting and saving the data in back-up cubes, you need to set up some objects.
Note
I assume that the reader knows how to set up master data in SAP APO and how to configure basic DP objects. For this article, I include images of the major DP objects that are used in later steps.
Master Planning Object Structure (MPOS)
To create an MPOS execute transaction code /SAPAPO/MSDP_ADMIN. This action displays the screen shown in Figure 2. For my example the MPOS contains Brand, APO Location, APO Product, Customer, Country/Market, Forecast Type, Model Year, Region, and Territory.
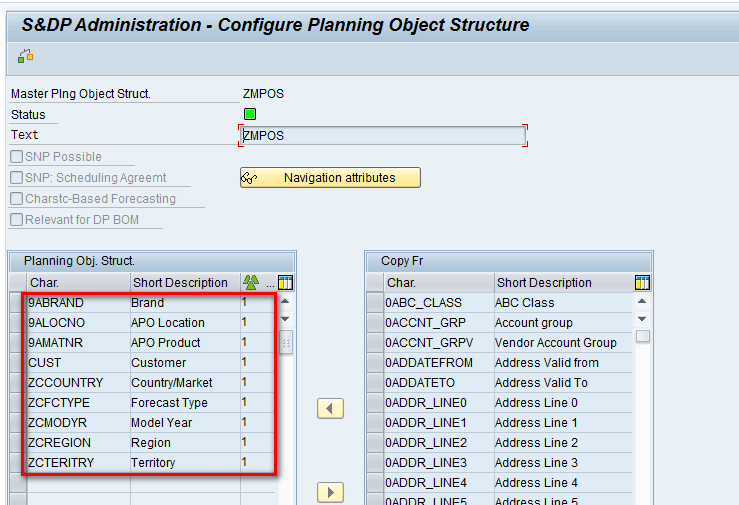
Figure 2
Data entered for an MPOS
Planning Area
To create a planning area, execute transaction code /SAPAPO/MSDP_ADMIN. This action displays the screen in Figure 3. The planning area in Figure 3 is based on the MPOS shown in Figure 2. It contains key figures related to forecast and history as shown in Figure 3.
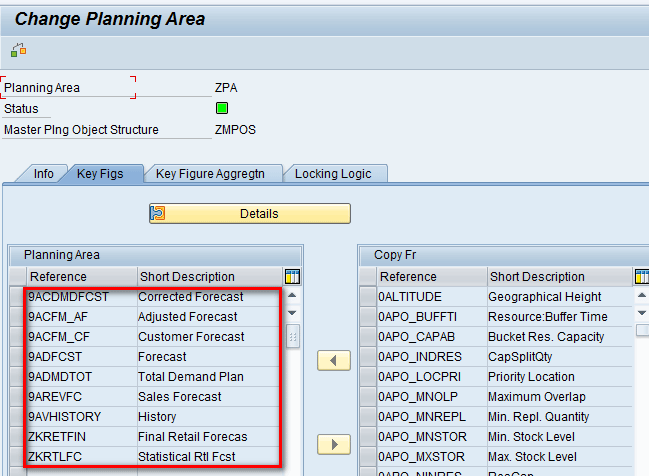
Figure 3
A planning area
Characteristic Value Combinations (CVCs)
Characteristic value combinations (CVCs) are the underlying master data for DP. In any organization with changing business processes, master data also undergoes corresponding changes. To view the CVCs that are present in the MPOS, execute transaction code /SAPAPO/MC62. In the screen the system displays (Figure 4), enter the name of MPOS (e.g., ZMPOS) and click the Display Characteristic Combinations button. This step helps in displaying what CVCs are present in the MPOS.

Figure 4
The main screen to display CVCs
In the next screen (Figure 5), click the No. of combinations button. There is no separate significance for the number of combinations. I describe this step here to show that the CVCs that are later saved in the cube exist in the MPOS.

Figure 5
Find the number of CVC combinations
This action opens a pop-up window that displays a message as shown in Figure 6. This message shows the total records present in this object structure. Click the enter icon (the green check mark) to exit the message.
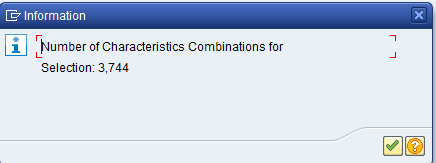
Figure 6
The number of CVCs
The system now returns to the Display Characteristic Combinations screen shown in Figure 5. Click the execute icon.
In the next screen (Figure 7), you can see list of valid combinations. Figure 7 shows the output that shows all records that are present in the MPOS.
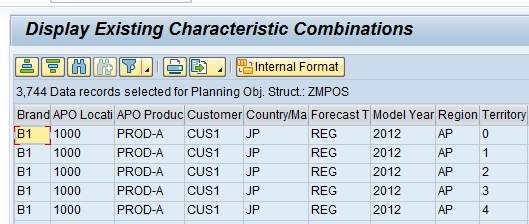
Figure 7
Results from the display of CVCs
Configuration Steps to Extract the Data from the Planning Area
After you create an MPOS and a planning area and create CVCs within the planning area, you need to complete six configuration steps for data extraction.
Step 1. Create a Back-Up Cube
To create a back-up cube to store the data, execute transaction code /SAPAPO/MSDP_ADMIN. This action displays the main screen in which you double-click the planning area (in my example, it is ZPA) as shown in Figure 8.

Figure 8
Select the planning area
In the next screen, click the Extras button and the choose Data Extraction Tools from the list of options as shown in Figure 9.

Figure 9
Data extraction in the planning area
In the next screen, click the Data backup button shown in Figure 10.

Figure 10
Data backup
Note
You can also display the screen in Figure 10 directly by executing transaction code /SAPAPO/SDP_EXTR.
After you click the Data backup button, the system displays a refreshed screen in which you click the Generate InfoCube from planning area button (Figure 11).
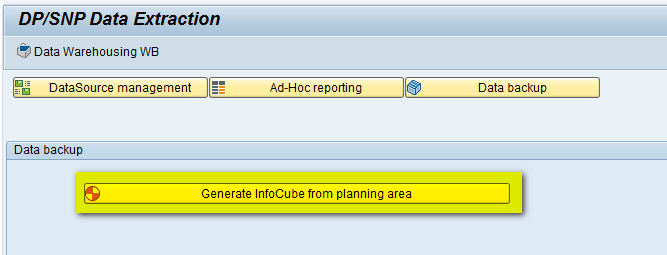
Figure 11
Generate an InfoCube from the planning area
In the next screen, enter a name in the Planning Area field (in my example, ZPA is auto-populated as I am creating a backup from this planning area). For my example, enter details in the InfoCube (ZPA_BACK), Description (Planning Area Backup), and InfoArea (ZTEST) fields and then click the execute icon as shown in Figure 12.

Figure 12
Generate an InfoCube from the planning area and execute it
This action opens a pop-up window that displays a message asking if you want to include key figures for the proportional factor in the InfoCube. Click the Yes button as shown in Figure 13. This step determines whether proportional factor key figure details will be saved in the back-up cube or not. Note that this is an optional step. Proportional factors in SAP APO allow you to disaggregate data from the aggregate level to a detailed one.
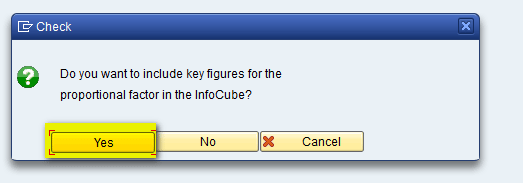
Figure 13
Pop-up message for proportional factors
After you click the Yes button, a pop-up window displays logs indicating that the InfoCube has been generated successfully (Figure 14). Click the enter icon (the green check mark) to exit the message.

Figure 14
InfoCube generated
To see the InfoCube structure that is created, execute transaction code RSA1, and in the screen that appears (Figure 15), click the Planning Area Backup button. On the right side of this screen, another pane opens showing details of the cube you created.

Figure 15
Structure of the generated InfoCube
To see the details of characteristics and key figures that would be saved in the InfoCube, drill down on the Key Figures and Dimension ZPA_BACK1 as shown in Figure 16.

Figure 16
Details of the structure of the generated InfoCube
Step 2. Create a DataSource
A DataSource is a set of logically related fields that is used to transfer data in SAP BW. To create a DataSource, execute transaction code /SAPAPO/SDP_EXTR. This action opens a screen in which you enter the name of the planning area (ZPA) and then click the Generate DataSource button (Figure 17).
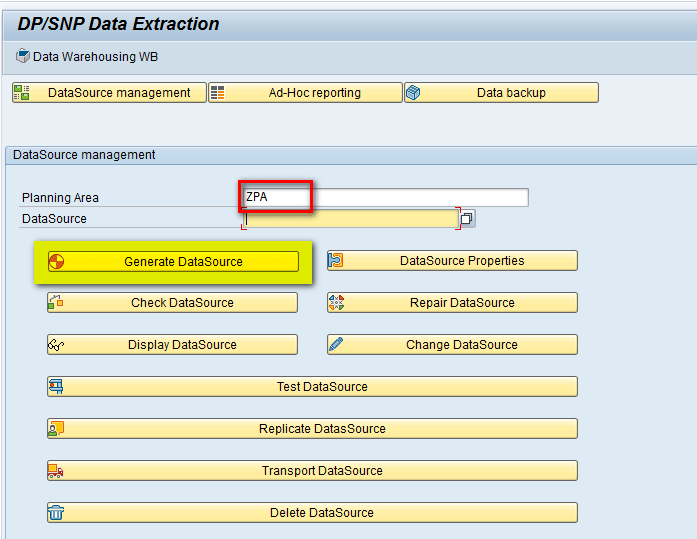
Figure 17
Generate a DataSource
In the next pop-up window, enter a name in the DataSource Name field (ZPA), select the check box No Extraction of Data Records without Key Fig Value, and then click the execute icon as shown in Figure 18.
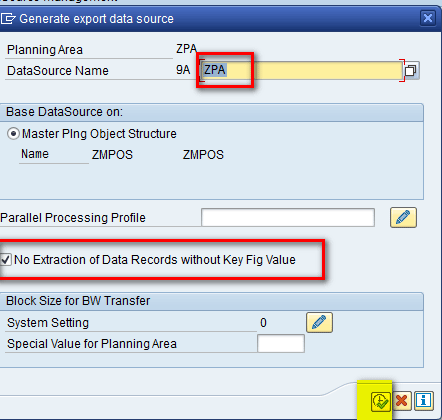
Figure 18
Selection parameters for DataSource name and filter to exclude data records with no value
Note
In accordance with the standard SAP process, the DataSource Name field is automatically prefixed with 9A as shown in Figure 18.
Selecting the No Extraction of Data Records without Key Fig Value check box in Figure 18 helps to prevent the system from transferring data records to InfoObjects in SAP BW if all key figures in the data record have the value of zero. Transferring data records with no value helps in performance as less record volume will be transferred to the cube. This helps in reducing the volume of records which the system transfers, and thereby improves performance
In the Block Size For BW Transfer section of Figure 18, you can mention how many records are transferred in one package. When you are transferring a large amount of data, it is required that you split the data into multiple packages to avoid memory problems, and you can define the number accordingly.
After you click the execute icon in Figure 18, the system displays a list of all fields that are available to be extracted from the DataSource. Note that by default the fields related to Proportional Factor are hidden, and it means that these fields are no longer available in SAP BW for determining transfer rules and therefore cannot be used for generating transfer structures. These hidden fields won’t be transferred from the DataSource to a cube. They are kept as hidden as proportional factors are calculated automatically by the system and hence they are not saved. Click the save icon as shown in Figure 19.

Figure 19
Save the DataSource
In the next screen, note that a message appears at the bottom of the screen indicating that the DataSource was successfully generated. Click the Replicate DataSource button as shown in Figure 20.

Figure 20
Replicate the DataSource
In the next pop-up screen, click the enter icon as shown in Figure 21.
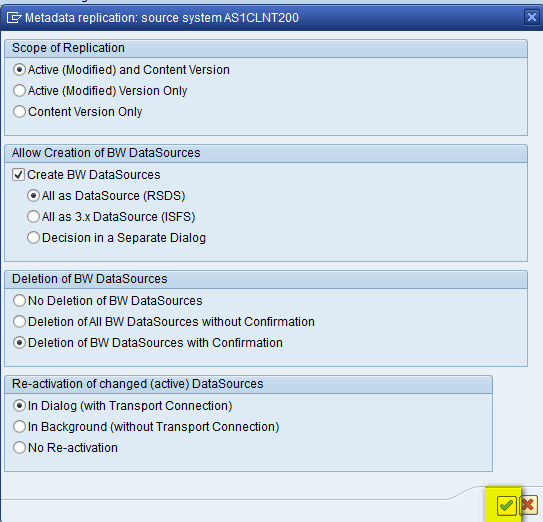
Figure 21
Replicate the parameters in the DataSource
The DataSource is now replicated in the SAP BW system. To check whether the DataSource is created successfully without any errors, click the Check DataSource button as shown in Figure 22. A message then appears at the bottom of the screen confirming that DataSource creation was successful.
Step 3. Activate the DataSource
To activate the DataSource, execute transaction RSA1 and select the DataSource created in above step (9AZPA). Click the display–change icon to go to change mode as shown in Figure 23 (highlighted in yellow). In this step, you go to change mode to activate the DataSource. By default, the system loads the screen in display mode, and therefore, you need to go to change mode.
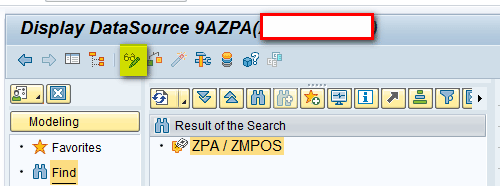
Figure 23
DataSource change mode
In change mode, click the activate icon as shown in Figure 24. Also note that the Version field appears as In Processing.

Figure 24
Activate the DataSource
After activation is complete, note that the Version field’s status changes to green and now appears as Active as shown in Figure 25.

Figure 25
DataSource activated
Step 4. Create a Transformation
In steps 1 and 2 you created a back-up cube and a DataSource as two separate objects. Now both these objects need to be connected to each other. This is achieved via transformation. Transformation helps in connecting the objects in the source to the corresponding objects in the target.
To create the transformation, execute transaction code RSA1. This action displays the screen shown in Figure 26 in which you select the back-up cube created in step 1 (ZPA_BACK). Right-click the back-up cube and click the Create Transformation… button.

Figure 26
Create the transformation
In the pop-up window that the system displays (Figure 27), the first section of the screen showing the target of the transformation is auto-populated. In the second section, showing the source of the transformation, select DataSource from drop-down list of options in the Object Type field. In the DataSource field, enter the name of DataSource that you created in step 2 (9AZPA). Press Enter to save your entries.
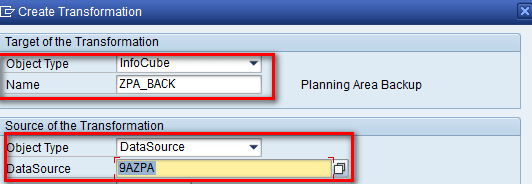
Figure 27
Connect the source and target parameters
In this step you create the transformation connecting the objects created in step 2 as the source and step 1 as the target.
After you enter your data and press the Enter key, the right side of the refreshed screen shows that the system has generated the transformation connecting the fields in the source object (i.e., the DataSource) to fields in the target object (i.e., the back-up cube) via the arrows for each field. Also notice that the Version field is showing a status of New, which means that the transformation is not yet active. To activate the transformation, click the activate icon highlighted in yellow in Figure 28.

Figure 28
Activate the transformation
After activation of the transformation, the Version field shows a status of Active and has a green status indicator as shown in Figure 29.

Figure 29
Transformation activated
Step 5. Create a Data Transfer Process (DTP)
A DTP helps define the process for transfer of data between two objects. In the process of transferring data within SAP BW, the transformations define mapping and the logic of data updating to the data targets, whereas the extraction mode and update mode are determined using a DTP.
To create the DTP, execute transaction code RSA1, and in the screen the system displays, right- click the back-up cube and select Create Data Transfer Process… from the list of menu options shown in Figure 30.
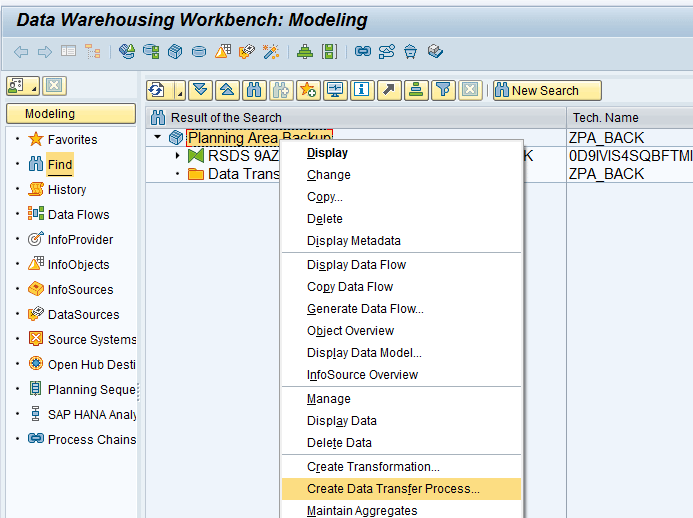
Figure 30
Create a DTP
In the next screen, all fields are auto-populated showing the source and target of the DTP. Click the enter icon as shown in Figure 31.
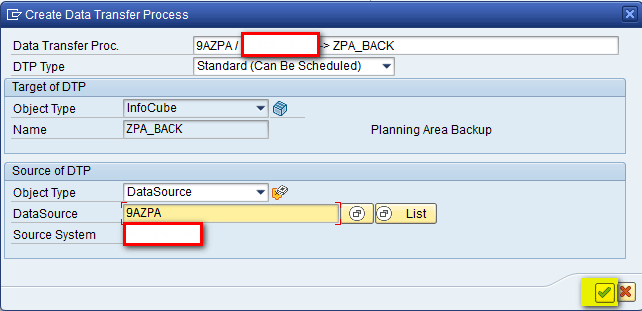
Figure 31
Parameters for the DTP
In the refreshed screen, the DTP structure is created. In the Extraction Tab, there are two options for the Extraction mode as shown in Figure 32:
- Full: It will select and load all the data present in the source based on the defined filters.
- Delta: This will only select and load the records that have changed or that were not initially loaded
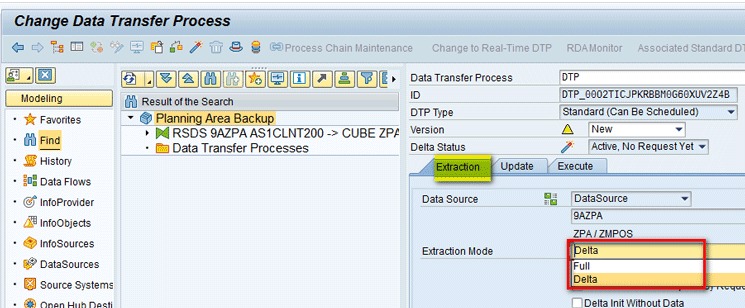
Figure 32
Data extraction mode in DTP
For my example, select the Extraction mode as Full.
In the Update tab, note that the Data Target is showing the InfoCube name (i.e., ZPA_BACK) as shown in Figure 33. Also for Error Handling there are four options that can be used as per business requirements. For my example, select the first option. Also note that DTP Version is showing a status as New and is yellow in color, which means DTP is not yet active. To activate the DTP, click the activate icon.

Figure 33
Activate DTP
After activation of the DTP, the DTP status in the Version field has changed to Active and has a green status indicator as shown in Figure 34.

Figure 34
DTP activated
Step 6. Create an InfoPackage
An InfoPackage is a container that helps in extracting the data from a source and loads it into a temporary area known as a persistent storage area (PSA). Data from the PSA to the target is then loaded via the DTP that was created in step 5.
To create the InfoPackage, execute transaction code RSA1 and select the InfoCube (ZPA_BACK). Drill down and you see the linked objects–DataSource, transformation, and DTP–created in the above steps as shown in Figure 35.

Figure 35
Objects in the InfoCube
To create the InfoPackage, right-click the DataSource and select Create InfoPackage… as shown in Figure 36.
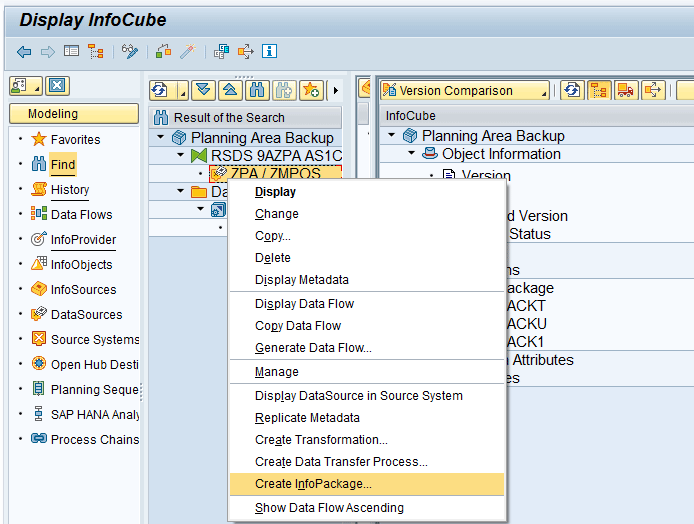
Figure 36
Create the InfoPackage
In the next screen, enter a name in the InfoPackage Description field (e.g., ZINFOP) and then click the Save button as shown in Figure 37.
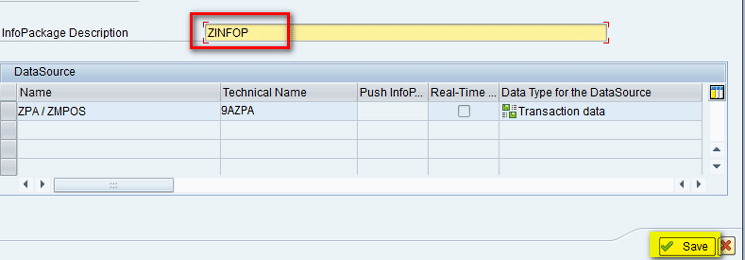
Figure 37
Enter the InfoPackage name
In the Data Selection tab, you can define the selection parameters for different fields present in the DataSource that can be used to filter the selection. These parameters include Customer and Country. Also note that the APO Planning Version has an X in the Required Entry Field column. This X means that a value is needed for this field, so in the field under the From Value column, select 000, which is the active version as shown in Figure 38.

Figure 38
InfoPackage parameters in the Data Selection tab
In the Data Targets tab (Figure 39), you can see the target as the back-up cube that was created in step 1.

Figure 39
InfoPackage parameters in the Data Targets tab
Figure 40 depicts the data flow created in the above steps.

Figure 40
Data flow from the planning area to the back-up cube
Loading Data in the Back-Up Cube
Before explaining how to load the data in the back-up cube, I first show you how to display the existing contents of the cube so that you can see that there is no existing content in the cube before you load the data. To see the cube contents, execute transaction code LISTCUBE. In the main screen that the system displays, enter the name of the cube in the InfoProvider field (e.g., ZPA_BACK) and click the execute icon as shown in Figure 41.

Figure 41
The LISTCUBE main screen
In the next screen, select 000 as the parameter in the APO Planning version field to show the cube contents with this selection and then click the execute icon as shown in Figure 42.

Figure 42
LISTCUBE parameter
In the next screen (Figure 43), the cube output shows that there are no records currently present in the cube.

Figure 43
LISTCUBE output
To execute the data load, execute transaction code RSA1. In the screen that appears, select the InfoPackage that was created in step 6 (ZINFOP), select the Schedule tab, and click the Start button as shown in Figure 44.

Figure 44
Run the InfoPackage
Execute transaction code SM37 in another session and the system then shows that the job has been completed successfully as shown in Figure 45.

Figure 45
InfoPackage job completed
As per Figure 40, data is now to be loaded to the DataSource. To see the data, select the DataSource in Figure 44 (ZPA/ZMPOS), right-click, and select the Manage button from the menu options in Figure 46.
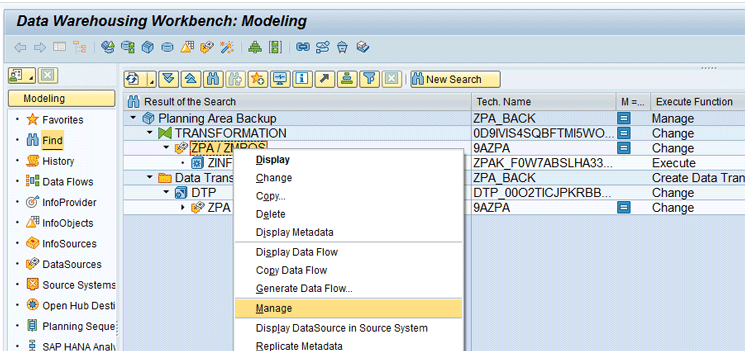
Figure 46
Manage the DataSource
Select the first row and then click the PSA maintenance icon highlighted in yellow in Figure 47.
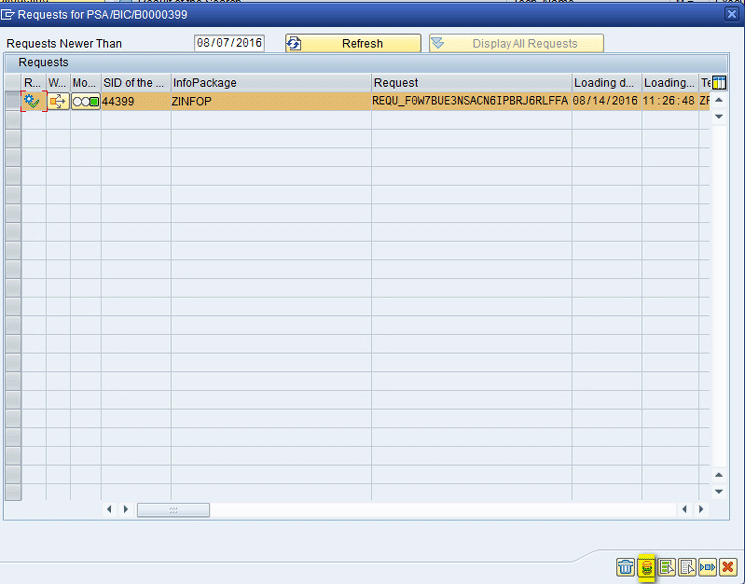
Figure 47
DataSource request selection
In the next screen (Figure 48), the loaded data is displayed. After data is loaded, close the screen to return to the main screen in Figure 44.
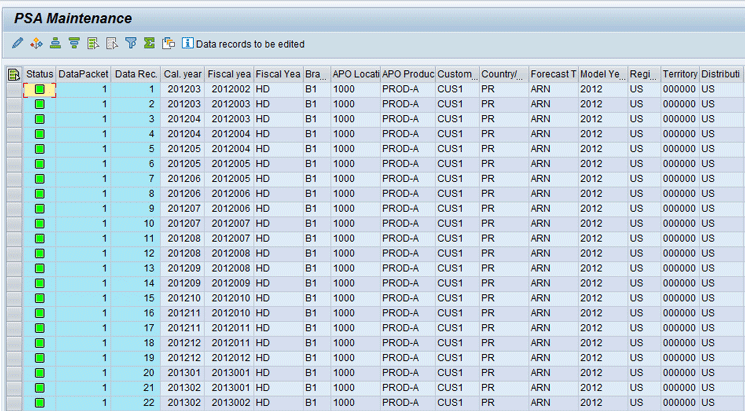
Figure 48
DataSource contents
Now as per Figure 40, to load the data in the back-up cube, you execute the DTP. Double-click the DTP, and in the refreshed screen, select the Execute tab and click the Execute button as shown in Figure 49.
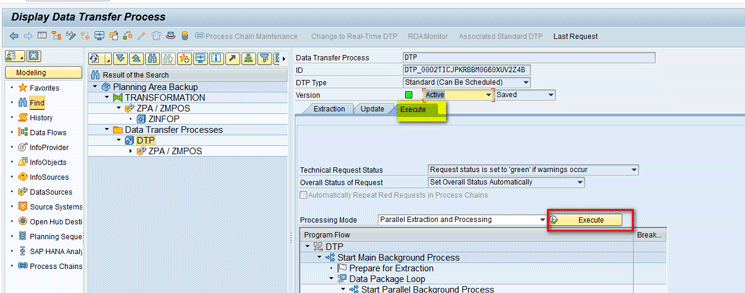
Figure 49
Execute the DTP
After the data is loaded, the status is displayed as green as shown in Figure 50.

Figure 50
DTP load is successful
To see the contents of the back-up cube to confirm if data is loaded or not, follow the same steps in the instructions before Figures 41 and 42. The next screen shows the contents of the cube. This means that data is loaded successfully as shown in Figure 51.
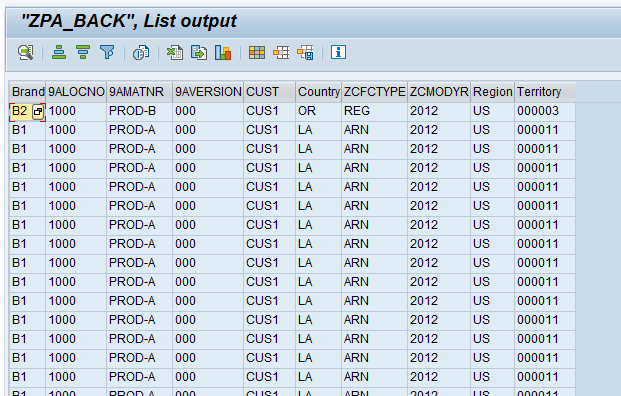
Figure 51
Back-up cube output shows data load is successful
Alok Jaiswal
Alok Jaiswal is a consultant at Infosys Limited.
He has more than six years of experience in IT and ERP consulting and in supply chain management (SCM). He has worked on various SAP Advanced Planning and Optimization (APO) modules such as Demand Planning (DP), Production Planning/Detailed Scheduling (PP/DS), Supply Network Planning (SNP), and Core Interface (CIF) at various stages of the project life cycle.
He is also an APICS-certified CSCP (Certified Supply Chain Planner) consultant, with exposure in functional areas of demand planning, lean management, value stream mapping, and inventory management across manufacturing, healthcare, and textile sectors.
If you have comments about this article or publication, or would like to submit an article idea, please contact the editor.


