Learn step-by-step instructions for how to maximize BusinessObjects dashboard space and provide zoom functionality for an expanded view.
Key Concept
The zoom functionality of BusinessObjects dashboards enables expanded views of any component. This feature helps you visualize and use dashboard space more effectively.
A dashboard is a summarized snapshot of significant business data. Its main goal is to provide all the business information in one defined area. When you are designing SAP BusinessObjects dashboards, using space wisely is vital. Although all dashboard designers strive to show all the information on one page, doing so can result in dashboards cluttered with many different components that are hard to read. The zoom functionality of the BusinessObjects Dashboard Designer tool (formerly known as Xcelsius) is a good workaround for this issue.
This functionality enables developers to add more components and gives users a zoom view, allowing them to see more detail clearly. Unfortunately, this functionality is not provided by the standard SAP system, but it can be created in BusinessObjects Dashboard Designer Dashboards using customization. In this era of iPads, users have become accustomed to being able to use a touch screen to zoom in and view more details. By following the steps outlined in this article, you can implement this zoom functionality in dashboards.
First, I start with an overview of the Dashboard Designer tool itself. Then I show you how to create a sample dashboard using the Dashboard Designer tool, and how to get data ready to be imported into the demo dashboard. I also provide step-by-step instructions for creating a canvas for the demo dashboard, mapping the components, and, finally, how to execute and export the final dashboard into a PowerPoint slide document for viewing.
An Overview of the Dashboard Designer Tool
The Dashboard Designer tool is a very simple and creative tool that SAP provides for creating innovative dashboards using versatile datasets and various interacting components. For the purpose of this article, I assume that the users already have the Dashboard Designer tool installed in their SAP BusinessObjects systems.
Click the Dashboard Designer tool icon

from your desktop to open the Dashboard Designer tool. This action opens the screen shown in
Figure 1.

Figure 1
Open the Dashboard Designer
Click the Blank Model option to display the screen in
Figure 2.

Figure 2
The Dashboard Designer screen and all its components
This tool (screen) is composed of the following parts:
- Object Browser tab – This tab shows all components used in your application and the sequence in which they are laid out on the canvas.
- Components tab – This is shows or contains all the components available in this tool.
- Canvas – This is where you create a layout by adding components.
- Properties panel – This shows all the properties of each component.
- Excel spreadsheet – This is a built-in data source in which you can insert the data or connect a spreadsheet to another data source.
Step 1. Get a Sample Dashboard from the Dashboard Designer Tool
To create this zoom feature you can use the sample dashboards that SAP provides in the Dashboard Designer tool, thus eliminating the effort of creating a new dashboard from scratch.
Click the Dashboard Designer tool icon on your desktop. This opens a default screen (
Figure 2) in which you click File Menu > Template. This action opens the New From Template pop-up window (
Figure 3). Select Layout from the Category box, choose Template 8 in the Items box, and click the OK button.
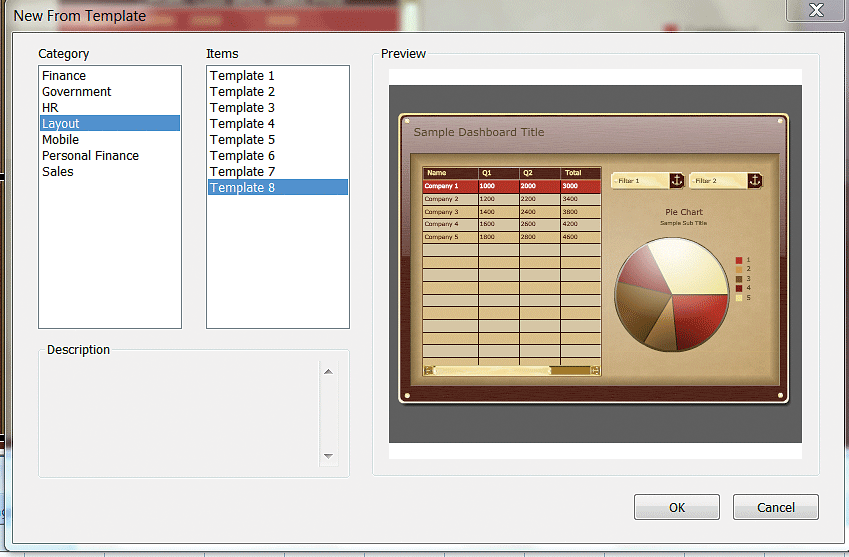
Figure 3
Select the appropriate options to create a sample dashboard
The screen that opens (
Figure 4) shows the Object Browser on the left side, with the components used in the dashboard, and an Excel Worksheet at the bottom.

Figure 4
The components of the new sample dashboard
Step 2. Create Data in the New Excel Spreadsheet
In this article, I use sample data in my example to illustrate. You may copy and paste the same or import your own new data into the Excel spreadsheet. In this example, I use the import option to bring in new data. When using this method, you need to have the source data stored on your desktop. (Click the following link to get a downloadable version of the sample data to use:
data file for zoom-feature download.)
After you download the data file to your desktop, click the Data button in the ribbon of the Dashboard Designer tool (highlighted in
Figure 4). Choose Import from the drop-down list of options that appear (not shown) and a pop-up window then opens (
Figure 5).

Figure 5
Import the data file for the zoom feature from the desktop
Click the Desktop option, select the data for zoom-feature file from your Desktop, and click the Open button. The data is imported into the Excel spreadsheet at the bottom of the screen, as shown in
Figure 6.

Figure 6
The data file is imported from the desktop into the Excel spreadsheet of the Dashboard Designer
To save the new the new sample dashboard, click File menu > Save as > Name [create a meaningful name] > Close. (In this case, I named the file TEST.xlf.)
Step 3. Create a New Dashboard Canvas
The first part of this step is to delete any unwanted (unneeded) components. Because in this scenario I am using the SAP-provided sample, you may delete the unnecessary components that aren’t required for this demo.
In the Object Browser tab (
Figure 4), click the Filter 1 component and delete it using the Delete button on your keyboard. Delete the Pie Chart component in the same way.
The next step is to rename some components with meaningful names to avoid any ambiguity. In the Object Browser tab (
Figure 5), select the Label 1 option and right-click it. In the context menu that opens, select Rename and rename Label 1 as Heading. In this same way, select List View 1 and rename it as Table 1 (
Figure 7).
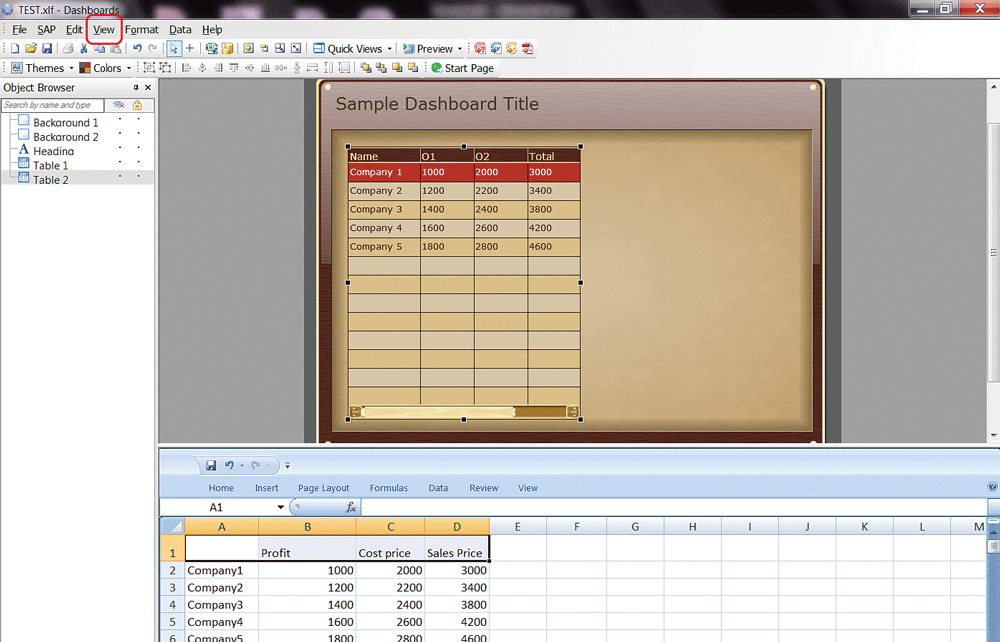
Figure 7
Create new components in the Object Browser tab
Next, you want to make a copy of the new Table 1 component. Right-click Table 1 and click Copy in the context-menu options that open. Then, in the Object Browser tab, hover the mouse over the Object Browser area on the left, right-click, and select the Paste option from the context menu. In the pop-up field that opens give the component a new name—in this case, Table 2.
During this step, when you have one large table to be shown on a dashboard, the zoom feature is helpful. In this example, the table contains 25 rows, and they cannot be shown in the amount of space that the default dashboard screen provides. This screen only allows 10 rows of data to be displayed at a time. If you need to shows 25 rows at a time, the zoom feature comes in handy because it allows you to shrink and zoom in on data, allowing you to get around the 10-row default settings.
In this second part of step 3, I explain how to create the zoom feature so that you can see the data in the 25-row table in my example, and how to add the required components.
Click the View button in the ribbon (
Figure 7) and then select Components from the drop-down list of options. This action opens the Components tab on the left with all the available components (
Figure 8).

Figure 8
The list of all the available components that can be added
Select the Toggle Button component on the left and drag it to the empty canvas on the right, as shown in
Figure 9. (These buttons, by default, are set to Off.)
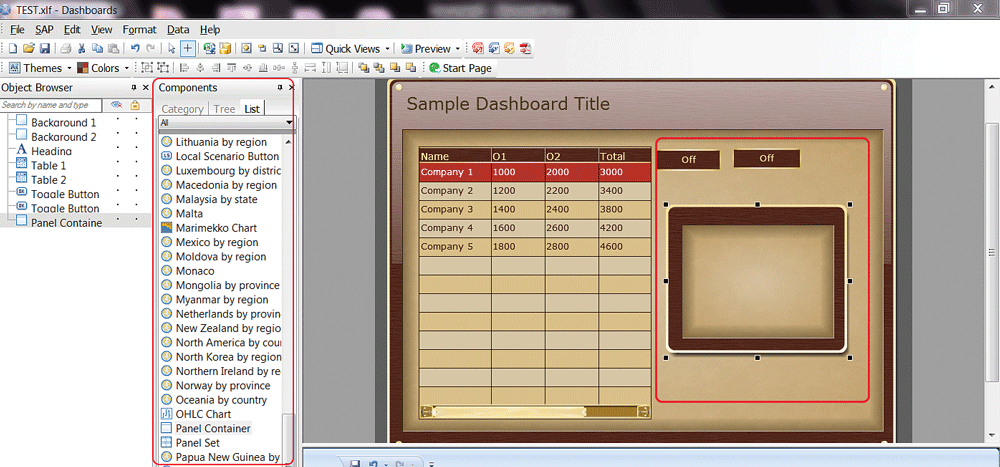
Figure 9
Add components to the canvas
Using the same process, add another Toggle Button component and a Panel Container component. Then save your entries and close the Components tab by clicking the X symbol at the top right.
Next, you want to rename the two new Toggle Buttons and the Panel Container in the Object Browser tab. Right-click each one and rename them as Zoom OFF, Zoom ON, and Zoom View, respectively, as shown in
Figure 10.

Figure 10
Rename the components
Next, you need to resize the Zoom View. Select the Zoom View component on the left (
Figure 10). Then hover your mouse over the Zoom View (box) on the right. Right-click it and hold, and you can drag one of the corners to enlarge all four corners. (This process works the same way as enlarging a box or text box in Microsoft Word.) Enlarge the Panel Container (Zoom View) on the canvas so that it covers the entire screen, as shown
Figure 11.
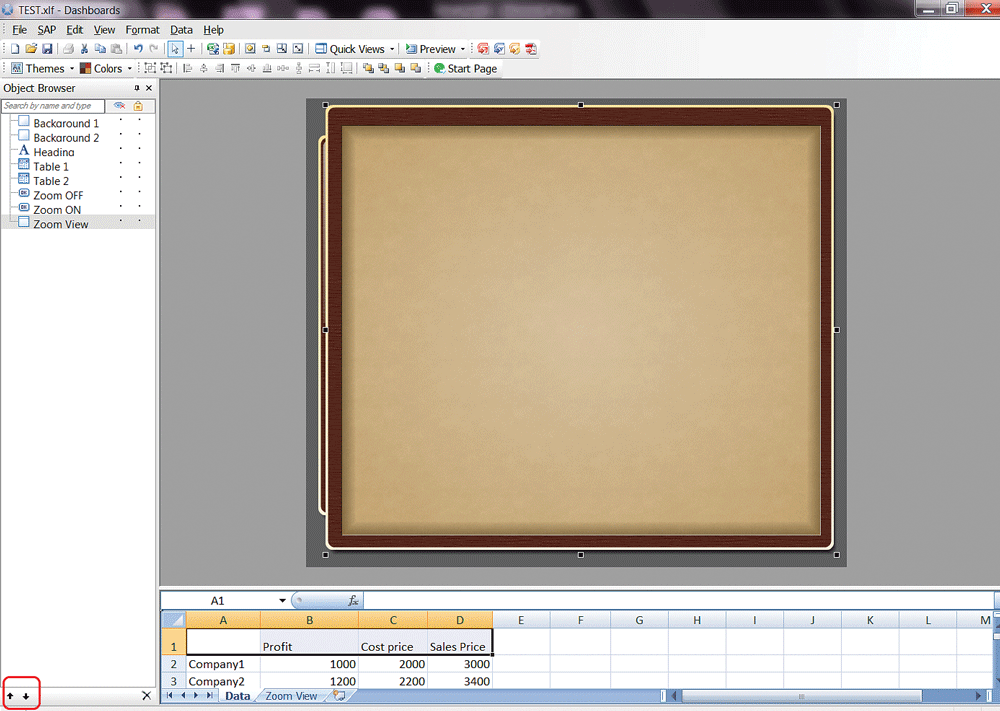
Figure 11
Resize the Panel Container (e.g., the new Zoom View component)
There are two arrows (up and down) at the bottom of the Object Browser tab (highlighted in
Figure 11). They are used for sequencing your components. Use these arrows to arrange the components in sequence, as shown in
Figure 12. After you resort and resize the Table 2 view, a toggle (Off) button appears in the right corner of the canvas as shown in
Figure 12.
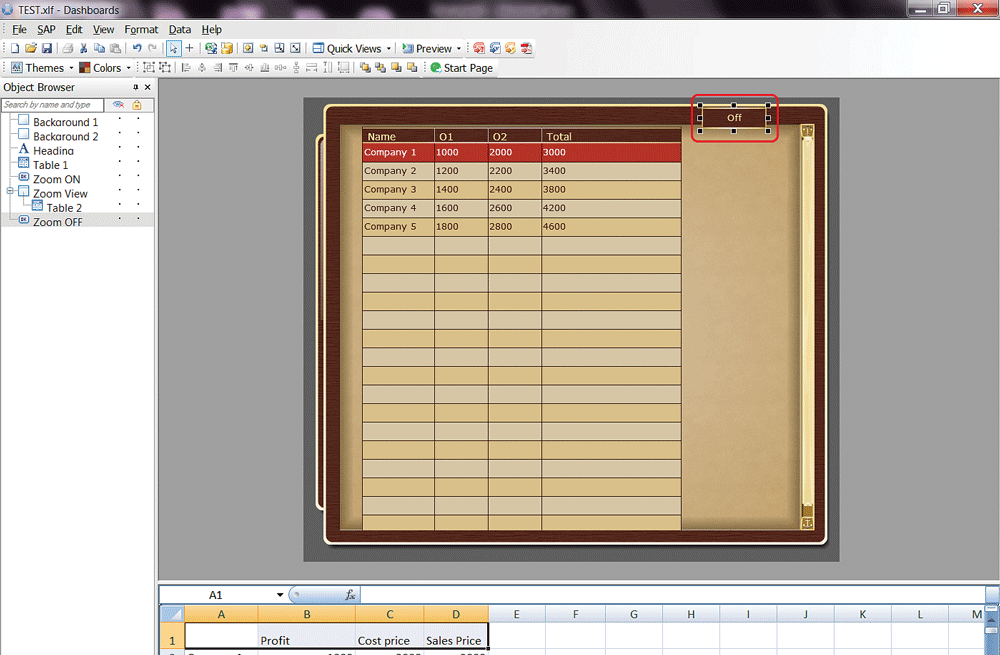
Figure12
Resize and resort the placement of Table 1 and the Zoom OFF button
Step 4. Mapping the New Components
This is the most important step. The mapping of the components refers to the process of mapping the range and properties of the data in the Excel spreadsheet (imported earlier in in step 3) to each of the Object Browser components. In this section, I show you how to configure the different components, map them to a data source, and change their behavior.
Mapping is done in the Properties panel of each component. You can view the properties of each component by selecting it in the Object Browser and right-clicking it. This action opens the properties list as shown in
Figure 13.
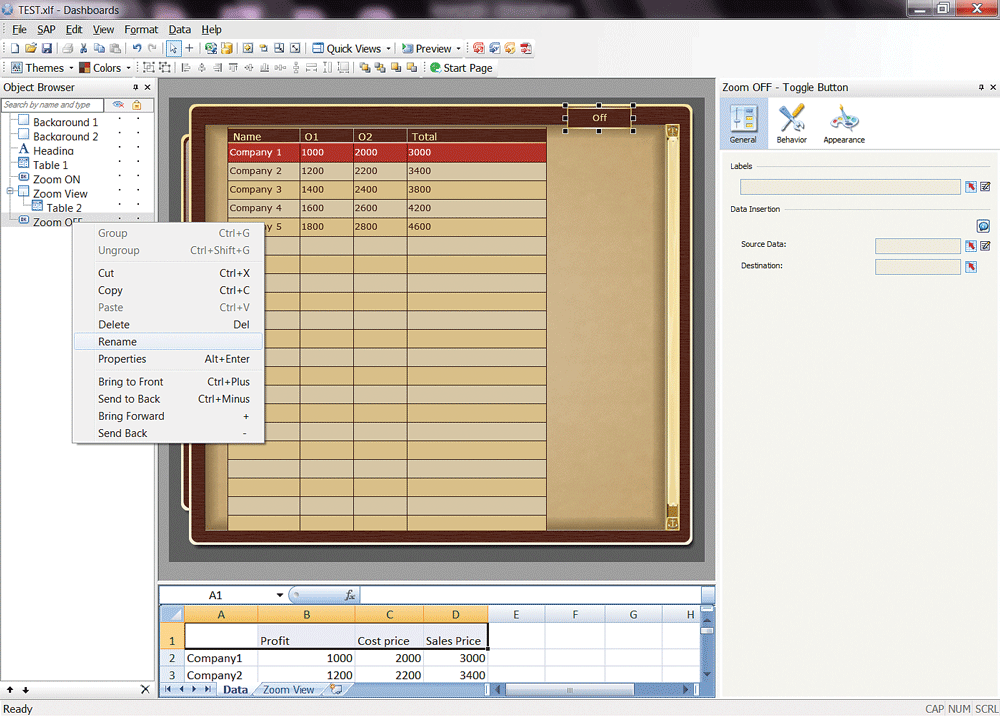
Figure 13
View the properties of the Zoom OFF component
Mapping the Zoom OFF and Zoom ON Toggle Buttons
To show how to map components, I use the Zoom OFF toggle button. Under the Object Browser tab in
Figure 13, select the Zoom OFF component and right-click it. In the context menu that opens, select Properties, click the edit icon

(under Labels) and, in the pop-up window that opens, change the Label Name to Zoom OFF (
Figure 14). Click the OK button to close the pop-up and save your changes.

Figure 14
Configure the label for the Zoom OFF button
Now click the edit icon next to Source Data. A Source Data pop-up window then opens (
Figure 15). Enter 0 in the Source Data column (next to the Off and On entries) and click the OK button to save your settings.

Figure 16
Enter the Zoom OFF destination mapping settings
The third part of this step is to set the mapping destination cell for the data. Under the General tab on the right, you see the Destination field below the Source Data field. Click the mapping icon

next to the Destination field to map the destination cell to the 'Zoom View'!$F$2 cell of the Excel sheet, as shown
Figure 15.
Next, you want to change how the Zoom OFF component behaves. Click the Behavior button (in the upper right section of
Figure 16).
Figure 16
Enter the Zoom OFF destination mapping settings
After you select the Behavior option, the screen below it expands, as shown in
Figure 17. Click the mapping icon (as you did in previous step) next to the Status field to map the status to the cell 'Zoom View'!$F$4. In the Key field (below the Status field), enter the number 1 as there is only one key field.
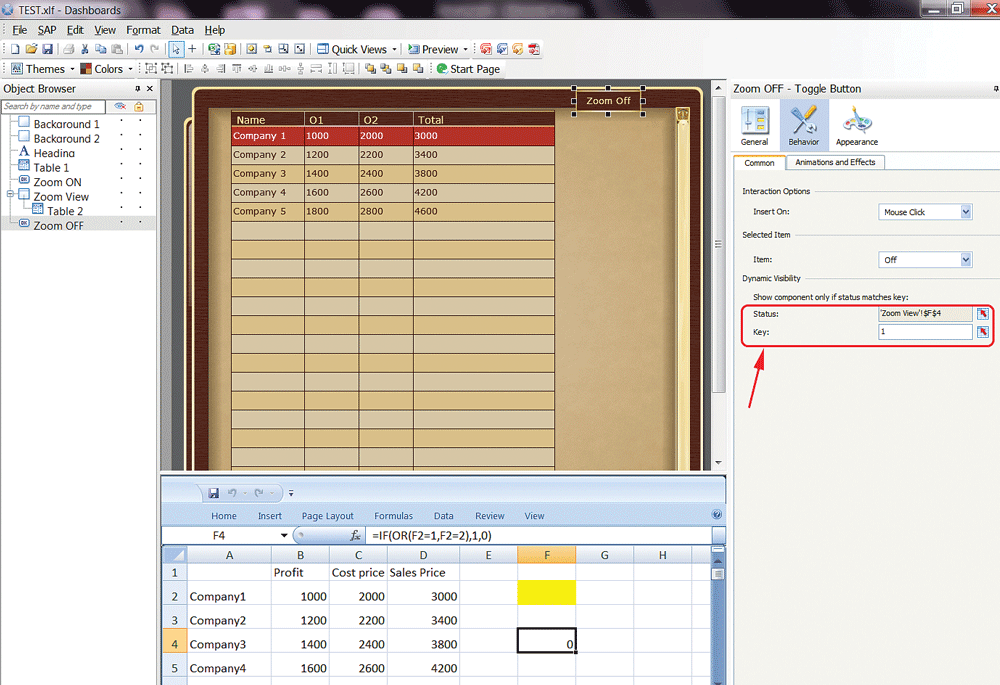
Figure 17
Change how the Zoom OFF button behaves
Next, you want to do the same mapping for the Zoom ON button. Repeat these same steps, except this time select the Zoom ON component from the Object Browser tab in
Figure 17, and instead of entering the number 1 in the Key field in
Figure 17, enter the numeral 0 (zero).
Mapping the Properties of the Components
To map the Zoom OFF and Zoom ON properties to the Table 2 list view, you follow the same steps you followed previously for the Table 1 component, except this time select Table 2 from the Object Browser tab, and right-click it. This action expands the Properties for Table 2 on the right (
Figure 18), where you select the Zoom View component and map the Display Data cell to range 'Zoom View'!$A$1:$E$.
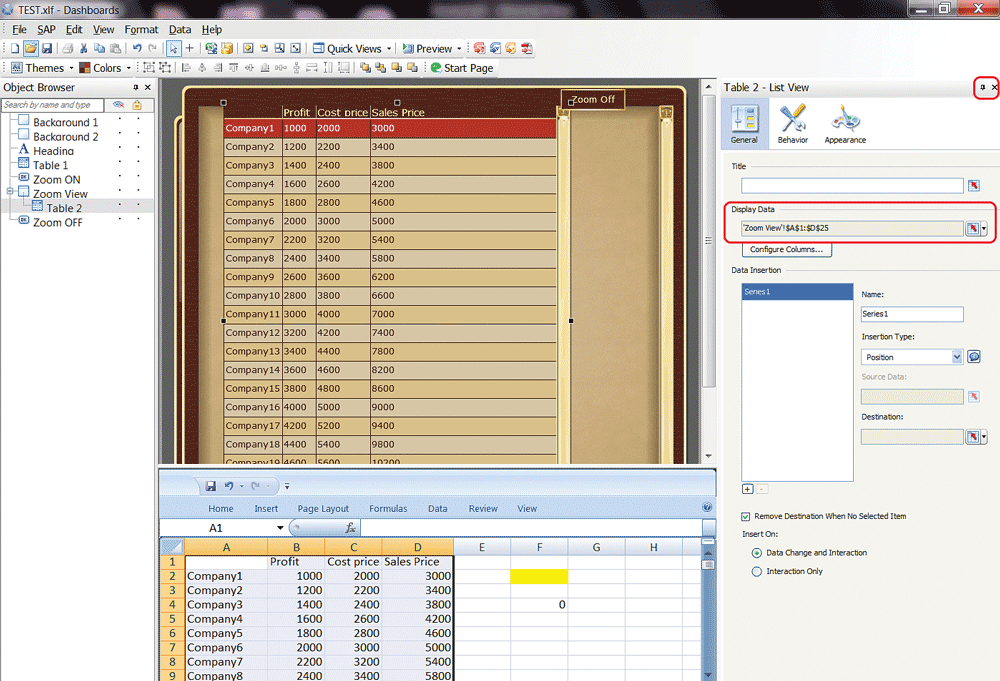
Figure 18
Map the Display Data property of Table 2
Follow the same steps as you did before when changing the behavior for the Zoom OFF and Zoom ON components. The settings for the new behavior for Table 2 are shown in
Figure 19. Here, you want to map the Status field to the Excel cell 'Zoom View'!$F$4. Enter 1 in the Key field and click the X in the top right corner to close the window and save your entries.
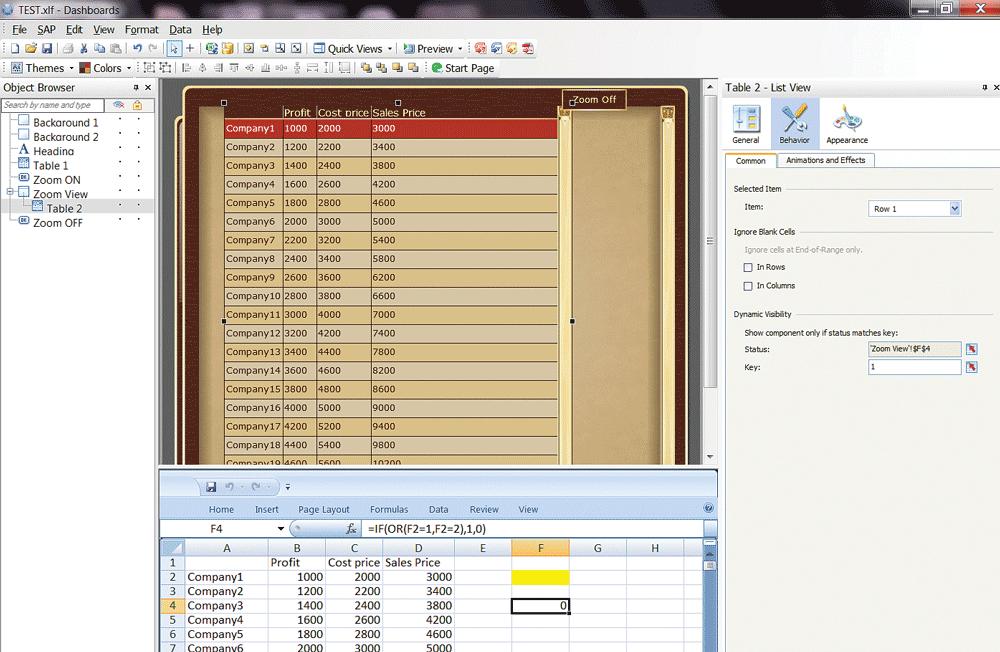
Figure 19
Change the behavior of the Table 2 component
Mapping the Properties of Table 1
To map the properties for Table 1, follow the same steps that you took for Table 2, except this time select Table 1 in the Object Browser tab and map the Display Data cell to range 'Zoom VIew'!$A$1:$E$25.
Mapping the Properties of the Zoom View
Repeat these same steps for the Panel Container Zoom View, except this time select Zoom View in the Object Browser tab (
Figure 20). Now select the General option on the right, add the label Zoom View in the Label field (not shown), and then click the Behavior option. Finally, click the mapping icon next to the Status field to map it to the 'Zoom View'!$F$4 cell, and enter the number 1 in the Key field.
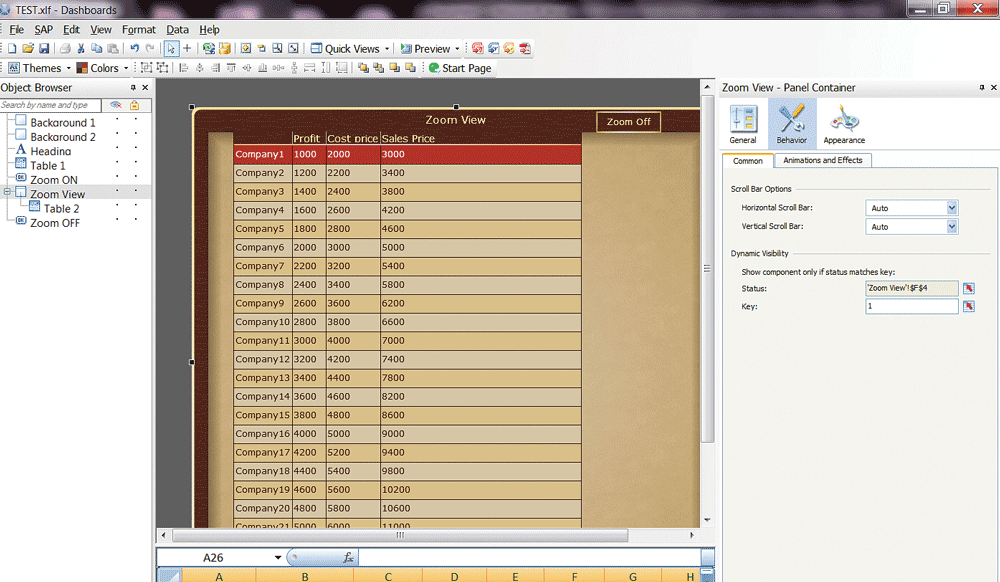
Figure 20
Map to the properties of the Zoom View component
For ease of use, you may hide other components by clicking the hide/unhide * (asterisk) icon next to them. For example, Table 1 can be seen on the canvas clearly, while some other components are hidden using the hide icons, as shown in
Figure 21 (with the arrow).
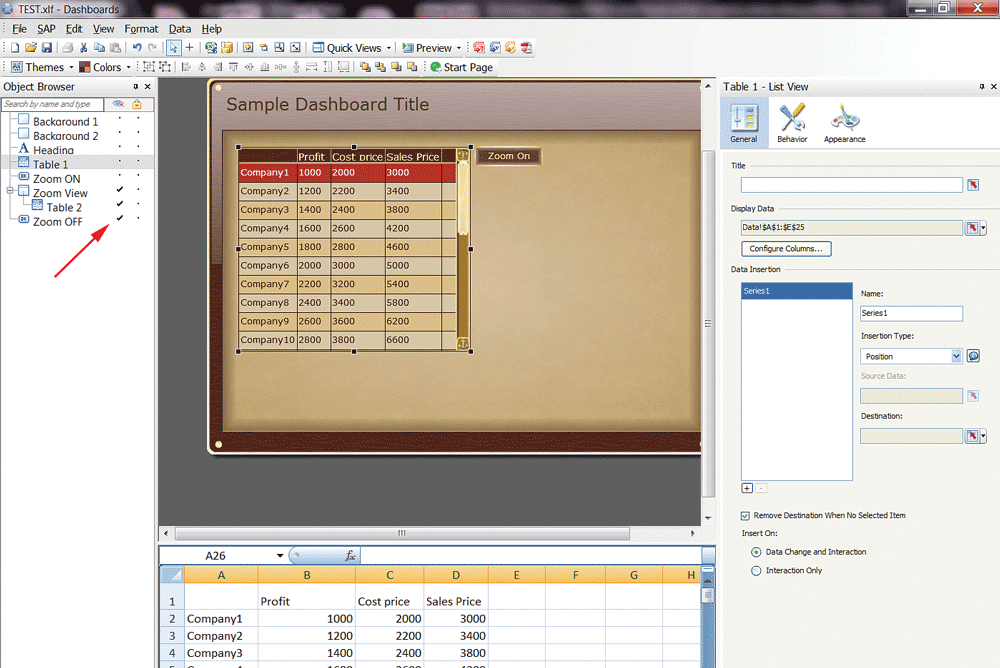
Figure 21
The properties of Table 1 (with other components hidden)
Adding Titles to Dashboards
You also have the option to add a heading (title) to a dashboard by using a text box. In the Object Browser tab, select Heading, right-click it to open the Text context menu, and select the Properties option. In the Text properties (
Figure 22), enter Zoom View Demo (as shown in the figure), and then click the X in the upper right to close and save your entries. You have now added Zoom View Demo as the title for the dashboard.
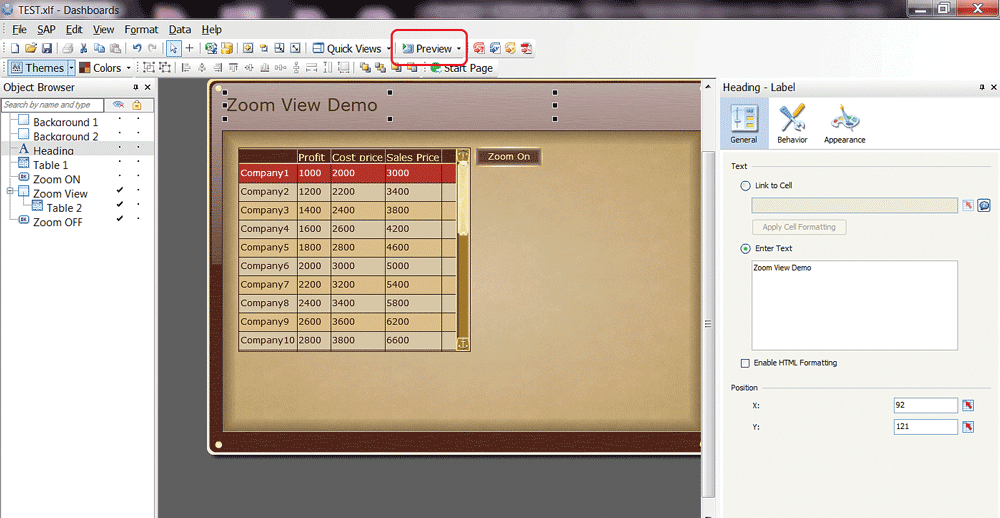
Figure 22
Add the title Zoom View Demo to the dashboard
Step 5. Preview and Execute the Dashboard with the New Zoom Feature
In this final step, you preview and execute the zoom-view demo dashboard. This is the end result that shows how the new zoom component works and looks.
Click the Preview button in the ribbon of
Figure 22 to execute this application (dashboard). This action opens the screen shown in
Figure 23. This screen shows a dashboard with just 10 rows of data—the default option—but with a new Zoom On button.

Figure 23
The default preview view
Click the Zoom On button on the right. The Zoom view opens, and all the rows (up to 25) are displayed in one screen with no scroll bar (
Figure 24).
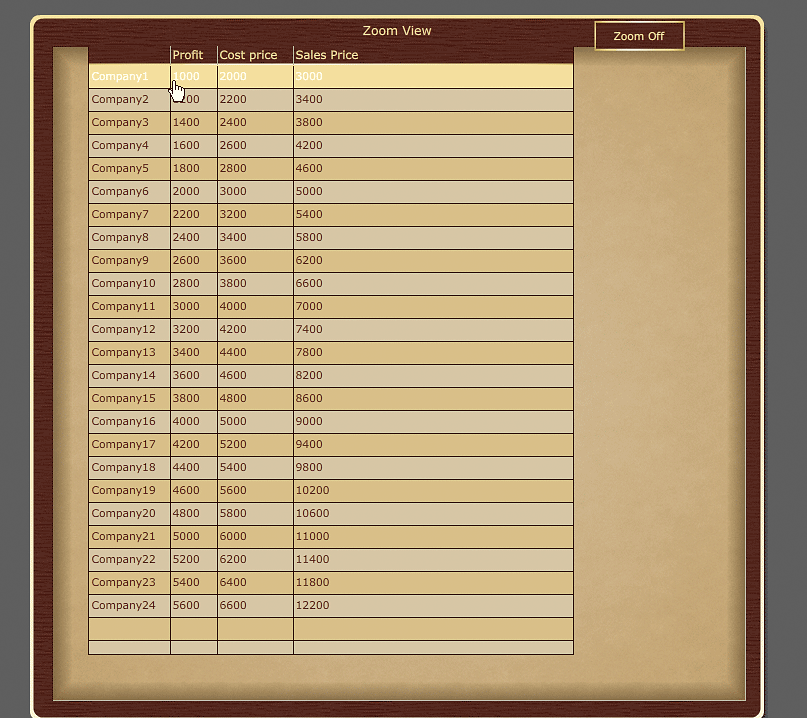
Figure 24
The new zoom view displaying 25 rows of data
After your analysis is complete, click the Zoom Off button, and the screen returns to the original view (
Figure 23).
Neha Lunkad Lodha
Neha Lunkad Lodha is the Team Lead for SAP BusinessObjects and SAP NetWeaver BW at Infosys, in New Jersey. She specializes in SAP NetWeaver BW and reporting using SAP BusinessObjects toolsets and BEx Query.
You may contact the author at
nehalunkad87@gmail.com.
If you have comments about this article or publication, or would like to submit an article idea, please contact the
editor.