SAP offers consulting solutions to enable the first step in demand-driven planning, the strategic inventory positioning. For this you can use the consulting solution MRP Monitor to detect which of your materials should be buffered.
1. SAP Add-On Simulation Safety Stocks
The simulation of safety stocks is a tool for optimizing safety stocks and reorder points as well as the service level. With the SAP SCM Consulting Solution for the simulation of safety stocks (transaction /SAPLOM/SSS), it is possible to simulate the determination of safety stock levels and safety stock values for alternative input values and to compare them with the current material master values. After the data has been compared, the determined settings can be saved in the material master.
The main functions of this SAP consulting solution are:
- Simulation of safety stocks and reorder points for alternative replenishment lead times, service levels, and uncertainties in demand or replenishment (replenishment lead times) based on various methods
- Simulation of safety times for different input values
- Cost-based evaluation of the proposed alternative scenarios (including aggregation and disaggregation functionality)
- Cost-optimized determination of service levels as output from planning (service level optimization)
- Mass maintenance function for safety stock, reorder point, safety time, and service level based on the generated default values
- Scenario analysis for an increase or reduction of specifications (such as service level, absolute replenishment lead time, and forecast error)
- Determination of safety stock and reorder-point-relevant key figures such as safety stock days' supply, implicit service level, and so on.
Two different simulation types are available:
- Scenario Simulation
- SL-Optimization
With the
scenario simulation, it is possible to determine safety stock and reorder point quantities and their values for different service levels, and to compare these with the current quantities in the material master. Additionally, the scenario simulation determines an extensive selection of additional key figures (for example, B. ranges of coverage or delta key figures) that support you in classifying the determined safety stocks and reorder points. After the data has been compared, the quantities determined by the system can be saved in the material master.
To determine the quantities, the following three business safety stock calculation methods are executed for the specified service levels and evaluated based on stock level and stock value:
- Safety stock and safety days' supply (SFT) and reorder point and range of coverage (ROC) according to the ERP standard method, combined with the average method
- Safety stock and safety days' supply and reorder point and reorder point using the optimized ERP method, combined with the average method
- Safety stock and safety days' supply and reorder point and range of coverage according to the advanced method, combined with the average method
In addition to these methods, safety stocks and reorder points are also calculated using the Demand-Driven Planning method.
You can also work with your own formulas. This means that you must determine or program the safety stocks and ranges of coverage as well as the reorder points and ranges of coverage according to your own individual formulas.
The results of these calculations can be saved either in the standard views and/or in the SCM CS views of the material master.
The second operating mode –
service level optimization (
SL-optimization) – enables the optimization of service levels. A prerequisite for using service level optimization is an ABC/XYZ classification of your materials, which you can use, (for example, B.) with the SAP add-on MRP Monitor.
For the individual classes (or their combination options), you specify target corridors (minimum SL, maximum SL) and a target service level. Based on the selected method and the other settings, the system then performs an optimization for each class or class combination and ideally tries to determine the class combination to the specified target service level.
In addition, a method (ERP method, optimized ERP method, advanced method) can be selected for service level optimization, which is used to calculate safety stocks and reorder points for the optimized service level.
The results of service level optimization can then be transferred to the corresponding parameters of the material master.
1.1 The scenario simulation
The safety stock simulation is called using transaction /SAPLOM/SSS (see Image 1).
[caption id="attachment_79944" align="aligncenter" width="703"]
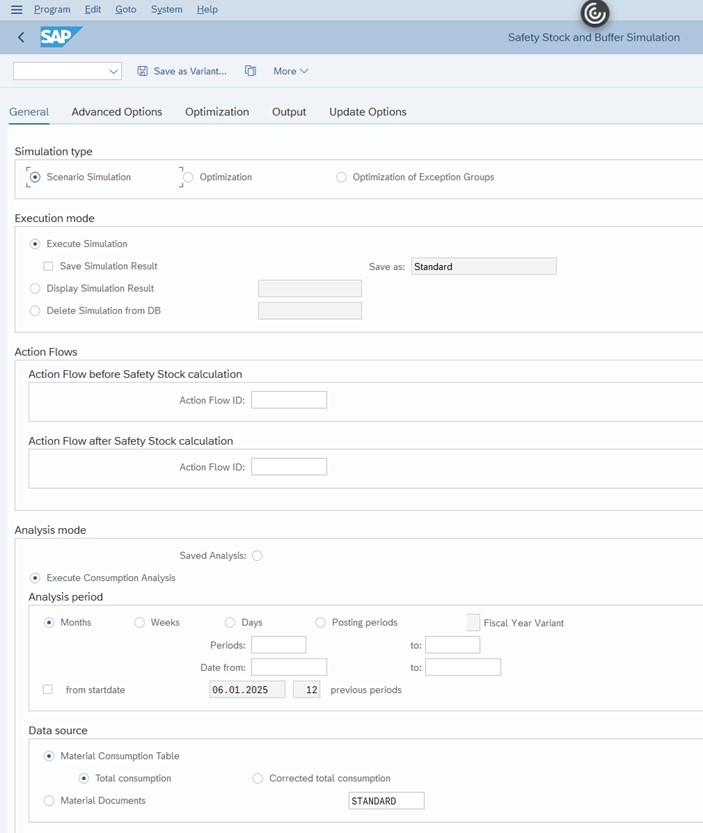
Image 1: Safety Stock and Buffer Simulation: General Tab (Part 1)[/caption]
In the
Simulation Type area, you specify the simulation type with which the safety stock simulation is to be executed. Three simulation types are available:
- Scenario Simulation
- SL-Optimization
- SL-Optimization of Exception Group(s)
SL-optimization of exception group(s) is a special form of SL-optimization. Here, exception codes can be defined on the basis of the SAP material classification (class type – class – characteristic – characteristic attribute). In this case, only the data records that match the exception criteria are considered during SL-optimization.
In the
Execution Mode area of the
General tab, you make the settings for the execution mode of the safety stock simulation. You have the following options:
- Execute Simulation: Simulation runs can be executed online or in the background. The result of a simulation run can be saved.
- Display the result of a simulation: Once you have saved the result of a simulation, you can use this selection option to load the result from the database and display it on the results screen of the respective simulation type.
- Delete a simulation result from the database: You can use this option to delete simulation results stored in the database.
In the
Analysis Mode section of the
General tab, you can specify the analysis mode. You have three options:
- Perform consumption analysis: The consumption analysis analyzes past consumptions that have already taken place.
- Perform requirements analysis: The requirements analysis considers planned requirements that lie in the future.
- Perform Combined Analysis: The combined analysis enables you to combine the consumption trends from the past with the demand trends in the future in an overall analysis.
In the
Analysis Level area, you specify the analysis level (see Image 2).
[caption id="attachment_79946" align="aligncenter" width="703"]

Image 2: Safety Stock and Buffer Simulation : General Tab (Part 2)[/caption]
The levels
plant,
MRP area, and
storage location are available for selection. In addition to the parameters of the standard views, there are additional selection parameters on the
General tab page. In this area, the parameters of the enhanced material master view are available as selection criteria. To display these selection criteria, you must choose the
Other Material Parameters button. This displays the area with the additional selection parameters.
After you have made the general settings, switch to the
Advanced Options tab page (see Image 3).
[caption id="attachment_79948" align="aligncenter" width="703"]
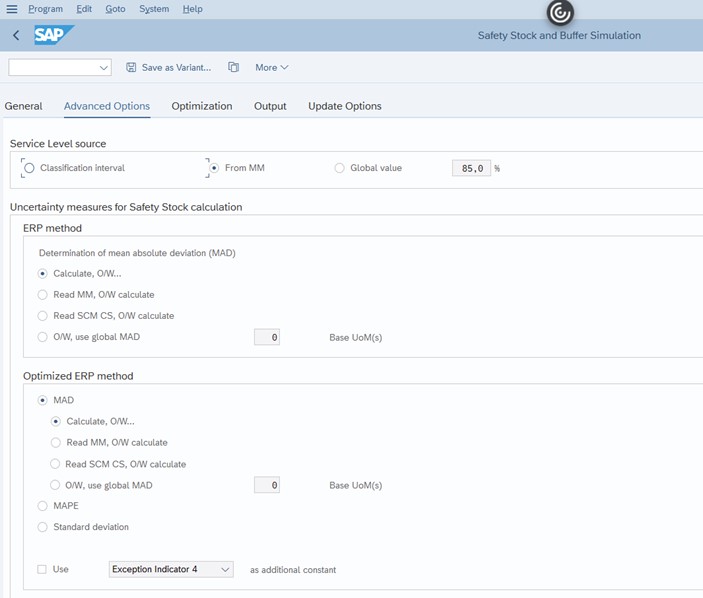
Image 3: Safety Stock and Buffer Simulation – Advanced Options Tab (Part 1)[/caption]
In the
Service Level Source section of the
Advanced Options tab, the source for the service level is defined. The service level is a percentage that specifies which portion of the upcoming requirement is to be covered by the warehouse stock. The higher the service level, the higher the safety stock and reorder point quantities (and the associated costs).
When specifying the service level, you can choose between three different sources:
- Classification Interval: When you choose the classification interval, the system determines the interval and depends on the ABC classification of the material. An interval of 95–99% is simulated for A materials, 90–98% for B materials, and 85–95% for C materials. For materials without ABC classification, only a service level of 90% is simulated (no interval analysis).
- Transferring the service level from the material master: When you select the From MM radio button, the Service Level field in the material master (MRP 2 view) is checked. If the field is maintained, the system uses this value for the calculation. However, if no value is found for the service level in the material master, the system uses the entry in the global value.
- Specification of a global value: When you select the Global Value radio button, that is, when you specify a global value, values between 50% and 99.9% are permitted.
You select the safety stock method for the scenario simulation in the Select
Safety Stock Method (SL-Only Optimization) area of the
Advanced Options tab.
There are four options for this:
- ERP Method
- ERP Method (Optimized ERP Method)
- Advanced Method
- Demand-Driven Planning
For the first three methods, you must define the following parameters:
- Dispersion Measure of Demand: The dispersion measure of demand, also called MAD (mean absolute deviation). The dispersion measure of the demand of a material within the analysis period is calculated. The dispersion measure can also be determined as a percentage deviation; in this case, this is referred to as MAPE (mean percentage deviation). The dispersion measure can be calculated in different ways.
- Dispersion Measure of Procurement: The dispersion measure of the procurement can also be determined as MAD or MAPE. Here, the degree of dispersion of the replenishment lead time of a material within the analysis period is calculated. This calculation is performed using the SAP add-on Replenishment Lead Time Monitor (see section1.6).
- Replenishment lead time: The variability of the replenishment lead time (forecast error of replenishment lead time) is calculated using two key figures that you have defined: based on the RLT planned in the past and the actual replenishment lead time. The system also considers the forecast error of the replenishment lead time that you can save in the material master. You must define how the replenishment lead time is to be determined. There are various options for reading the replenishment lead time from which source.
- Safety factor R: Safety factor R is a multiplier. The default setting for the multiplier is 1.25. Factor R is used in the ERP method and in the optimized ERP method to calculate the safety stocks.
For more information about the safety stock calculation formulas, see the sections1.7.1, Normalverteilung,Sicherheitsbestandsmethoden in SAP S/4HANA und SAP ERP and1.8.3.
In the Demand-Driven Planning area, you make the settings for safety stock determination according to the demand-driven planning method (see Image 4).
[caption id="attachment_79949" align="aligncenter" width="703"]
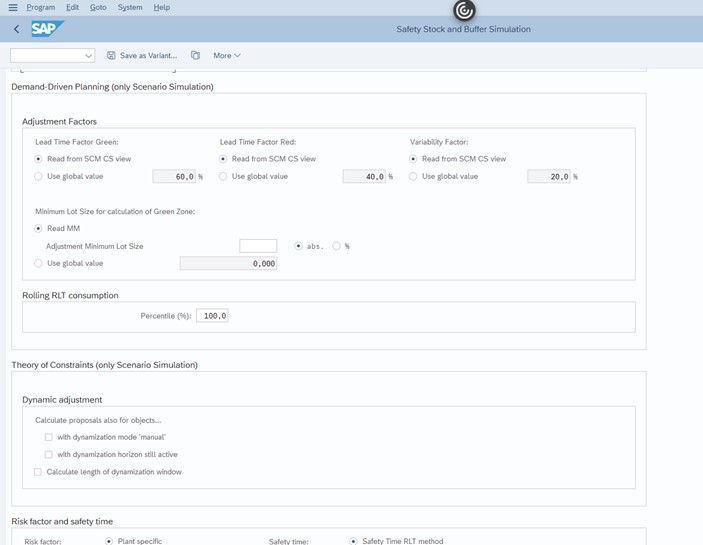
Image 4: Safety Stock and Buffer Simulation – Advanced Options Tab (Part 2)[/caption]
In the safety stock determination according to the demand-driven planning method, the three parameters
RLT factor green,
RLT factor red, and the
variability factor are used. For these three parameters, you can define from where the respective value of the parameter is to be read.
You access the results overview for the safety stock simulation by calling the selection screen and by making the corresponding entries (see Image 5).
[caption id="attachment_79950" align="aligncenter" width="703"]

Image 5: Safety Stock and Buffer Simulation: Results Display in Normal Screen Mode[/caption]
- In the upper left area, you can set the input data for the simulation on the three tabs General, Demand, and Supply. You can vary the input data for the simulation.
- In the lower area, the results of the safety stock simulation are displayed in table form. By selecting a column and then choosing the Total function in the header line of the results display, the consequences of an input data scenario on the inventory side or the cost side can also be determined for a total of materials (for example, B. for all A products).
- In the upper right area, you can see a graphical display of the results. A regression analysis is performed by clicking the Regression button. Regression analysis involves the following steps:
- For the selected material, the safety stock for the service levels 50–99 is simulated and displayed according to the selected method (green dots).
- The safety stock in the material master is determined and a horizontal red straight line is drawn (example above: SB MM = 11).
- If the above line intersects with the average straight line, the X value of the intersection specifies a theoretical service level (example above: TSL% = 65.0).
- The increase in safety stock is shown as a percentage and is displayed in the line chart as a number next to the green point (for example, if the service level increases from 89% to 90%, the safety stock level increases by 6%).
- After calling the graphic, you also have the option of displaying the simulated values.
You can also use the Full Screen Mode button, which is also in the toolbar, to switch to full screen mode (see Image 6).
[caption id="attachment_79951" align="aligncenter" width="703"]
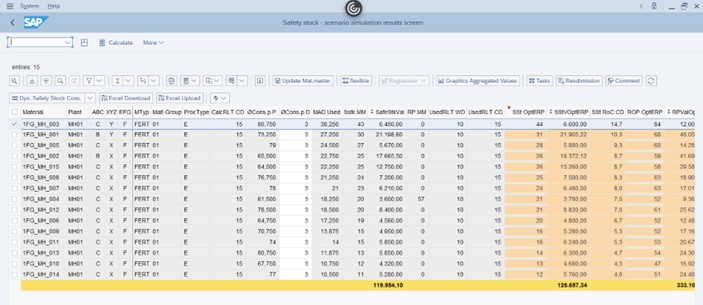
Image 6: Safety Stock and Buffer Simulation: Results Display in Full Screen Mode[/caption]
In full screen mode, the results table is displayed throughout the screen. As a result, you see more entries on one screen. Do you want to return to normal screen mode to B.? Make further changes to the input sizes, choose
Normal Screen Mode.
In addition to determining the optimal safety or The result is also specified as a value (safety stock value) and in days (safety stock days' supply).
You can also calculate your own key figures using your own formulas, and your own alerts can be generated (see Image 7).
[caption id="attachment_79952" align="aligncenter" width="703"]
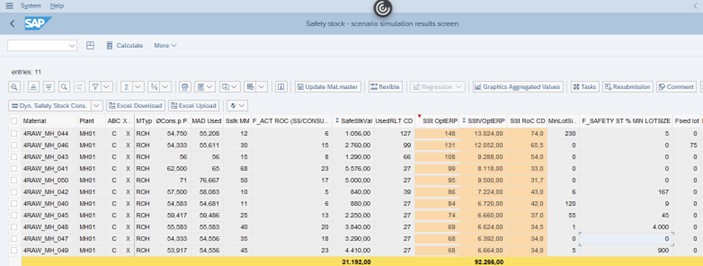
Image 7: Safety stock and buffer simulation: own formulas and alerts[/caption]
Based on the key figure SB MM (current safety stock in green), 2 formulas and 1 alert are displayed.
- In the column F_ACT ROC, the current range of coverage has been determined on the basis of the current safety stock and the average daily usage (column Verb p.T.).
- The column F_SAFETY ST % FIX LOTSIZE expresses the percentage ratio of the safety stock to the fixed lot size.
You can also use this function of individual formulas to implement individual safety stock calculation methods.
More info can be found on
SCM Consulting Solutions | SAP Help Portal or write an email to the author: marc.hoppe@sap.com.