Financials
Follow the stages of the development of a real-life custom solution developed for financial reporting within the oil and mining, utilities, and electric and gas distribution industry in the United States. Compare this improved solution with the same processes executed in SAP ERP Central Component (ECC) Managerial Accounting (CO) and Financial Accounting (FI) modules.
Key Concept
The US
Federal Regulatory Commission (FERC), an independent agency that regulates the interstate transmission of electricity, natural gas, and oil, reviews proposals to build liquefied natural gas (LNG) terminals and interstate natural gas pipelines as well as to license hydropower projects. The
Energy Policy Act of 2005 gave FERC additional responsibilities as outlined in
FERC's Top Initiatives and updated
Strategic Plan. Therefore, a more transparent view of the makeup of the revenue and expenses of utility companies is required.
Companies in the U.S. utility and oil and mining industries face difficulty maintaining the visibility and transparency in financial processes such as planning and consolidation that regulators in the US, especially the Federal Regulatory Commission (FERC), require. FERC compliance is factored into decisions and financial reporting of companies that do business in the utility and oil and mining industries.
I explain how a team from Arellius Enterprises developed a customized solution based on SAP Enterprise Performance Management (EPM) 10.0 that was designed for oil and mining, utilities, and electric and gas distribution in the United States. Our team developed this solution to provide an alternative approach to the same processes that occur in SAP ERP Central Component (ECC) with SAP EPM 10.0. The alternative solution includes Business Intelligence (BI)
components of both BusinessObjects and SAP NetWeaver BW and uses SAP HANA as the database. This solution includes five key components: ALLOC_PERC, OPEX_CAPEX, FINANCIAL_PLANNING, FINAL_PLAN, and CONSOLIDATION.
I review the ECC, Managerial Accounting (CO), and Financials Accounting (FI) functionality that our team replicated using SAP EPM 10.0 and SAP HANA as the back-end database for performance reasons. The development of this functionality was done based on a simplification of the sophisticated SAP ECC processes in SAP ECC CO and FI modules. To develop this customized solution, a detailed assessment and revision of the SAP ECC process had to be performed and an extensive involvement with multiple teams was required to finalize the product that I describe. I review the justification that caused this product to be developed and made available to my clients in the utility industry and available for further customization for a particular company.
From an IT perspective,
Figure 1 summarizes the overall problem that utility companies have complying with FERC reporting regulations. The three components (FERC, Actuals, and Budget), combined with consolidation processes, are critical and mandatory elements in the industry from a transactional point of view. Any other additional information, such as planning and forecasting, depends on these components and is complementary. Maintaining consistent data during different processes (forecast, plan, actual) makes it difficult to compare complex data at these different levels.
This is the challenge finance teams at utility companies face.
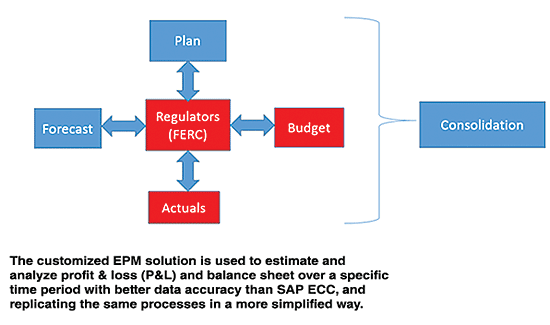
Figure 1
The problem of the US utility industry and its relationship with FERC
In this way, as shown in
Figure 1, all data sets look at FERC as the main area of concern to manage, report, and monitor the different capital and operational expenditures, along with the different lines of revenue. From a mandatory regulatory reporting perspective, actuals and budget are the key data sets that require captured data to be later transformed following the FERC mapping rules to generate a balance sheet and profit and-loss (P&L) statement specific to FERC. Budget and actual data sets also must be aligned with similar information.
Independently from the transactional system and FERC reporting software chosen, if the data set between actual and budget is not aligned (i.e., the data set shares the same structure, master data, data relationships, and components), generating comparison reports would be completely useless because it would be impossible to compare and monitor any of the data sets against each other. The importance of having the same kind of data populated in all the fields that you want to perform reporting is that the core element justified the creation of the customized SAP EPM solution to align the data sets with critical information that was either incomplete or lost as part of the SAP ECC CO and FI process. This is critical information in the US utility sector to identify the charged or charging object in a transaction.
If you cannot compare apples to apples (in other words, if the data itself is not consistent for analysis and reporting purposes), comparing or making sense of any data set (actual, plan, budget, or forecast) is nearly impossible. For example, consider the SAP BI cube contents.
Figure 2 shows the characteristics of transactional data extracted from ECC after the month-end closing process has been completed, and
Figure 3 shows the same processes running the customized EPM 10.0 solution for the same fields. Note that the dimensions in the cubes described in
Figures 2 and
3 are identical. The only difference is the source, and to access the contents of these figures, you must follow the standard procedure in SAP NetWeaver Business Warehouse (BW) associated with transaction code RSA1 and display the data values.

Figure 2
SAP ECC data after month-end closing
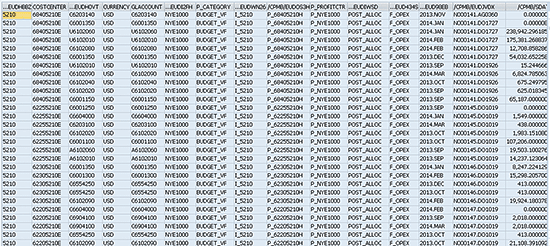
Figure 3
The EPM customized solution performing the same processes as SAP ECC
As shown in
Figure 2, there are empty fields. Most FI/CO experts are content that this is how SAP ECC works, and that’s pre-delivered and expected behavior. However, a US utility company faced a problem explaining each transaction that had empty fields. The fields either had a partner profit center, partner company (trading partner), cost element, partner cost center, or other elements missing. Therefore, defining what had been charged or determining the charging object for a specific transaction was difficult. To further complicate this scenario, when the FERC functionality created as part of the
SAP EPM customized solution also improves the same functionality available in the SAP ECC FERC module since there is no information lost, such as cost center and company code.
Similarly to the SAP ECC FERC module, the SAP EPM 10 customized solution does maintain the profit center information as part of the automatic process.
Any other elements of the partner’s information are lost, and the cost element empty fields shown in
Figure 2 would also be lost because the source of the information was lost already. It is clear that many enhancements in the CO and FI modules are required, but the bottom line is that you need to know partner information, and cost element information must be aligned with the G/L account information or have some kind of relationship so that you understand the origin and destination of the costs, and even more importantly, what rules controlled this allocation.
As shown in
Figure 3, when you work with the SAP EPM customized solution, the system displays the end result of all the calculations executed for the operational and capital expenditures components of the design. If the customized solution’s results are compared with the CO results, that would be an apples-to-apples comparison. However, comparing the customized solution’s results with FI data is asking FI data to do CO reporting as well, and FI is not the standard module for this process.
The benefit of running the EPM 10.0 customized solution is that the equivalent of all the transaction codes from ECC has been substituted by the click-and-run processes. In this way, the EPM 10.0 customized solution performs the CO and FI processes without transaction codes and just uses a data management package, click-and-run functionalities that run all calculations behind the scenes using different scripts, and Business Add-Ins (BAdIs). However, the most important element of using this design with EPM technology is that the partner information (partner cost center, partner profit center, and partner company code) is retained, and the relationship with the G/L account and the cost element is also maintained. ECC has difficulties maintaining this kind of traceability. Note that there are no empty fields in any posting, and it is easy to track the source and target of the cost assignments, allocations, and distributions as part of the operational and capital expenditure (OPEX). Note also that the EPM customized solution supports FI calculations such as roll forward, carry forward, and opening balances.
General Overview of the Customized EPM 10.0 Solution
Figure 4 provides an overview of a generic architecture created for a large US utility company that successfully implemented this design with a high level of complexity and with a combination of industry-specific software, with SAP, other non-SAP systems, and multiple flat files.
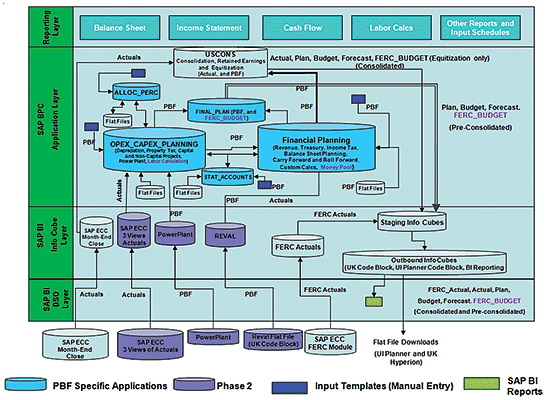
Figure 4
A sample of data flows of a US utility company
The diagram in
Figure 4 shows that you can see different types of transactional data required, such as plan, budget, and forecast, transactional actuals, ECC FERC actuals (which are not the same as transactional actuals), and flat files. When all this information is combined into a solution that combines EPM 10.0, SAP NetWeaver BW, Business Objects, and third-party systems, multiple transformation and extractions are required. Using SAP technology once the process is completed is relatively seamless with SAP HANA.
Figure 5 provides a general overview of the architecture associated with the customized EPM 10.0 solution and describes the data flows associated for creating balance sheet, income statement, performance planning, budgeting, forecasting, and consolidation operations. Note that the FINAL_PLAN model receives information from the Financial and OPEX_CAPEX models. This business model is used to generate the regulatory reporting associated with FERC on a pre-consolidated basis.

Figure 5
General EPM customized solution architecture
In an EPM 10.0 solution environment with SAP HANA as the database, the volume reached close to 5 million processing records alone in the OPEX_CAPEX environment. Previously, the processes took between five and 10 hours when SAP HANA was not the database. Master data processing of the biggest dimension with more than 500,000 members in the
WBS (Work Breakdown Structure) used to take between four and five hours to be processed, while a hierarchy with three different levels was also updated at the same time.
The information managed by each of the business models shown in
Figure 5 is described as follows:
- ALLOC_PERC: This model stores the simplified allocation rules using ECC tables as the source. These allocation rules are populated automatically using BW or BI and SAP HANA integration. The largest number of allocation rules for a particular client is one million that are read line by line depending on the properties set up in the master data fields in the dimensions involved as part of the allocation process.
- STAT_ACCOUNTS: This business model has been created so that you can store statistical accounts and key figures entered into the system, upload them, or store data provided from flat files from other systems. It can be used by both the OPEX_CAPEX and Financial Business models to either trigger processes that read the data stored in the STAT_ACCOUNTS or store data sent from any of these business models.
- OPEX_CAPEX: The main purpose of this business model is for capital expenditures, depreciation, overhead direct and indirect allocation and distribution, cost center allocation, and other intercompany postings. In general, this application is very much aligned with the CO module and extracts only information relevant to CO and in combination with the Project System module components. It is important that in order for the partner information not to be lost, the data must be entered or uploaded into the EPM 10.0 customized solution directly, as shown in Figure 2. ECC data loses partner information during the different month-end closing processes. This business model supports the preparation of the P&L statement, and it is operationally driven by cost element and G/L account information. This business model also separates the data into three views — Pre-burden and Pre-allocated, Burden, and Post-Allocated — depending on the set of processes being executed. These views enable you to see the effect of each of them for comparison.
- Financial: This business model supports the assembly or development of the balance sheet and the final version of the P&L statement. It follows SAP FI rules and receives data aggregated from the OPEX_CAPEX business model as part of the building process. Data transfers between applications are controlled based on the account classification. For example, the financial business model receives only OPEX_CAPEX account information unless otherwise specified. Some of the processes executed in this environment are carry forward; roll forward, which aggregates year-to-date values from a group of accounts to the opening balance of a different account to the next fiscal year; balance sheet automatic calculations from P&L to balance sheet accounts; and company code balancing, which ensures that subsidiaries and corporate parent balance sheet accounts are balanced. All G/L accounts related to the balance sheet reports are entered, uploaded, or stored in this business model. Any P&L account that has no need or relationship with cost centers or cost element information as mentioned in the OPEX_CAPEX business model is also stored in this model.
- FINAL_PLAN: This environment is driven by the needs of the regulatory requirements of a particular client, but in general, it combines the information.
- Consolidation: In this case, consolidation is company specific, as each company and industrial sector is different, but it follows the general expected consolidation functionalities available in EPM 10.0 and also leverages any other development needs.
From an integration and calculation approach,
Figure 6 provides a detailed description of the processes and events that occur inside of each of the business models of the customized EPM 10.0 solution’s functionality. Note the master data maintenance that is necessary to update both properties that control reporting and properties that interact with program execution, such as those required by the burdens and allocation processes to identify senders and receivers, and numerators and denominators.
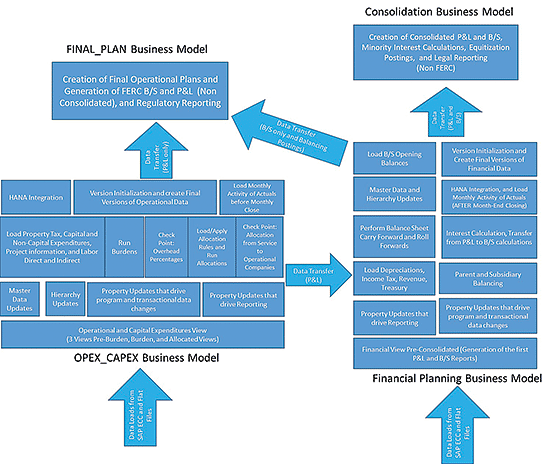
Figure 6
An overview of the calculation and processes inside of the customized EPM solution
Note that the accounting processes have been split in two sections for the OPEX_CAPEX and the financial planning components. On the left side are the OPEX_CAPEX components in which the operational elements of the business have been stored. These components are closely related to the CO elements, but they are linked with a G/L account for each cost element posting. In this way, you can trace from start to finish the impacts based on sender and receiver and the impacts to the P&L in the future, after the allocation process is completed and the transfer occurs to the financial planning business model to start the buildup of the balance sheet and P&L statements.
Similarly, in both OPEX_CAPEX and financial planning, a set of processes was designed to perform a specific process that supports the assembly of the balance sheet, and P&L statements in a pre-consolidated and consolidated basis. Just to clarify, the consolidation business model performs both the actual and plan, budget, and forecast consolidation of data, with the actual data coming directly from ECC after month-end closing. For the plan, budget, and forecast data sets follow processes similar to that of ECC actuals, but in a more simplified and direct way without the use of transaction codes. For FERC purposes, the ECC FERC actual data is not used for the month-end consolidations because it is not transactional data; rather, it is a mapping that occurs in the ECC IS-FERC module. Similarly, the EPM 10.0 customized solution has been created to separate the transactional data from the data generated following the FERC process using a combination of FERC indicators and different cost objects such as WBS, cost centers, and G/L accounts.
Figure 6 shows that the level of calculations is significant and that part of the server performance is spent not only in handling the millions of records generated but also in processing the different calculations. The time that it takes is directly related to the back-end database. From a business perspective, the same processes that require multiple transaction codes in the ECC environment have been created outside ECC, and the alignment between CO and FI data has occurred as previously shown in
Figure 3. The flexibility created in the customized EPM 10 solution is directly related to the simplification of ECC tables created and is more intuitive to drive the process using data management (DM) packages rather than transaction codes.
When you focus attention on data volume, the biggest volume for the architecture shown in
Figure 6 is generated in the OPEX_CAPEX business model. This model is related to the SAP CO module with cost centers, cost elements, WBS, orders, profit centers, and other planning elements. With a data volume of nearly 5 million records per version, the total processing time was close to 10 hours before installing SAP HANA, and the connectivity with Business Objects was not real time. After the installation and optimization with SAP HANA, the processing was improved to five minutes.
A Brief Overview of the Financial Planning Business Model
The EPM Financial Process folder has plenty of pre-delivered functions designed to control, manage, and execute processes that affect the transactional data only that are fully configurable to further customizations. Some of the functions are described as follows:
- Carry Forward: This function is for data values for specific G/L accounts mapping a one-to-one relationship from year to date (YTD) from the last period to the first period of the next fiscal year. It is applicable for a separate process for actual, plan, and forecast.
- Copy Activity Actuals to PBF Versions: This function allows you to move ECC monthly activity information or G/L account monthly value changes loaded from ECC and to copy them to one of the plan, budget, or forecast versions.
- Create Final Version of PBF: This function copies any of the versions from PBF (plan, budget, and forecast) and moves them to the final versions that are locked later on.
- Flat File Upload Multiperiod: This function loads a flat file template using a multicolumn format.
- Execute Balance Sheet Calcs: This function performs balance sheet calculations, moving and adjusting balance sheet accounts based on P&L postings.
- Load ECC Actuals Yearly Opening Balances: This function loads the opening balances from a specific set of accounts into EPM 10.0 from ECC.
- Run Cash Pool Process in Subsidiaries, Interest Calculation, and Parent Pool: This function balances the balance sheet per company at the subsidiary or corporate parent and calculates interest to borrow or lend between business units. This process must be configured to the specific accounts for the client.
Figure 7 shows the programs associated with the EPM Financial Master Data folder that controls master data updates to the dimensions associated with the Financial Planning Business Model (such as update of balance sheet FERC accounts, update of carry forward identifiers that control the carry forward and roll forward processes, and update of the procedure for account classification that controls the accounts used in the OPEX_CAPEX and Financial Planning only environments).
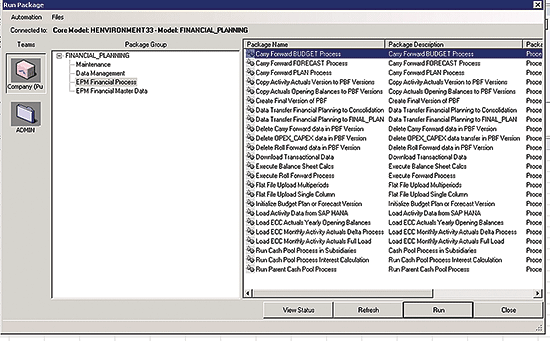
Figure 7
The EPM Financial Process tab from Financial Planning
OPEX_CAPEX Business Model
You can define the OPEX_CAPEX environment as the SAP equivalent of the CO module, including cost center planning, cost element, allocations, overheads, Project System, and pieces of the FERC module all into a single and powerful business model. In addition, for OPEX_CAPEX data, the analysis is mostly driven to P&L calculations rather than balance sheet. However, this does not mean that balance sheet G/L accounts cannot be used as part of the calculations in the OPEX_CAPEX business model, but rather that this process is operational. In this environment, the WBS has been defined as the lowest and most important operational unit to be used to monitor, control, burden (overhead allocation), allocate, and report information. However, it can be more than one object that has different treatment within the environment.
As shown in
Figure 8, most of the processes are related to control the master data, and rules associated with the master data that affect the different dimensions created as part of the OPEX_CAPEX Business Model. Based on these updates, multiple processes are affected such as burdens (overhead allocation), FERC, service to operational companies’ allocation, and partner object information such as partner profit center, partner cost center, and partner company code.
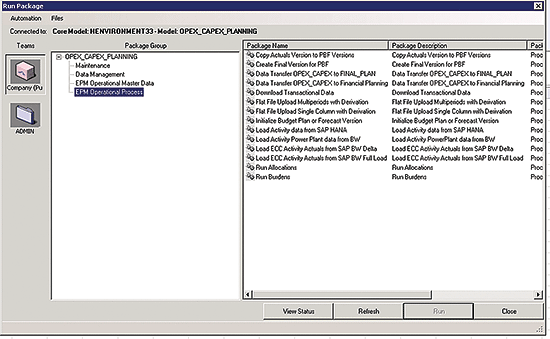
Figure 8
The EPM Operational Process folder in OPEX_CAPEX PLANNING
As part of the process, SAP has also created a set of pre-delivered templates as part of the customized EPM solution to be used as reference or enhancement.
These reports are described as follows:
- Burden rate report per company code: This report displays the burden rate information calculated by the system after the burden process has been finalized.
- FTE report: This report displays the Full Time Employee (FTE) information stored.
- Originating report: This report is designed to visualize the sender/receiver relationship and using the partner objects (Partner Cost Center, Partner Profit Center, and Partner Company Code) as the drivers to identify charges across company codes.
- Scenario report: This report provides a view of the data in the three views of OPEX_CAPEX called Pre-burden and Pre-allocated, Burden, and Post-allocated.
- Trend report: This report has been configured to have company codes in the columns and G/L accounts in the rows at the highest member of the hierarchy, but it can be changed.
Specialized Processes
In large corporations that are extremely concerned about how costs are consumed and distributed, as well as how these costs affect different business units, cost centers, and other cost objects, the concepts of overheads and allocations come into play. Consider the concept of burdening or overhead because the cost or resources do not contribute directly to the end product, but they are critical for the organization to maintain operations, including consultants, health care, paid time off, training, travel expenses, sick leave, pension contributions, indirect labor, administration, insurance, rent, utilities charges, and other benefits.
These processes are standard in any corporation in any part of the world, and the difference is the accounting practices that need to be followed by using US General Accepted Accounting Principles (GAAP), International Financial Reporting Standards (IFRS), or local GAAP requirements. However, independent of the calculations, overheads must be added to the overall cost of the operational activities. Associated with the burden process is what is called the burden rate, which is nothing more than the percentage of indirect costs associated with employees, over and above gross compensation or payroll costs. Typical costs associated with the burden rate include payroll taxes, worker's compensation and health insurance, paid time off, training and travel expenses, vacation and sick leave, pension contributions, and other benefits. The burden rate provides a truer picture of total labor costs than payroll costs alone.
Once overhead calculations (the burden process) are completed, the next step is allocation of cost between cost objects, such as company to company, cost center to cost center, and other options depending on the nature of the business activities of the company. For example, service companies do not generate any revenue if they are focused to provide services to the operating companies such as repairs, manufacturing of assets, and repair or maintenance of vehicles used in delivery of goods or used by the operating companies to service direct clients. However, they provide service, such as maintenance to the operational companies, that must be allocated to all the operational entities that used their services using a specific criteria such as labor hours, square footage, and others to guarantee that the financial statements of the operational companies clearly reflect all the resources and costs incurred for a particular time period to generate sales or revenue. In this way, both the burdening and allocation process are part of the accounting cycle on a monthly basis of ECC, and this EPM 10.0 solution has been designed to follow the same calculations performed by ECC without the need of transaction codes, and with a simple click-and-run functionality. In the following sections, I review the concepts of burdening and allocations in more detail.
The Burdening Process (Overhead Allocation)
As part of the simplification of processes that the customized EPM solution has created, a customizable overhead allocation (burden process) includes in a single program the following overhead allocations and calculation of the burden rates per company code:
- Payroll: Variable and miscellaneous
- Payroll: Gain sharing
- Payroll: Time not worked
- Benefits: FAS106
- Benefits: FAS112
- Benefits: Health care
- Benefits: Group life insurance
- Benefits: Other
- Benefits: Pension
- Benefits: Thrift plan
- Benefits: Worker’s comp
- Benefits: Payroll taxes
- Benefits: Store’s handling charge
The most important of these calculations is that a single data management package that executes for an unlimited number of companies is based on the numerator and denominator relationship used to calculate the rates for each of the types of burdens, and then the distribution occurs within the same company. To achieve this simplification of ECC processes, my teams had to spend a considerable amount of time understanding the processes followed in ECC as part of the costing sheet process using transaction codes KSAZ, KALA, OKKP, OBYB, OK13, KA06, and KL01.
As shown in
Figure 9, the total process that took the customized EPM 10.0 solution with BW on SAP HANA was 52,256 MS (milliseconds), generating 97,165 records for Budget_V1 version compared with a previous time of one hour before having SAP HANA implemented to generate the same number of records. Clearly, implementing SAP HANA made a big difference in the improvement of a process as important in the utility/oil industry as calculating and monitoring overhead distribution (burdens).

Figure 9
Reviewing the execution run of the Burdens package as part of the customized SAP EPM 10.0 solution powered by SAP HANA
One of my clients for which I implemented this approach needed the capability to change variables, update them, and in a matter of less than 1 minute, have the complete set of burdens. This has been critical, as compared with using ECC to run a similar process.
In addition, the customized EPM 10.0 solution provides the burden rates per company code calculated for a complete fiscal year. In other words, each burden process executed generates an overhead percentage per company that is unique for the complete year, and a report has been developed to extract this data as part of the Burden View of the OPEX_CAPEX Business Model.
Overheads occur within a company, and they are not a cross-company allocation. However, the process occurs between cost centers within the same company. In
Figure 10 you see the company code called Service_Co has cost centers CC1, CC2, CC3, CC4, CC5, CC6, and CC7, and WBS charges to different medical WBS and list of G/L accounts specifically associated to benefits.

Figure 10
Original postings before overhead allocation (burdening)
Let’s review what the program is exactly doing at this stage. First, the burdening process is a standard process from any corporation in which the indirect costs must be assigned to the direct elements of the company. In the case of the OPEX_CAPEX business model, the model is a combination of G/L account and cost elements mapping and postings. To simplify, I explain the process in eight steps.
1. A cost center is charged benefits to medical charges for $120,000, and associated with both a G/L and WBS element to cost center CC1. This charge represents the numerator in the calculation of the distribution value as any other accounting calculation of overheads.
2. Employees perform the charges to a defined WBS that is also related to different projects.
3. The charges performed by the employees (productive time) are done to specific health-related G/L accounts that have been identified as part of the calculation using properties. As shown in
Figure 11, the total productive time charged at the Service_Co Code is $62,000, and this value would become the denominator of the distribution.
4. The calculation of a burden rate is equal to the numerator of $120,000 divided by $62,000. The results are shown in
Figure 11.
Note
All references to dollar amounts are US dollars.
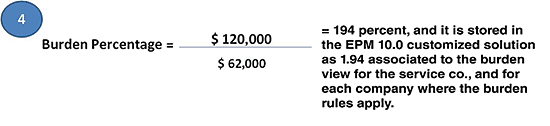
Figure 11
Calculate the burden rate percentage
As shown in
Figure 11, the distribution must occur to assign 194 percent from the numerator to the denominator to the same G/L account related to Health Care (in this case account C6102030 is Health Care), and maintain the same WBS elements identified in
Figure 10. As shown in
Figure 11, the burden rate is stored in the customized EPM 10.0 solution as 1.94 and is stored to the rate calculated for each individual company where the criteria meets the numerator and denominator G/L account groupings. The distributions occur automatically, and they are applied to the data to perform the distribution as shown in
Figure 12.

Figure 12
Apply the burden rate percentage to distribute the overheads
5. The program credits the numerator value in the source cost center (CC1) or zeroes out the value in this case, the posting value is negative $120,000.
6. The system distributes the calculated amount to the same G/L account (C6102030 for Health Care) to the target cost centers in the receiver WBS previously identified.
7. The first distribution is calculated as shown in
Figure 12.
8. Finally, after the distribution of the overheads the data is moved between WBS elements and maintained within the same G/L account, but in different cost centers. As shown in
Figures 12 and
13, the rate of 194 percent is applied to the pre-burden view of the receiver WBS and G/L accounts, and the Sender (numerator) is zeroed out to complete the distribution. After the burden process is completed, the dollars within the Service Co company have been moved from CC1 and have been distributed into CC2, CC3, CC4, CC5, CC6, and CC7 as shown in the complete result shown in
Figure 12.

Figure 13
The burdening distribution based on the calculated burden rate percentage
The same process is calculated for each of the kinds of burden rates identified in the data as previously defined (Payroll: Variable and miscellaneous, Payroll: Gain sharing, Payroll: Time not worked, Benefits: FAS106, Benefits: FAS112). Everything is determined on the linkage created between the G/L accounts and the burden rates as identifiers of the numerators and the denominator. This linkage is pre-configured as part of the definition of the customized EPM 10.0 functionality. There is also no limit of burden rates and percentages to be generated for the program and handled. This lack of limits provides flexibility to the system and allows complete adaptation to the needs of any business.
In this way, from a reporting point of view, once the data management package (DM) has calculated both the burden rates and the burden rules, the business is ready to either validate the burden calculations including the burden rates generated or move forward with the allocation process. In comparison with ECC, the SAP EPM 10 customized solution separates the different data management packages in different data sets, allowing the user to clearly understand and isolate the effects of the overheads and the allocation process, which is extremely sophisticated procedure in SAP ECC and unfortunately it is also very unclear.
In this way, when the burden process initiates the pre-burden and the pre-allocated set in the Scenario dimension is copied to the Burden Scenario value, all processes are executed in that data set.
Allocation Process of the Customized EPM 10 Solution
Compared with the allocation process created as part of the customized EPM 10.0 solution, the burdening process is basically moving the dollars from the numerator and making a distribution to the accounts in the denominator from an overhead point of view. The allocation process performs a distribution or movement of costs following specific rules stored in the ALLOC_PERC business model, and each line is read and matched with each dollar stored in a particular company. The dollars are then assigned in an additive manner to the target companies.
Once the relationship between the rule and the transactional data is identified, the rule is applied to the US dollars, and the distribution occurs between the service companies to the operating companies. The partner objects, such as the Partner Cost Center, Partner Profit Center, and Partner Company, are assigned to identify the senders and receivers automatically once the allocation process is completed. (I explain the allocation procedure for the partner objects in step 4 of the calculation summary later in this section.) During the allocation process from one company to the next, the source company is moved to the Partner Company Code, in the same way the source cost center and profit center would be the target partner cost center and partner profit center. In this way, end users and controllers have the reporting capability to not only validate the rules applied because they are also different from the rest of the transactional data, but to also execute reports of senders or receivers more easily when these relationships are maintained across the model.
In the case of the OPEX_CAPEX business model, the main driver is a dimension that my team called the operational unit (WBS), or the element that carries the costs from start to finish. In the case of the customized EPM 10.0 solution, my team called it WBS, but it can be called order, sales order, or anything else. It is just an object. My team’s allocation rules exactly match the ECC rules that are applied to ECC actuals. Therefore, the same rules can be extracted and uploaded into the customized EPM 10.0 solution using ECC tables as the source with BW or BI.
Similarly, for the burden process, in the customized EPM 10.0 solution, my team simplified the allocation process and improved the design of ECC tables. When redesigning the ECC tables, my team used many of the transaction codes and tables involved in the burden process. The advantage of the customized EPM 10.0 solution is that partner objects are always maintained and never lost compared with the burden and allocation processes using standard ECC. Some of the transaction codes reviewed to create the simplification are KCAU, KL01, KA06, KSV1, KSW1, KSU1, KP97, and OKB9.
As shown in
Figure 14, in the customized EPM 10.0 solution, a package was developed as part of the ALLOC_PERC Business Model. This package was designed to upload the rules from ECC, which also can be transferred using SAP BW/BI. As shown, the allocation process has been simplified to the following components:
- ALLOC_CODE: Allocation code in question. This component makes each line linked to a group of rules.
- WBS_S (Sender): The WBS Sender that generally it is found in the Sender Company Code or Service Company Code.
- WBS (Target): The WBS or operational unit (order, internal order, cost center, or any object defined to receive costs) that receives the costs from the sender company code.
- PERCENT: The percentage of the total value stored in the WBS_S in the transactional data that is applied to the WBS receiver in the target company code.

Figure 14
Overview of the SAP customized EPM 10 solution’s allocation rules from SAP ECC
The calculation in summary is described as follows:
1. First, load the Allocation Rules to the ALLOC_PERC environment as shown in
Figure 15.

Figure 15
Allocation rules defined in the ALLOC_PERC Business Model
2. The system first identifies the master data relationships between all the members included in the ALLOC_PERC Business Rule table to identify the Company Code, Cost Center, and Profit Center components as shown in
Figure 16.

Figure 16
Master data element for each of the WBS elements identified (Cost Center, Company Code, and Profit Center)
3. The system matches the allocation code identified with the Sender WBS (WBS_01), and the receiver WBS (WBS_02, WBS_04, and WBS_05) along with their respective master data elements of cost center, company code, and profit center. At the same time, the system identifies the allocation code that matches the rule defined in the ALLOC_PERC table, and this match is identified in the transactional data stored in the OPEX_CAPEX Business Model as shown in
Figure 17.

Figure 17
Identification of the rule to apply based on the allocation code
4. After this match is identified, the allocation begins. The system first automatically assigns a P to the names of the master data elements (company code, cost center, and profit center) from the sender WBS (WBS_01) as shown in
Figure 18.

Figure 18
Partner object assignment based on master data and rule definition
5. The matching rule percentage is executed, and the percentage is applied to the amount identified in the sender WBS (WBS_01). The system stores these relationships as shown in
Figure 19.

Figure 19
Allocation completed based on percentages and maintaining partner objects in the post allocated view of the OPEX_CAPEX model
In this way, it is clear that my team has allocated to WBS_02 50 percent of $1,000 and $250 to the other two WBS elements to be 25 percent, respectively, according to the rule defined in
Figure 15.
Of course, the most important point is performance. By performance, I mean time. Certainly, the time from a previous process for allocation, even though it sounds simple, was extremely expensive from a server perspective. This process could take up to 10 to 15 hours to complete without having SAP HANA as the database. Also, the data was matched side by side with the ECC allocation results for a particular company, and the match is perfect. Therefore, you can choose to run your allocations for actuals in the customized EPM 10.0 solution if you prefer. After the implementation of the performance improvement elements of SAP HANA, this process with the same data volume was reduced to 1.2 hours with more than 500,000 allocation rules. For more information, refer to the article titled “
McKesson Proof of Concept Monthly Allocation Cycle Could Drop from 60 Hours to 6.5 Thanks to SAP HANA.”
So far, this design in some of our clients varies depending on the data volume, complexity of the rules, and data volume in master data, but the logic does not change, and of course, each company has its specific calculations that must be reviewed and adjusted in the rules.
As any data management package, the selection can be customized, but overall the performance improvement has been quite significant. The controllers at my client are happy with a reduced and better way to use the ECC rules without following all the configuration rules.
Finally, for the Allocation Process when completed, the format is similar to the Burden View in the OPEX_CAPEX business model. The data has been copied and the rules applied, and the data in the service companies remains intact, and no zeroing out occurs as it could happen if using the SAP ECC allocation process.
In this way, as shown in
Table 1, the total data set generated in the OPEX_CAPEX business model has generated 1,437,277 rows
from 128,104 initial rows. As shown in
Table 1, the design simplified not only the design and execution of ECC tables with data management packages driven by properties but also the utilization of the SAP HANA database. Complete migration has improved system performance. The allocation process was particularly meaningful considering that the real-life scenario had more than 500,000 allocation rules in the ALLOC_PERC business model. The processing time was reduced to 1.2 hours, and now is run on a daily basis.
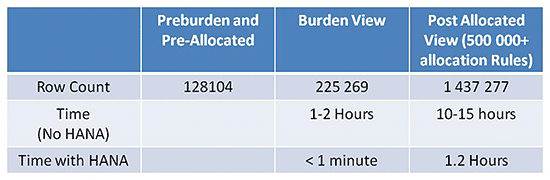
Table 1
Time comparison for the SAP EPM customized solution application before and after SAP HANA managing the same data volume
FINAL_PLAN
Finally, in brief, the FINAL_PLAN business model is the complete combination of both OPEX_CAPEX and financial planning business models. In this model, the final view or version of the corporation can be identified. From a FERC perspective, in this model you can accurately initiate the process because you have both components the CO and FI versions created in the EPM 10.0 customized solution. The transfer of data must be separated by G/L account because of the basic problem — what accounts from OPEX_CAPEX must contain a WBS (operational unit) for FERC purposes, and which ones do not need one. Therefore, they must come from the financial planning component to be integrated as part of the FERC process.
As shown in
Figure 20, you can identify the two packages created for the FERC process, among other packages used as part of the integration and merging of data for preparation, to have the final version of the data, and to perform consolidations. The FERC process has been divided into two components directly dependent on one another:
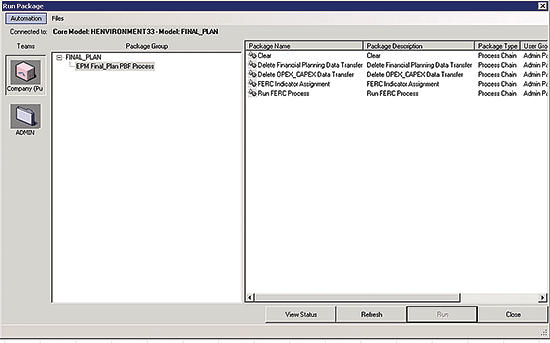
Figure 20
Review the FERC Packages in the FINAL_PLAN Business Model
- FERC indicator assignment: This component is used to perform the FERC assignment rules to the transactional data to prepare the data for the next process and perform the mapping from the transactional version of the data into a FERC driven scenario. For the purposes of the EPM customized solution application, my team created a version exclusively for FERC, such as FERC_ACTUAL, FERC_BUDGET, FERC_PLAN, and FERC_FORECAST. This version’s data is different based on the mapping rules from the original versions of ACTUAL, PLAN, BUDGET, and FORECAST.
- Run FERC process: Once the previous step is executed, and the indicators have affected the versions, it is time to combine all the SAP ECC FERC Rules. This process can be configured or uploaded from ECC, and the mapping occurs in the regulatory accounts from the transactional data, similar to the procedure that occurs when working with the transaction code FERC in ECC.
I recommend that you review the following content items to better understand the FERC process and to understand what the two packages previously described are doing from a technical and business perspective:
Case Study: How Allegheny Energy Uses SAP BusinessObjects Access Control to Address FERC Standards of Conduct (GRC 2009)
Once the data is transferred to the FINAL_PLAN application, many procedures must occur one more time. For example, you need to rebalance the company codes again to have a relatively accurate balance sheet. You also need to make further adjustments so that your data is visible to regulators, and depending on the industry and regulatory procedures, other elements must come into play depending on the scope of the exposure of the company to the FERC regulations. Most of my clients choose to combine the OPEX_CAPEX data in the financial planning business model and use this data to perform consolidations later on in the consolidation environment following the pre-defined rules. This combination leaves the FINAL_PLAN as the environment exclusively for FERC purposes.
I have reviewed a customized EPM 10.0 solution created by Arellius Enterprises exclusively for the US utility industry that is affected by the current US regulatory environment. As shown in the different modules, there are five key components: ALLOC_PERC, OPEX_CAPEX, FINANCIAL_PLANNING, FINAL_PLAN, and CONSOLIDATION. The success of this approach has been quite significant, making one client reduce analysts from 100 to 40.
Dr. Marco Sisfontes-Monge
Dr. Marco Sisfontes-Monge
is managing partner of Arellius Enterprises based in New York City and for more than 15 years has supported SAP implementers, direct clients, and other customers in Europe, North America, Latin America, Asia, and Africa in the following industries automotive, insurance, pharmaceutical, logistics, software, utilities, chemical, oil and gas, exploration and natural resources, discrete and process manufacturing, retail, and financial services. His background includes project management and performance measurement, product- and activity-based costing, design optimization, discrete and process simulation, system dynamics, and structural equations modeling. He also has finance specializations from the London Business School and Said Business School from Oxford University. He wrote the SAP PRESS books
CPM and Balanced Scorecard with SAP,
Controlling-Profitability Analysis (CO-PA) with SAP, Implementing SAP Business Objects Planning and Consolidation (SAP BPC): Volume I: Foundations, and
Implementing SAP BusinessObjects Planning and Consolidation (SAP BPC) Volume 2: Advanced Concepts.
You may contact the author at
msisfontes@arelliusenterprises.com.
If you have comments about this article or publication, or would like to submit an article idea, please contact the
editor.