Become acquainted with the third of the five-phase enterprise risk management (ERM) process: risk analysis. Step through the configuration to customize the risk analysis to your business needs. Learn how a risk analysis is initiated either directly by a responsible risk owner as a scheduled workflow task or by a key risk indicator (KRI) showing a violation of a predefined tolerance.
Key Concept
In SAP BusinessObjects Risk Management 3.0, risk owners can base a risk analysis for a given risk event on their estimates for three distinct factors: probability, impact, and speed of onset. The application converts the estimates for probability and speed of onset into a discrete probability level and computes a discrete impact level out of the impact allocations for various impact categories. The system then combines the probability and impact level to an overall risk level used to prioritize risks.
In the enterprise risk management (ERM) process, risk identification and risk analysis are considered two distinct steps. Risk identification focuses on gathering relevant risk information from all stakeholders in your enterprise in a collaborative process. It describes risk events in terms of different driver and impact categories and relates them to master data structures (e.g., organizational entities, strategic objectives, business activities, and risk categories) set up during the risk planning phase of the ERM process. Risk analysis is all about the prioritization of identified risks in a formal process employing qualitative or quantitative methods. SAP BusinessObjects Risk Management 3.0 supports the analysis of three different types of risk measures for the same risk event:
- Inherent risk
- Residual risk
- Planned residual risk
During the analysis of the inherent risk, a risk level is derived from estimates for the probability, impact, and speed of onset of the risk event assuming that no risk responses are yet implemented to mitigate the risk. Risk responses are identified, analyzed, and implemented during the risk response phase of the ERM process. The mitigation effect of risk responses is documented, giving estimates for the probability and impact reduction of the risk event under the assumption that the response is complete and effective.
The risk level of a risk, taking into account the mitigation effect of all assigned risk responses under their current level of completeness and effectiveness, is a measure for the residual risk. The highest possible mitigation effect of all risk responses is achieved if all risk responses are complete and effective. The corresponding risk level measures the planned residual risks. This article focuses on methods to analyze the inherent risk.
Basic Customizing Settings for Risk Analysis
You can configure a number of settings in IMG customizing that influence the application behavior during a risk analysis. Let’s start with an overview of the more basic settings:
- Percentage parameters for three-point analysis
- Speed of onset
- Probability levels
-
Risk levels
Percentage Parameters for Three-Point Analysis
The three-point analysis estimates realistic total losses for each impact category of a given risk event. Instead of estimating the total loss right away, you estimate a minimal total loss in the best case, a maximum total loss for the worst case, and an average total loss for an average case. The system then computes the total loss as the weighted mean of the three estimates. You can customize the used weights by following IMG menu path GRC Risk Management > Risk and Opportunity Analysis > Define Three-Point Analysis (Figure 1).
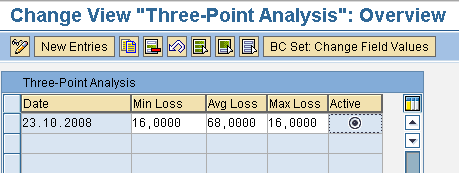
Figure 1
Customizing the three-point analysis
For example, estimate the total travel time driving from Frankfurt to Munich. The distance is roughly 400 km and since there is no general speed limit in Germany, you can complete the trip in 2 hours, 30 minutes under the best conditions. The average is taken from a navigational system and estimated at 3 hours, 45 minutes. However, with a terrible traffic jam, it can easily get up to 8 hours. Using the weights from Figure 1, a three-point analysis results in:
(150 minutes * 0.16) + (225 minutes * 0.68) + (480 minutes * 0.16) = 254 minutes = 4 hours, 14 minutes
Speed of Onset
The speed of onset is used in risk analysis to define a time frame in which you expect the risk event to occur. This is generally specified as short (1-5 years), medium (6-10 years), or long (>10 years). You can customize this by following IMG menu path GRC Risk Management > Risk and Opportunity Analysis > Maintain Speed of Onset. The use of the speed of onset is optional and you can deactivate it in the analysis profile settings, which I’ll explain later.
Probability Levels
Follow IMG menu path GRC Risk Management > Risk and Opportunity Analysis > Define Probability Level. You can maintain the probability levels you want to use in risk analysis. Typically, you use five levels: Rare, Unlikely, Possible, Likely, and Certain. Then follow IMG menu path GRC Risk Management > Risk and Opportunity Analysis > Define Probability Level Matrix. Here you define how the system converts estimates for the speed of onset and probability percentage into a probability level. You can enter an asterisk as the speed of onset if you don’t want probability levels to depend on it (Figure 2). You may include the speed of onset in your probability level matrix if you want to prioritize risks that are likely to occur sooner over longer-term risks.

Figure 2
Customize the probability level matrix
Risk Levels
The application combines the probability level and impact level for a given risk event into a risk level according to the customizing settings in GRC Risk Management > Risk and Opportunity Analysis > Maintain Risk and Opportunity Level Matrix (Figure 3). You maintain impact level descriptions by following IMG menu path GRC Risk Management > Master Data Setup > Maintain Impact Levels. However, you need to configure the conversion of impacts from various units of measure into a monetary value and the monetary value into an impact level during the setup of the organizational entities in the risk planning phase of the ERM process.
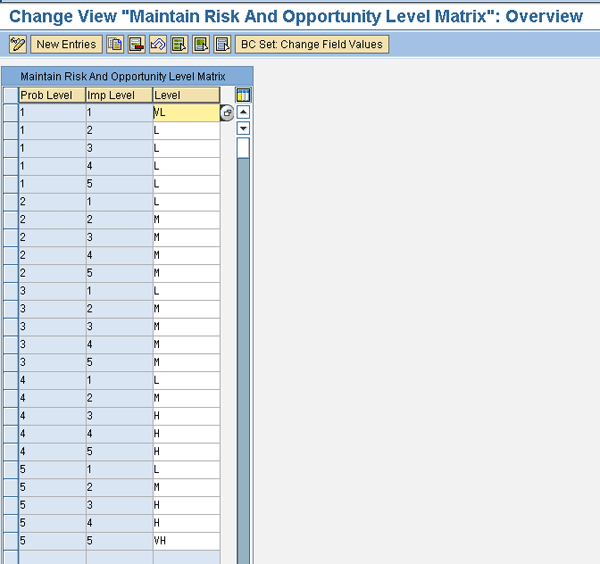
Figure 3
Customize the risk level matrix
You can customize the number of different risk levels, their description, and colors in the risk heat map by following IMG menu path GRC Risk Management > Risk and Opportunity Analysis > Maintain Risk and Opportunity Level Colors (Figure 4). The risk heap map is accessible in the application by navigating the portal to GRC Risk Management > Reporting and Analytics > Dashboards > Heatmap (Figure 5).
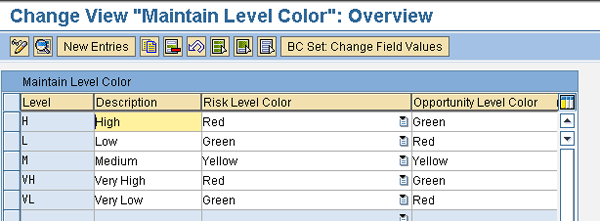
Figure 4
Risk level descriptions and color codes in the risk heat map
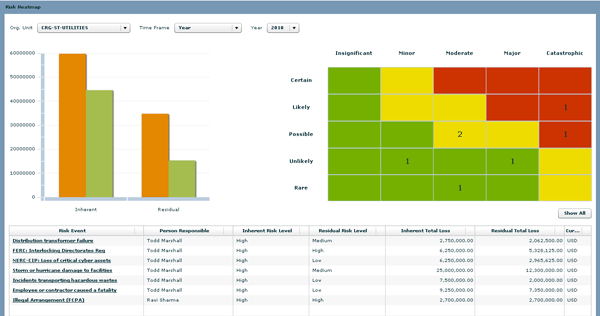
Figure 5
Total and expected losses of inherent and residual risks, risk heat map, and risk details for a selected organizational entity and time frame
Analysis Profiles
SAP BusinessObjects Risk Management 3.0 supports risk analysis in a number of flavors referred to as analysis profiles. You can configure several analysis profiles by following IMG menu path GRC Risk Management > Risk and Opportunity Analysis > Maintain Analysis Profile, but you can activate only one profile at a time. An analysis profile consists of a combination of the following settings:
- Impact Reduction: Yes or No — only relevant for residual risk analysis
- Probability: Disabled, Qualitative, or Quantitative
- Speed of Onset: Yes or No
- Impact Value: Qualitative, Quantitative, or Mixed
- Aggregation Method: Aggregation of estimated or computed impact levels of all impact categories to an overall impact level used for the computation of the risk level. Impact levels are numbered by 1 (lowest impact level), 2, 3, ... N (highest impact level) and can therefore undergo arithmetic operations:
- Blank: The default aggregation method (Summation) is used
- Max: The maximum impact level of all impact categories
- Average: The average impact level of all impact categories
- Summation: The impact levels of all impact categories are summed up
- Active: Select the active analysis profile
The settings made here affect the user interface (UI). For example, if you set the speed of onset to inactive, the drop-down list from which you select the speed of onset disappears from the risk analysis screen. Similarly, the Qualitative setting for probability or impact value brings up drop-down lists from which you select respective levels. The Mixed setting for the impact value means that for each impact category you can select whether the impact allocation is made quantitatively, estimating a total loss in an adequate unit of measure (UOM), or qualitatively, directly assigning an impact level from the drop-down list appearing in the UI.
Table 1 provides an overview of the results of a risk analysis employing different analysis profiles, assuming that the speed of onset is active. The inputs are estimates for the probability and impact for each impact category given by the risk owner conducting the risk analysis and the output is computed by SAP BusinessObjects Risk Management and displayed in the risk analysis screen immediately. Note that the total loss is computed from all quantitatively estimated impacts converted into the organization’s currency, whereas the expected loss is the total loss multiplied with the probability in percent.
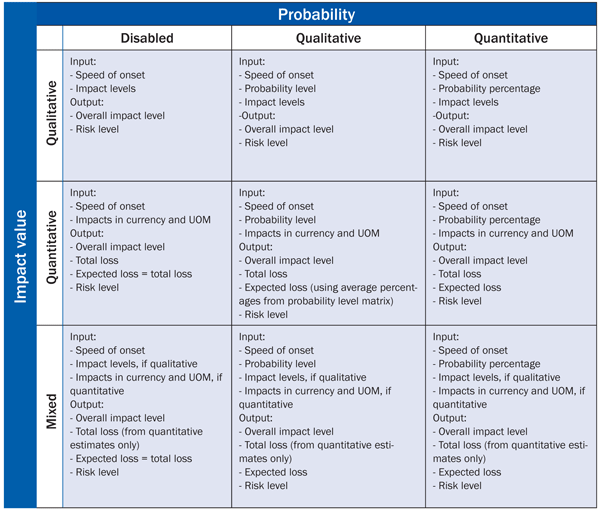
Table 1
System computations during risk analysis using different analysis profiles
Conduct a Risk Analysis
You can initiate a risk analysis in three different ways:
- Directly in a selected risk by the risk owner
- Workflow-driven and scheduled with the Planner tool
- Workflow-driven, but triggered by key risk indicators (KRIs)
A risk owner can select and open one of his risks by following menu path GRC Risk Management > Risk Assessment > Risk and Opportunities, going to the Analysis tab, and clicking the Create New Analysis button (Figure 6). On the left side of the screen, the results from a previous risk analysis are displayed as bar charts, but you can also access them as a report by clicking the Report button. According to the customized analysis profile, the risk owner documents his estimates for the speed of onset and probability and clicks the Impact Category Allocation button, which brings up a pop-up screen to allocate an impact for each impact category (Figure 7). The system computes from this input an overall impact level and a risk level. Clicking the Save button concludes the risk analysis.
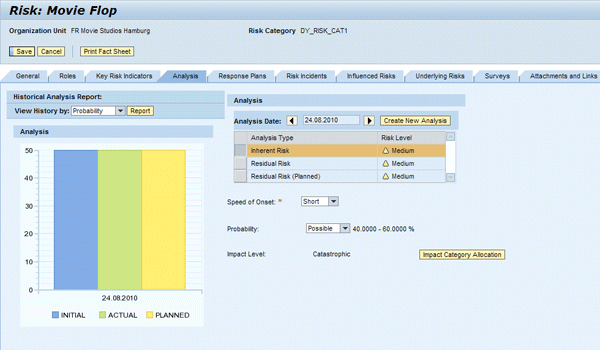
Figure 6
Risk analysis with a purely quantitative analysis profile including the speed of onset

Figure 7
Allocation of impact levels per impact category
You can schedule a workflow-driven risk analysis with the Planner tool accessible in the portal user interface at GRC Risk Management > Risk Monitoring > Planner. Here you can select multiple risks belonging to different organizational entities as needed. In the first step of the guided procedure, enter a Plan Name, select Perform Risk Assessment as the Plan Activity, provide a Start Date and Due Date for the workflow task, and choose an Analysis Date as reference date for the risk analysis (Figure 8). In the second step, select the organizations for which you want to schedule the risk analysis (Figure 9). In the third step, choose the risks attached to them that you want to include in the risk analysis (Figure 10). In the fourth step, review your selections and activate the plan. Finally, you receive a system confirmation in the last step of the procedure.
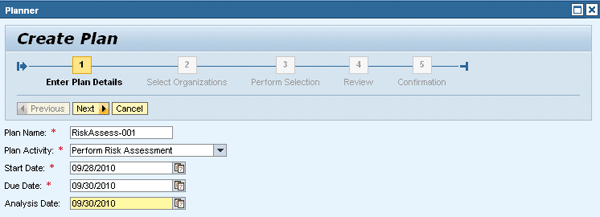
Figure 8
Enter plan details

Figure 9
Select one or multiple organizations
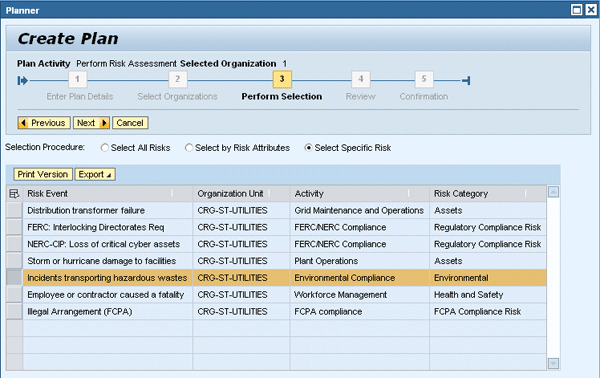
Figure 10
Select one or multiple risks from previously selected organizations
By default, the recipients of the workflow tasks for a risk analysis are the risk owners of the selected risks. For each risk, they receive a separate workflow task in their inbox, which is accessible via menu path GRC Risk Management > My Home > Workflow Inbox (Figure 11).
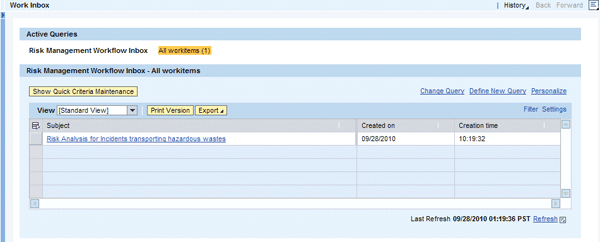
Figure 11
Risk owners receive workflow tasks to perform a risk analysis in their inbox
Click one of the received workflow tasks to open a guided procedure and execute a risk analysis for a particular risk. Figure 12 shows an example with an analysis profile that was chosen as quantitative for probability, mixed for impact value, and with the speed of onset deactivated. Consequently, probability is estimated as a percentage value (Figure 12) and the impact is estimated for each impact category either qualitatively as impact level or quantitatively in an appropriate unit of measure (Figure 13).
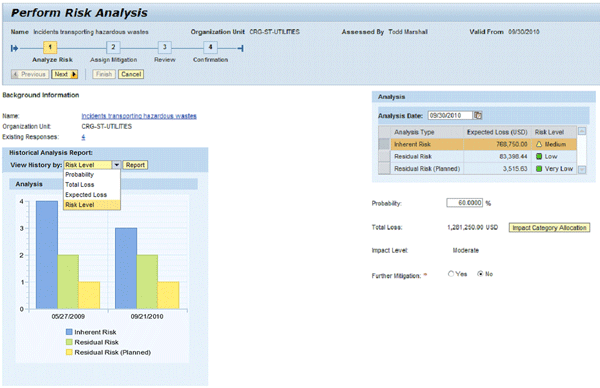
Figure 12
Analyze the risk
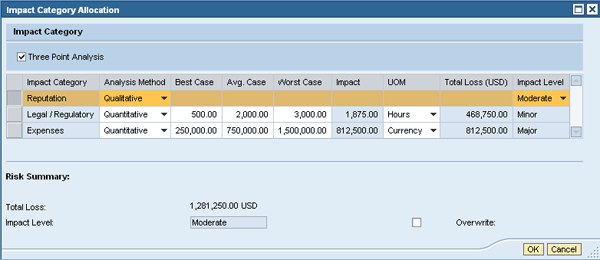
Figure 13
Impact category allocation for the impact value is customized as mixed in the analysis profile using three-point analysis
If you check the Three Point Analysis check box, the application adds three additional columns in the UI for your estimates for the impact in the best, average, and worst case. It then calculates out of these estimates a more robust quantitative estimate for the impact of the selected category. The application converts quantitative estimates given in units of measure other than currency into monetary values called total losses in the currency maintained for the organization to which the risk is attached. This conversion is based on the conversion factors maintained for each organizational entity during master data setup in the risk planning phase. The application uses the threshold values maintained for each organizational entity to determine the impact level from the total losses of each impact category.
Then the application consolidates the impact levels of all categories into an overall impact level using the aggregation method configured in the active analysis profile. In addition, the application calculates the overall total loss over all impact categories with quantitative estimates. Impact categories with qualitative estimates don’t contribute to the overall total loss. As the probability was estimated as a percentage value, the application determines the corresponding probability level from the probability level matrix maintained earlier in the IMG customizing. From the overall impact level and the probability level, the system derives the risk level according to the settings in the risk level matrix. Finally, the expected loss (measured in percent) is computed from the overall total loss multiplied by the estimated probability. All the results are displayed in the UI shown in Figure 12. Again, results from previous risk analysis are accessible as a bar chart or report on the left part of the screen.
The risk owner can set the Further Mitigation radio button on the bottom of the screen if he wants to review the analysis of the residual risk or add risk responses for further mitigation. As this article focuses on inherent risk analysis, I’ll skip this part for now and leave this radio button unchecked so the risk owner moves straight to step 3 of the guided procedure, where he reviews the results of the risk analysis (Figure 14). Finally, clicking Finish brings the risk owner to the last step, just containing a system confirmation.
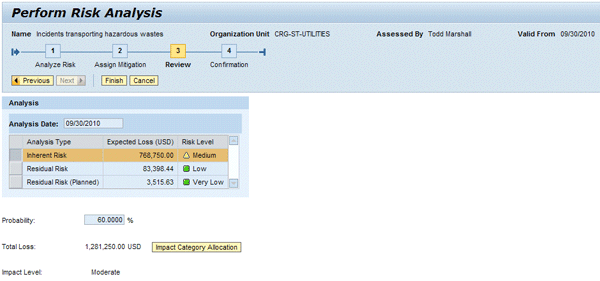
Figure 14
Review risk analysis workflow
The third way to trigger a risk analysis for a specific risk is through KRIs, which observe (via remote queries and Web services) your operational business systems for trends or specific conditions that make a particular risk more likely to occur. If these KRIs violate certain tolerances maintained in the application as business rules, you can send a workflow task for a risk analysis to the responsible risk owner. The execution of this workflow works the same as I have explained.
Frank Rambo, PhD
Frank Rambo, PhD, is managing a team within SAP’s Customer Solution Adoption (CSA) organization working with customers in the SAP analytics area with the objective to drive adoption of new, innovative solutions. Prior to this position, he worked eight years for SAP Germany as a senior consultant focusing on SAP security and identity management. Before he joined SAP in 1999, Frank worked as a physicist in an international research team. He lives in Hamburg, Germany.
You may contact the author at frank.rambo@sap.com.
If you have comments about this article or publication, or would like to submit an article idea, please contact the editor.