Executives and managers are compelled to make quick, informed decisions, driving companies to invest in better data management solutions to compete in a fast-paced, hyper-connected world. Corporate data captured in ERP and CRM systems, along with other databases, often provides an incomplete story on its own. That is where the use of financial and operational dashboards can be really beneficial for SAP users. A dashboard acts as a central access point for all data within a business's ecosystem, providing an overview of alerts and performance that help set the business's strategy and objectives. It eliminates the need to search for information by continuously updating key metrics and pushing data to relevant users. This enables them to self-serve and easily monitor customer behaviors, supplier issues, product performances, and personnel compliance versus target, as well as freeing up finance and IT teams from needing to repeatedly run reports.
While SAP Business One (SAP B1) is recognized as an effective ERP solution that integrates all core business functions including financials, sales, customer relationship management, operations, and inventory, accessing and manipulating data within SAP B1 can pose challenges. Many businesses also struggle to extract value from their data due to inadequate in-house analytical capabilities. For example, customization of SAP’s in-built dashboards often demands technical expertise which can be time-consuming and costly, especially if the skills of an external consultant are required.
The essence of managing complex data effectively lies in bringing all business data together, validating, processing and updating it so accurate analysis and reporting can come from a consolidated source. Once the data is in a single platform, it is more straightforward to centralize metrics and create data visualizations.
Phocas Software, which brings business intelligence (BI) and Financial Planning & Analytics (FP&A) together, offers data consolidation, analysis and visualization and reporting tools to uncover key insights within SAP B1; facilitating smarter, data-driven decision-making. It allows SAP users of all technical abilities to create an infinite number of fully-customizable, dynamic dashboards and scorecards from across multiple databases including sales, stock and finance. The drill-through capabilities of Phocas’ dashboards help to expedite the process of answering critical business questions. Users can interact with their SAP B1 data through simple point-and-click navigation, offering a secure and streamlined way to view and interrogate data, and question the why behind some of the results.
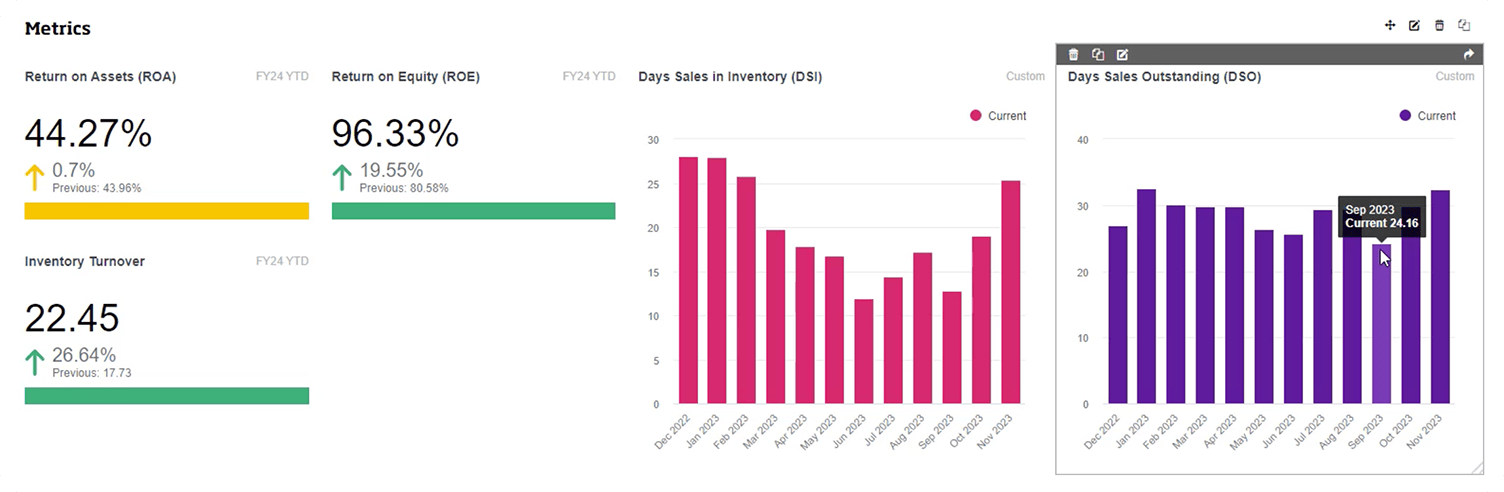
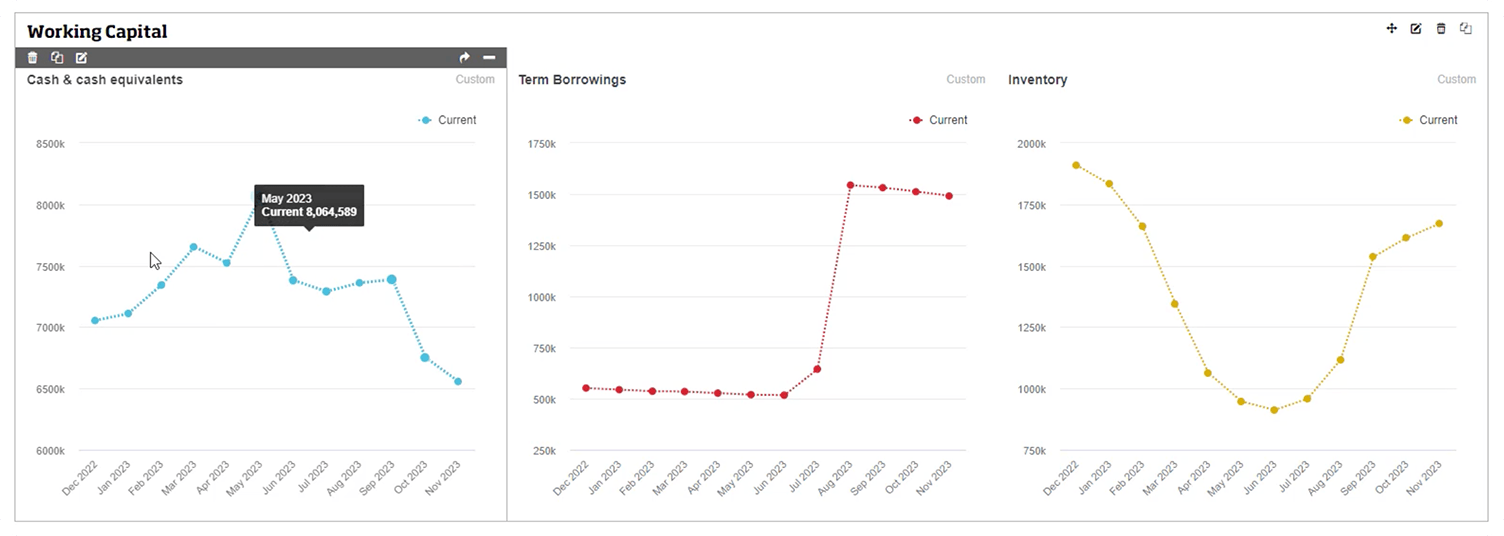
Interactive dashboards from Phocas provide a clear visualization of an organization's position and key performance indicators (KPIs) through custom graphs and dashboards that are easily shareable with just a few clicks. These dashboards integrate real-time data and enable a holistic view of company performance. Additionally, the use of graphs, charts, and graphics simplifies complex business insights, thereby enhancing engagement among individuals and teams. Users can swiftly transition from viewing data visualizations to analyzing the underlying data, enabling them to slice and dice metrics to address specific queries effectively.
Additionally, the Phocas Grid, which is accessible via all Phocas dashboards, allows users to explore data through pivoting and drilling down into data sets as needed. This flexibility is crucial for answering emergent business questions and handling large data sets effectively. Through these methods, stakeholders quickly transition from mere data visualization in dashboards to in-depth data analysis all in a single system, making the entire process more efficient and insightful. Specific questions that can be addressed with on-the-fly data manipulation in Phocas Software include whether the business is losing customers, experiencing margin erosion, facing rising supplier costs, having difficulties with invoice collection, or identifying underperforming locations.