Take a tour of the new and enhanced Web client features of SAP BusinessObjects Planning and Consolidation 10.0, version for SAP NetWeaver. Find out how improvements to the Web client functions can change your planning and consolidation and reporting activities.
Key Concept
In SAP BusinessObjects Planning and Consolidation 10.0, version for SAP NetWeaver, a new module called Consolidation Central allows you to perform most, if not all, of your closing tasks from one interface.
SAP BusinessObjects Planning and Consolidation 10.0, version for SAP NetWeaver is a new release due in mid-February 2012 that provides many new features. One of the new features, the Web client, enables you to easily access your activities and Web reports. You can create workspaces to customize your work environment for ease of use and greater productivity. The Web client includes the new Consolidation Central module, which allows you to run and monitor consolidation tasks from just one area. Another new feature is incremental processing for consolidation and currency translation. With this feature, you can use timestamps that allow the system to skip records that have already been processed, dramatically improving run times.
Note
This article addresses only SAP BusinessObjects Planning and Consolidation, version for SAP NetWeaver, and is based on Service Pack 3, except where noted. Also, additional features may be available by the time the software’s general availability occurs. SAP BusinessObjects Planning and Consolidation, version for Microsoft is due out in late January 2012.
SAP BusinessObjects Planning and Consolidation 10.0’s Web client, which is installed with the planning and consolidation server, is more important to end users than it was in the previous version (7.5) primarily because the Web client is where you execute consolidation tasks. When you open the Web client, the Home workspace opens (Figure 1). The Home workspace provides the user with a launchpad to all planning and consolidation applications.
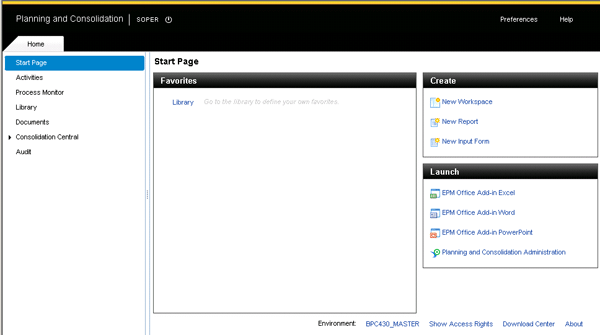
Figure 1
The SAP BusinessObjects Planning and Consolidation Web Client Home workspace
The Home workspace provides an easy-to-use, more intuitive launchpad. You can access activities in your business process flows, run the process monitor to keep tabs on all running processes, open your library of reports and input forms, access documents and Web sites, perform monthly closes via Consolidation Central, and run audits and security reports. In prior releases, you can perform all of the activities, although the navigation steps are not as straightforward.
With version 10.0, the concept of workspaces is completely new. Workspaces offer customizable tabs in the Web client with user-defined collections of reports and input forms for the monthly close or annual planning cycle, for example. You can also create a more intricate workspace for planning activities and performing monthly closes. Further, you can share your workspace with others or keep it private.
As with the other screens in the Web client, you can set the context members (i.e., the current view) for the workspace so that your reports inherit those data selections. For example, if you set the context member to 2012.JAN in the workspace, any report you run from that workspace uses the 2012.JAN setting.
You can now set different defaults for your context members for both input forms and reports by model and application — in other words, you can select base-level member defaults for input forms and parent members for reports, thereby providing a ready-to-run solution. Because a context member is a master data ID for a dimension, you can set a cash account as the context member in an account dimension, for example, and then the system uses that member as part of the selection criteria to display values from the database.
Meanwhile, you can create Web reports and input forms in thin client scenarios via the Create launchpad (Figure 1) with fewer navigation steps. For example, in version 7.x, you launch a Web page, choose Live Reports, and open a Web report. Now you simply click the New Report link and build these reports using drag-and-drop functionality, just as in prior releases. Version 10.0 also supports multiple dimensions in the rows and columns, facilitating the use of Web reports to analyze consolidation data (e.g., without launching the Microsoft Excel client). Figure 2 shows an account by entity trend report developed from the Create launchpad.
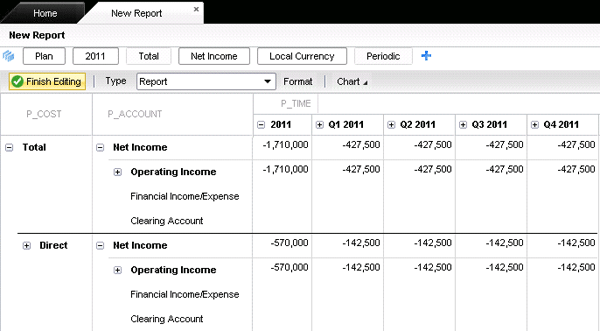
Figure 2
A trend report created and built within the Create launchpad
Consolidations
Consolidation Central is completely new. Before the addition of this module, you had to perform consolidation-related tasks exclusively from the interface for Excel. Now, the Home workspace provides Consolidation Central, an all-in-one component that offers users several options (Figure 3).
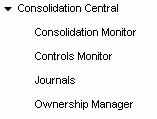
Figure 3
Consolidation Central options
This new screen provides a launchpad for users to do most, if not all, of their consolidation tasks from one screen. Let’s look further at the options under Consolidation Central.
Consolidation Monitor
The Consolidation Monitor provides one screen to execute consolidation tasks and to track their statuses. You can monitor processes using one screen that provides information on data validation. You can also execute the translation and consolidation functions from the Consolidation Monitor. These procedures take less time with the added feature of incremental processing, which only processes the changed data records. Timestamps now detect what data records have changed, and if they haven’t changed, then the program skips them while processing, thus speeding up the job. When a task is complete and validated, you can approve the work status for the group without leaving this launchpad. Note that there are some tasks (e.g., reclassification) that you still need to execute and monitor from the Excel client.
With the Consolidation Monitor, you can gather and consolidate financial data and see the breakdown of this data. As an example, suppose context members ACTUAL, 2010.DEC, and CORPORATE perform a data selection from an ownership model. The result is a hierarchical view of the investment structure in rows (Figure 4). The ownership model (i.e., LEGAL) contains the transaction data for a corporation’s investment structure. In the example, this data includes the corporate holding company (C9000) and its subsidiaries (C1000 and C2000). The Consolidation Monitor provides four statuses — Control Status, Work Status, Currency Translation, and Consolidation — for a more comprehensive view of the data.

Figure 4
Monitoring investment structures
Controls Monitor
Another new feature is the Controls Monitor, which you can use to validate data. The data validation functionality is completely rewritten in version 10.0.
The Controls Monitor includes better visibility of the status of the data validation process, built-in reports called Control Results, which display the numeric comparisons, and hypertext links to Excel input forms, for example, to take corrective action. Figure 5 shows the status of data validation with a failed control for the holding company, C1000. You access the screen in Figure 5 by opening Consolidation Central and selecting Controls. You can then click Run Controls or view the results if they have already run.

Figure 5
Monitor the data validation for the C1000 holding company
With this information, you can investigate the failure by simply selecting C1000 and clicking the Open Control Results button. A new screen opens (Figure 6) with the values calculated for that particular control. In this case, there is an input error, indicated by the Failed status. The retained earnings are different from annual net income by $1,000. The screen shown in Figure 6 and the option to launch a related document are completely new in version 10.0.
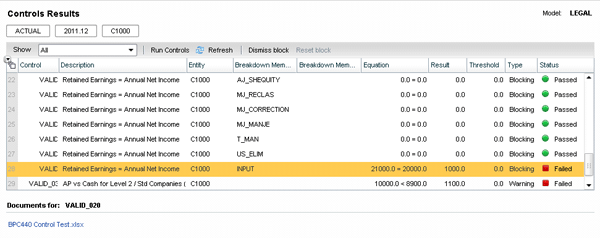
Figure 6
Information indicating the reason for the failed data validation
To resolve this issue, you click BPC440 Control Test.xlsx at the bottom of the screen. The Excel interface with the input schedule opens (Figure 7). Now you correct the input data to resolve the error.

Figure 7
The input schedule
You can now correct the out-of–balance issue by setting the retained earnings to 20,000, saving the changes, and clicking Run Controls again. The Controls Monitor shows that all the controls have passed (Figure 8).
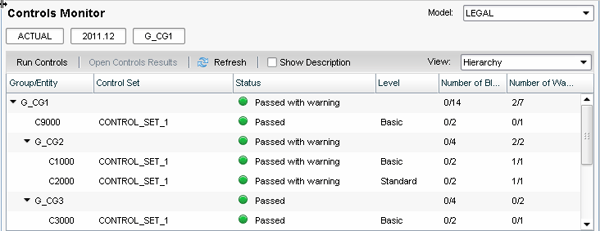
Figure 8
Control statuses including data validation complete and successful
The Passed with warning messages under the Status column mean that the control failed, but because they were set up as a warning (not a block), they pass, but with a warning. In the example in Figure 8, C1000 includes a check to see if accounts payable is above 10 percent of cash. The entity is in this case has accounts payable data that exceeds 10 percent of cash, therefore C1000 passes with a warning, but does not fail.
Journals
With an enhanced query search engine to generate journal reports in SAP BusinessObjects Planning and Consolidation 10.0, version for SAP NetWeaver, the Journals landing page provides an all-in-one screen to report, create, and post journals.
You can create a new journal by selecting Journals from the Consolidation Central list of options (Figure 3) and then clicking the New button in the screen that appears. Figure 9 shows the New Journal tab, which appears when you create a new journal entry. The context members are inherited automatically into the header dimension members, thereby accelerating the manual selection of members.

Figure 9
New Journal tab with context members automatically displayed
You create and maintain journals exclusively from the Web client as opposed to Excel. This feature is important for a couple of reasons:
- You are now using tabs for additional properties, for example, and the issues related to rendering journals in the Excel interface can now be completely avoided.
- Although there is still one template per model allowed as in version 7.5, you can now enter multiperiod and multivalue entries. For example, you can create a journal to post a 12-month entry with different values per month. You can also set the journal parameters to balance by entity and currency.
The system validates what you type into fields and highlights the information in red, providing a message if the data is incorrect. For example, if you type an invalid account, the system displays a message (Figure 10) indicating that the text entered is not a valid account.

Figure 10
The system verifies data entry
Ownership Manager
The Ownership Manager provides an improved user interface that allows you to view and edit the ownership data in personalized screens. In edit mode, for example, you can create an investment structure with percentages and methods assigned by month and category (Figure 11).
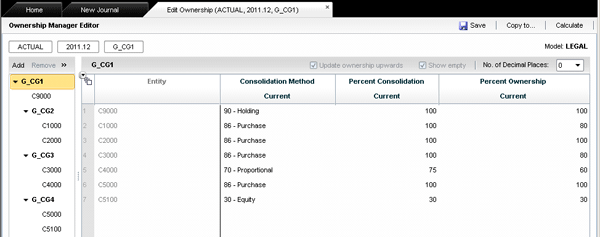
Figure 11
The Ownership Manager screen in edit mode
Note
As in prior releases, you can use the system to calculate the percentage values and propose which accounting method to use based on those percentages by using the Calculate feature.
Clicking the Calculate button in the Ownership Manager editor opens the Calculate dialog box (Figure 12). The options in this box allow you to perform different calculations and choose whether to use the results to update the database. In version 7.5, this function is performed via a Data Manager package.

Figure 12
Methods and options for calculating ownership
To calculate the ultimate percentage of ownership, you can choose one of the following methods:
- Direct share method: Uses the direct percentage of ownership that a parent entity holds in a subsidiary (e.g., if C1000 owns 80 percent of C2000, then the direct share is 80 percent)
- Group share method: Uses the group percentage of ownership that a parent entity holds in a subsidiary (e.g., if C9000 owns 80 percent of C1000, which owns 80 percent of C2000, then the group share of C9000 to C2000 is 64 percent, or .80 x .80 = .64)
To specify the calculation method, percent of consolidation, or both, based on the previous calculation, you can choose the following methods:
- Update Method, which updates the ownership method
- Update % Consolidation, which updates the percentage of consolidation
- Overwrite current ownership values with calculated values, which update the percentage of ownership and consolidation
When you choose to calculate the ultimate percent of ownership and control through the Group Share Method, the results are shown in Figure 13.

Figure 13
The Group Share Method used to calculate the ultimate percent of ownership and control
In this example, the group share of C2000 is calculated as 22 percent control because C1000 has 55 percent control (i.e., .55 x .40 = .22). The group share of C2000 is 42 percent ownership because C1000 has 70 percent ownership (i.e., .70 x .60 = .42).
You can overwrite the percent ownership using the Group Share Method, but this time you must select the Overwrite current ownership values with calculated values method from the drop-down menu (Figure 12). Figure 14 shows the recalculation.

Figure 14
Results of overwriting the percent of ownership
The current value of the percent control for C2000 is updated to 22 percent, and the current value of the percent ownership is updated to 42 percent. If you want to update the consolidation method, percent consolidation, and percent ownership values using the Group Share Method by selecting all three methods (Figure 12), the results look like those in Figure 15.

Figure 15
Results of the new calculations using all three calculation methods
The consolidation method for C2000 is updated to equity because its percent control falls in the range of .00 to .25 as specified in the method’s business rule. In summary, you can see how you can use the ownership calculation to record percentages and methods, which can then be used when consolidation is executed from the Consolidation Monitor.
Note
For more information about SAP BusinessObjects Planning and Consolidation 10.0, visit the SAP Help Portal at
https://tinyurl.com/7nptkk8. The help files address version 10.0 for the Microsoft and SAP NetWeaver platforms.
Charles “Tim” Soper
Charles “Tim” Soper is a senior education consultant at SAP. For the last 17 years, he has been teaching SAP classes on a variety of topics in financial and managerial accounting, business warehouse, business consolidations, and planning. He is the planning and consolidation curriculum architect and has written SAP course manuals. He also works as an SAP Senior Educational Consultant. Early in his career, he worked for Eastman Kodak Company in Rochester, NY, as a senior financial analyst. He has an undergraduate degree in economics and an MBA in finance from the University of Rochester.
You may contact the author at Charles.Soper@sap.com.
If you have comments about this article or publication, or would like to submit an article idea, please contact the editor.