This simple exercise is a friendly introduction to the confusing terminology of InfoCube, InfoObject, Dimension, and Attribute. Experienced BW professionals will find this article useful because it shows them a non-technical way they can teach the process to others in their company.
The InfoCube is one of the most important BW elements used for reporting. Although other parts of BW (such as the PSA and ODS) store data, InfoCubes hold the data from which most of your BW reports will read. So knowing how to populate InfoCubes with data is important whether you produce or request BW reports.
For those who view reports, it is helpful to know that your data is coming out of something called an InfoCube and to know exactly what an InfoCube is. Understand this and you can provide the report developers with a better understanding of what you need in the InfoCube. Those who want to create their own reports in BW have many things to eventually master. You want to get data into the InfoCubes with validity, with integrity, and with an inherent capability that allows end users to reconcile the numbers they'll be seeing in their reports. That learning curve will become easier once the standard mechanics behind the InfoCube become clear.
In this article, I will walk you through an exercise I developed in Microsoft Excel designed especially for beginners. Exercises in BW are great, too, but to a person just starting off, every aspect of a BW exercise is brand new. Most people are already comfortable with spreadsheet-type software technology. I've found that this familiarity helps me see relationships in the InfoCube more easily than when the exercise is performed in a new technology (i.e., BW).
You Can Model an InfoCube with an Excel Spreadsheet
The trick to this exercise is to do something new (build an InfoCube) using something old (Excel). If you don't have Excel, any spreadsheet application will work just fine. I should also make clear that you do not have to actually do the work steps yourself. If that helps you to follow along, great. Otherwise, I'll include lots of Excel worksheets, and it should be fine to just look at my work. You can download them at the end of the article. Either way, it will become clear to you how the different pieces of an InfoCube (fact table, dimension table, InfoObject) each play a role in storing data that users might find useful in a report.
If you are familiar with R/3 and with Excel, this exercise should take no more then 30 minutes to complete. If you merely read along without doing the steps, the work-steps portion of the lesson should take less than 10 minutes. For this reason, I will give bare-bones directions on the work steps.
The general sequence of steps is listed below. Immediately after the final step in the exercise, you can reflect for a moment on what you did, and I'll include a more detailed section on how the work steps demonstrate the concept of the BW InfoCube.
- Log onto any SAP R/3 system, find one example of transaction data related to a single sales order, and download it from R/3 to Excel.
- Open the downloaded Excel file.
- Add a couple of worksheets to the Excel files.
- Create names for the worksheets.
- Do a little editing, typing, and cut-'n-pasting.
Step 1. Find and Download Sales-Related R/3 Transaction Data to Excel
I have a good comfort level with sales order and sales delivery data in R/3. So, in my first step, I retrieved data related to one sales order from R/3. To download, I used nothing more fancy than the standard transaction code SE16 to display data about my one sales order from table VBAP. I then used the standard menu option to pick out only a few VBAP fields to display. Finally, as shown in Figure 1, I used the standard downloading functionality available from the System menubar in R/3 to get a copy of that data from R/3 to Excel.
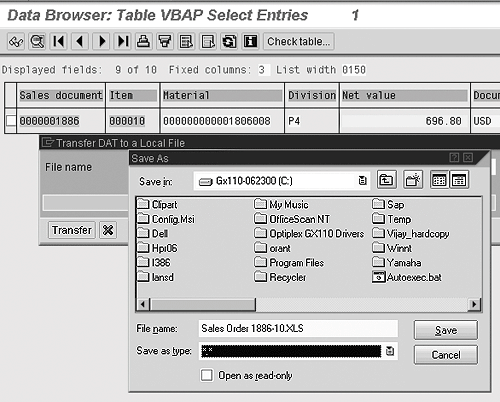
Figure 1
Use transaction code SE16 to download data from table VBAP
Step 2. Open the Downloaded Excel File
You should now have one saved Excel file that looks like Figure 2.1 If all went well, it has data for one particular sales order line item.

Figure 2
Use transaction code SE16 to download data from table VBAP
Okay, it's my sales order, but pretend that it is yours! Look closely. What's there? It looks as if you sold 13 pieces of one product on October 10 for a total of $696.80.
You will want to include this data in a report that gives the reader statistics about average selling price during October. You certainly know how to do that using Excel, but do you know how to do it using an InfoCube, or even why you would bother putting this data into an InfoCube? Answers are on the way!
Step 3. Add a Couple of Worksheets to the Excel File
Once your downloaded data file is open, you are ready to take the next step in building a model of a BW InfoCube. Depending on your version of Excel, the bottom of your spreadsheet will either have just the one tab with your sales order line item data, or that tab plus two not-yet-used tabs labeled Sheet2 and Sheet3, each representing one worksheet. Either way, you want to end up with one tab with your sales order line item data, and five not-yet-used tabs. To add a tab (i.e., worksheet), choose from the menubar Insert>Worksheet. When you're done, the spreadsheet with your sales order line item data should look like what's shown in Figure 3.
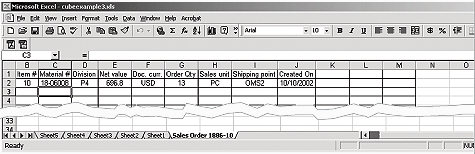
Figure 3
Sales order line-item data plus five not-yet-named tabs
What the heck is this stuff? Any ideas yet? Are you going to copy the data from the one sheet into each of the other five? Well, yes and no. You will end up with a bunch of sheets that act a lot like an Excel pivot table, if that helps you understand what you're doing. If not, no worries. I didn't know what a pivot table was until after I learned BW.
Step 4. Create Names for Your Worksheets
Now you need to change the text names of those new tabs so that they say something other than Sheet1 and Sheet2. To change the text, right-click on top of the tab and you will see a pop-up menu where you can choose Rename. Do that, and rename the not-yet-used tabs as follows: Dates Master Attributes, Time DIM, Org DIM, Product DIM, and Fact Table. When you're done, your spreadsheet should look something like Figure 4.
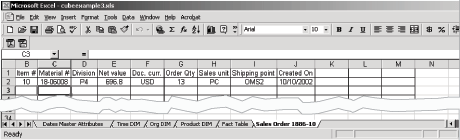
Figure 4
Sales order line-item data plus five named tabs
Any ideas what kind of data you will put into those DIM worksheets? If you're guessing that DIM stands for “dimension” (as in “analysis dimension”), you're a good guesser! But what in the world do I mean by an analysis dimension? Let's see.
Step 5. Do a Little Editing, Typing, and Cut-'n-Pasting
The interface from an R/3 system into a BW data warehouse occurs in three stages: extract, stage, and update. You have already simulated the first two. Now you can finish this exercise by simulating the third.
I know that this is only a simple demonstration, but try to imagine that data about this one sales order will one day end up in your average selling price report.
As you review the worksheets for step 5, ask yourself if the steps that I'm taking — putting this data into the Excel worksheets (i.e., InfoCube) that your report will be reading from — are okay. Or, are they not okay? Forget for the moment that you are learning about InfoCubes and just evaluate my data entry into these spreadsheet cells. Based on how I am typing things in right now, will it be easy to reopen the spreadsheet and figure out what the data means a week from now? Will you trust this data in this spreadsheet for making your business decisions? Will it be easy or hard to use? Form your own opinions now, and I'll share with you mine after you're done.
Column Header Texts
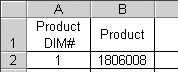
On the worksheet you named Fact Table, type the following column headers into the first row: Time DIM #, Org DIM #, Product DIM #, Sold Qty in Unit PC, and Unit Value in USD. When done, your worksheet should look something like the schedule shown in Figure 5.

Figure 5
Header texts for the Fact Table worksheet
With that done, create column header texts for your other worksheets per the schedule shown in Table 1. If at this point you find the purpose of these texts such as DIM or SID unclear, you are normal. It is confusing...at first. It won't be once you have finished the exercise and reflected on it briefly.
| Worksheet |
Column texts |
| Product DIM |
Product DIM #, Product |
| Org DIM |
Org DIM #, Division, Shipping Point |
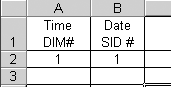
| Time DIM |
Time DIM #, Date SID # |
| Dates Master Attributes |
Date SID #, Date, Day of Week, Amount of Advertising Run in USD, Size of Moon |
| Table 1 |
| Header texts to create for the other worksheets |
Master Data Values
Now you're ready to start typing in data that will help someone make sense of (i.e., analyze) the sales order average selling prices our company has been achieving. Navigate to the worksheet you're calling Dates Master Attributes and type into that worksheet the values shown in Figure 6.
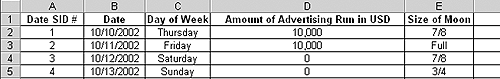
Figure 6
The values to type into your Data Master Attributes worksheet
Dimension Table Row Numbering
For the three worksheets with word DIM in the tab name, copy the data shown in the worksheets labeled:
Org DIM

Product DIM
and Time DIM.
Fact Table Data Entry
For the Fact Table worksheet, copy the data shown in the worksheet labeled Figure 7. Notice how you do not directly enter who/what/where data (such as Shipping Point or Created On Date) into the Fact Table, but instead you create a link via the DIM #.

Figure 7
The values to type into your Fact Table worksheet
Also notice how the Fact Table does not have a “Net Value” column like source data worksheet. This is an option with Excel, so it should not surprise you. It is also an option with your BW fact table. You can include a column that calculates a value based on other values. In my case, I am asking the Fact Table to divide net value by the number of units, and then store that calculation into the Unit Value column.
Congratulations! You Have Just Modeled an InfoCube!
You have just designed an InfoCube, extracted a copy of data for it from a source system, staged that data, and then used that to populate your InfoCube. The data in this InfoCube allows a user to do more analysis faster and better than if you had instead just written a report to get the same data from the source (R/3). Don't believe me? Let's reflect slowly on the steps you did.
In steps 3 and 4, you created worksheets and gave them names such as Fact Table and Org DIM. An Excel worksheet exists to hold data. You do not use it to create original data such as a new sales order. The “worksheets” of a BW InfoCube are the same. They exist to hold data. They are not called worksheets, though. They are called the fact table and the dimension tables.
Each InfoCube has exactly one fact table. Its mission is to store statistics that can help a user answer a specific business question such as, “What is the average price per unit in our sales orders?”
Meanwhile, each InfoCube has between three and 16 dimension tables. Their mission in life is to store who/what/ where kinds of data about the business statistics in the fact table as a way to let a user more easily search, sort, and subtotal all the individual rows of data that end up in the fact table. Each unique set of who/what/where data that ends up in a dimension table is stored as its own row and has a DIM number (i.e., an identifier) automatically assigned to it. This is why there will be between three and 16 of these tables; if you put all of your who/what/where columns into just a single dimension table, you will probably end up with a tremendous number of unique value combinations. Have you ever tried to sort, search, and subtotal an Excel spreadsheet that had a million or more rows? (It's possible, but you will wait a long, long time for each navigation request that you make.)
The final worksheet you created in steps 3 and 4 is something you need to know about, even though it is not actually part of an InfoCube. Instead, it is an important optional functionality that your InfoCube can access if you want it to. It is called the InfoObject attributes table, and its mission is to store cause-and-effect kinds of data that help a user figure out why the business statistics are what they are.
For example, in your one row of InfoCube data, you can see that a sales order for 13 units of product #1806008 came in on October 10 for about $697. However, the value October 10th cannot logically be the cause of this sale or this sales price. Instead, some things about October 10th can be the cause—e.g., what day of the week that is or how much advertising ran that day. BW gives you this option to store that kind of data about each specific who/ what/where value, whether it is dates, product numbers, customers, and so on.
More importantly, this kind of data does not exist in the source system (SAP R/3, in my example). It is the reason that an analyst can get more done with an InfoCube than with R/3 or with Excel. BW can take in data from anywhere, from any source. Even from your personal, offline spreadsheets.
To keep the total data volume in each InfoCube smaller, though, the attributes of specific values are stored in just one table, which can then be shared by every InfoCube you might create. Each “column header” in any fact table or dimension table is called an InfoObject, and each InfoObject related to a who/what/where category can have an InfoObject attributes table activated. If that InfoObject is part of your InfoCube, then any report that gets its data from your InfoCube can be designed to also display data from the attributes tables of the InfoObject.
One final lesson is available from the exercise. Notice that you still have your original data from SAP R/3 in the spreadsheet. In my case, it is in the worksheet I've called Sales Order 1886-10. This kind of “worksheet” also exists in BW. It is called the PSA, or Persistent Staging Area. Its mission is to store an exact copy of any data brought into any InfoCube.
Perhaps you noticed, but I intentionally made a slight change to the product numbering in the Product DIM worksheet on page 22 when compared to the product numbering in the worksheet labeled Figure 2. I removed the hyphen. This is because each InfoCube can receive data from many different sources, each of which might have a slightly different format to the same category of data (hyphen vs. no hyphen, uppercase vs. lowercase, etc.). You want to apply consistency rules to these different sources, but you also need to hold onto some way to “prove” the data in our InfoCube. So, you keep an exact copy in one place (the PSA) and a converted copy in a second place (the InfoCube).
The relationship between which PSA data found its way into which InfoCube is stored in BW using something called an InfoPackage, but that is a topic for another day!
Kurt Goldsmith
Kurt Goldsmith is a senior business consultant for Enowa Consulting, specializing in the diagnosis and resolution of productivity-related integration issues between a company’s division of labor (end users, managers, executives) and SAP software (R/3, BW, APO, CRM). He also has a lifetime performance record of one win and two third-place finishes from five career starts as a thoroughbred racehorse trainer.
You may contact the author at kurt.goldsmith@enowa-consulting.com.
If you have comments about this article or publication, or would like to submit an article idea, please contact the editor.