Formulas, variables, and functions are important elements in SAP BusinessObjects Web Intelligence data analysis and report creation. The extensive set of functions used in combination with operators allows for the creation of complex, unique, and informative custom objects. The ability to add formulas and modify existing ones while viewing reports provides users with an increased level of convenience.
Key Concept
Formulas are statements written in the syntax of a chosen tool to produce a calculated result. These statements often contain a combination of data elements retrieved by queries, reporting functions, and reporting operators provided out of the box, as in BusinessObjects Web Intelligence. Variables are formulas or syntax statements that have been assigned a name, making it easier to reuse statements in various objects and report elements throughout a reporting document.
Writing formulas in SAP BusinessObjects Web Intelligence reports greatly expands the functionality and meaning of the data retrieved by queries. Business users and report writers can easily transform ad hoc query results and report data through the creation of formulas or variables. With the aid of more than 145 available reporting functions, users can write formulas while either editing or viewing reports. The freedom to alter row and column definitions while viewing a report is a convenient feature for business users as calculations and aggregations can still be applied to reports even when edit rights have not been granted.
Tip!
Users can save reports to their Favorites Folder in InfoView even if edit rights have not been granted.
In order to add or modify existing formulas while viewing a report, users must select the Interactive view format must within their Web Intelligence (also called WebI) preferences. To view or modify existing selections, click the Preferences button located in the upper right corner of InfoView in BusinessObjects Enterprise XI 3.1 (
Figure 1).

Figure 1
Click the Preferences button to view or modify formulas
Enabling Interactive View Format
After launching your Preferences page in InfoView, collapse the General section and expand the Web Intelligence section. Although users can modify Web Intelligence settings in six different categories, this article focuses on the first category: Select a default view format. Here, users need to change the default view format from Web to Interactive. The Web view format does not provide the capability to modify or add a formula or variable when viewing a report.
Figure 2 shows the Web Intelligence preferences:
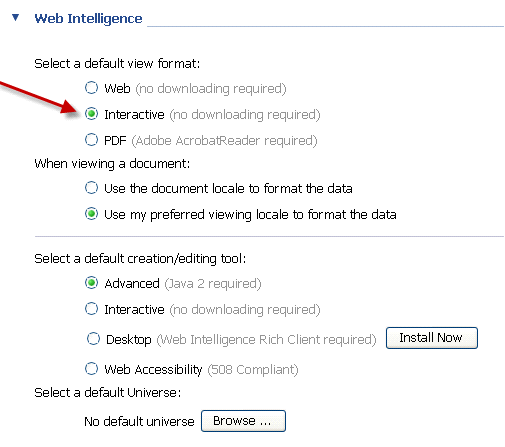
Figure 2
Web Intelligence preferences
After selecting the Interactive view format, be sure to click the OK button in the lower right corner of the window to confirm the preference changes. Once the Interactive viewer preference is set, users have access to three new toolbars when viewing a report:
- Formatting – Font characteristics, text and background color, borders, in-cell alignment
- Report – Alert, sort, filter, break, calculations, insert row or column, order, alignment
- Formula – Create a variable, formula editor, validate, cancel, formula modification bar
A fourth toolbar called report filter is available from both the Web and Interactive viewer, allowing for simple filters to be added on-the-fly while viewing reports.
Tip!
To toggle the toolbars on or off, right-click just beneath the document name to view available toolbar choices.
Formulas and Variables
The primary difference between a formula and a variable is that variables are given names while formulas remain as statements displaying the syntax of the entire calculation. If users want to reuse a formula in various report elements throughout a Web Intelligence document, it’s a good practice to convert formulas to variables to minimize the potential for mistakes. By converting formulas to variables, you also reduce the risk of failing to update a particular instance of a formula if the calculation requirements change over time. Variables provide the least amount of maintenance as every instance of a variable can be modified with only a single change.
To create a formula or variable, begin by enabling the formula toolbar. The shortcut icon to Create a variable is enabled anytime the formula toolbar is visible. If an existing formula displayed in a report element is selected, the shortcut icon changes to Edit a variable.
The Formula Editor icon is enabled when a report element is selected on the report canvas that could potentially display the information returned by the formula.
Figure 3 shows the shortcut icons associated with the formula toolbar.
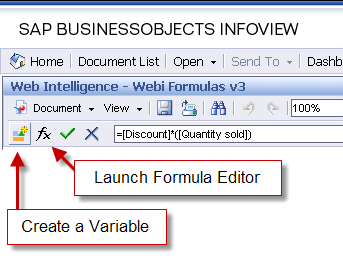
Figure 3
Formula toolbar shortcut icons
Create a New Variable
The next screenshot shows the Create New Variable editor when it’s launched while viewing a report (
Figure 4). Users can launch this editor by clicking the Create a Variable shortcut icon shown in
Figure 3. The dialog is similar to the editor presented while editing a report with only minor differences. Both versions of the variable editor allow users to enter a unique name, define the qualification, and write the formula in a free-hand section. The full list of available objects, functions, and operators are also provided in both versions of the editor for enhanced formula creation.

Figure 4
Create New Variable screen
Use the Formula Editor
The Formula Editor is almost identical to the Variable Editor with one significant difference. Because the Formula Editor primarily creates single-use formulas, there is no option for naming the formula like in the Variable Editor. However, users can convert formulas to variables after they’ve been created.
Figure 5 shows the Formula Editor as it appears when viewing a report.
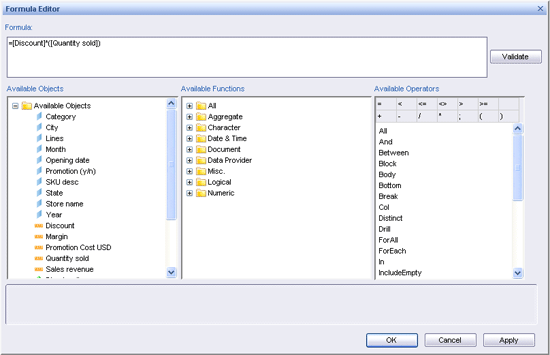
Figure 5
The Formula Editor
Create Formulas with Available Functions
Now that I’ve discussed how to create formulas and variables when viewing reports, the next section provides details and examples of formulas that users can create with the built-in reporting functions in Web Intelligence.
Basic Calculations
Aggregate functions are common in a Web Intelligence report and also are among the easiest to add to a report element. Follow the steps below to add a basic calculation to an existing report block:
- Select an object in a report element to be calculated (commonly a measure)
- Locate the shortcut icon for calculations found on the report toolbar
- Click the small downward arrow icon located immediately to the right of the shortcut icon
Depending on the table element, users have the opportunity to insert the new calculation “to the right” or “at the bottom” of the table element. In other words, insert the calculation as a new column or new row.
Figure 6 shows the six basic calculations available through the report toolbar.
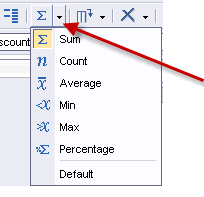
Figure 6
Calculations available in the report toolbar
To modify or create a formula of an existing cell rather than inserting a new column or row, select the position in the table containing the value to be edited and launch the Formula Editor to begin editing the syntax in the formula toolbar.
Aggregate Functions
To access the full list of functions, launch the Formula Editor or Variable Editor as previously described. There are 23 aggregate functions available in these editors. Click a function in either editor to view the syntax structure or to get more help from official documentation.
Figure 7 shows the information available for the RunningAverage() function. The “( )” characters that appear behind a term or phrase indicate that the object is a function. In many cases, functions require arguments or values within the parentheses in order to be validated. Refer to the example syntax of each function to determine if a function can stand alone or if it requires an argument.
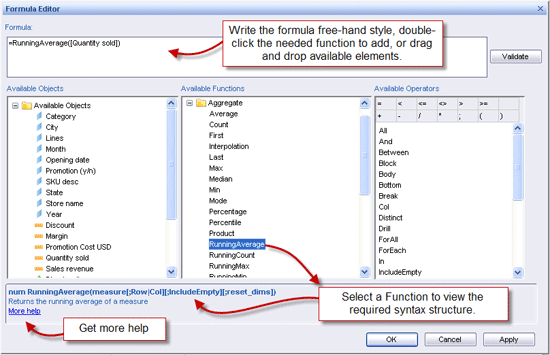
Figure 7
The RunningAverage() function in the Formula Editor
Below are three useful functions for calculating measures cumulatively across time and displaying cumulative values that reset on the change of other dimension values. These functions are useful because they provide a quick and easy way of calculating running values in a report without the need for writing complex formulas:
- RunningAverage()
- RunningCount()
- RunningSum()
RunningCount() and RunningSum() have identical syntax structures, while RunningCount() has a different structure that can return values associated with dimensional objects, not just a measures.
Below are examples of syntax structures and how the Running functions can be written. The first group shows the syntax structure used only to calculate a measure. These calculations are based on an implied dimension object existing in the table element. The second group shows the syntax structure to explicitly include a dimension as part of the calculation. The third group shows how to calculate running values by row or column. And the fourth group shows how to calculate running counts on dimension objects.
Running Aggregations on Measures
- =RunningAverage([Quantity sold]) – Returns the running average of the [Quantity sold] field based on it’s context within the data table where it’s being used.
- =RunningSum([Quantity sold]) – Returns the running sum of the [Quantity sold] field.
- =RunningCount([Quantity sold]) – Returns the running count of [Quantity sold].
Running Aggregations on Measures that Reset on Dimension Change
- =RunningAverage([Quantity sold];([State])) – Returns the running average of [Quantity sold] and resets when the state changes. Note that if a dimension object is included in the formula, the object name must be encapsulated by parentheses in addition to the standard bracket associated with a field object.
Running Aggregations on Measures with Explicit Column and Row Calculations
- =RunningSum([Quantity sold];Col) – Changes the default running calculation type of row to explicitly calculate the running sum by column.
- =RunningSum([Quantity sold];Col;([State])) – Explicitly calculates the running sum by column and resetting on [State].
- =RunningSum([Quantity sold];Row;([State])) – Explicitly calculates the running sum by row and resetting on [State].
Running Count of Dimensions
The RunningAverage() and RunningSum() functions can only calculate measure objects but the RunningCount() function can be used to calculate a running count of dimensions similar to the formulas listed below.
- =RunningCount([State]) – Returns a running count of a state.
- =RunningCount([State];[Type]) – Returns a running count of [State] resetting by [Type].
Character Functions
Character functions allow users to manipulate strings or character dimension values. There are 24 character functions available for formula and variable creation. As an example, below are the details behind seven character functions that describe Texas in the [State] field. Texas is used in the examples below but every state name appearing in the data table would be converted by the reporting function.
- Upper() – Converts dimension values to all uppercase letters.
- =Upper([State]), e.g., returns TEXAS
- Lower() – Converts dimension values to all lowercase letters.
- =Lower([State]), e.g., returns texas
- Length() – Returns the total number of characters in a string.
- =Length([State]), e.g., using Texas, the formula returns 5
- Substr() – Commonly used for creating abbreviations or extracting a portion of a string.
- =Substr(string;start;length)
- =Substr([State];0;3), e.g., returns Tex
- FormatDate() – Allows the user to customize the format of date values. For example, below are the syntax structures for producing dates in five common formats based on February 8, 2011.
- =FormatDate(CurrentDate();"MM/yy"), e.g., returns 02/11
- =FormatDate(CurrentDate();"mmm yyyy"), e.g., returns Feb 2011
- =FormatDate(CurrentDate();"MMMM-yyyy"), e.g., returns FEBRUARY 2011
- =FormatDate(CurrentDate();"MM/dd/yy"), e.g., returns 02/08/11
- =FormatDate(CurrentDate();"Mmmm d, yyyy hh:mm a"), e.g., returns February 8, 2011, 09:51 AM
Date and Time Functions
Date functions are commonly used in the page header of Web Intelligence reports. Functions like DaysBetween() and RelativeDate() display the difference in days between two dates. Examples include calculating the number of days between order date and ship date, ship date and arrive date, or last order date and previous order date. Below is the syntax for three date functions used in a Web Intelligence report:
- CurrentDate() – Displays the date the report or formula is viewed. This formula is commonly used on the page header of printed or distributed reports.
- DaysBetween() – Produces the difference in days between two dates.
- =DaysBetween(CurrentDate();LastExecutionDate(), e.g., returns a number
- =DaysBetween([Spend_Date];[Book_Date], e.g., returns a number
- RelativeDate() – Allows simple addition or subtraction to be applied to a date. Be sure to separate the values with a semicolon.
- =RelativeDate(CurrentDate();-100), e.g., if February 8, 2011, is the current date, 10/31/2010 is the result of the formula above (i.e., 100 calendar days subtracted from February 8).
Document Functions
Use document functions to display details on a report that describes characteristics of the report itself. These types of functions range from retrieving the user name of the document’s creator to displaying the creation date of the document. One of the most helpful functions is available when simple filters are added to a report. In this situation, use the DrillFilters() function to dynamically display a label containing the simple filters selected by a report viewer. Below are examples of document functions:
- DrillFilters() – Commonly used at the top of a report to display the values selected by simple filters.
- =DrillFilters() – Default syntax structure.
- =DrillFilters(“ / “) – Use this syntax to separate multiple drill filters by a space and slash.
- DocumentAuthor() – Displays the logon or user name of the person who created the report.
- DocumentCreationDate() – Displays the creation date the Web Intelligence document.
- DocumentOwner() – A new function available in BusinessObjects XI 3.1, support pack 3, this function is used to display the owner of the document instance rather than just the document author.
Data Provider Functions
Data provider functions allow report writers to display information related to queries in a Web Intelligence document. This includes the date of the last refresh of a query or the user’s response to a prompted filter. The following are examples:
- LastExecutionDate() – Located as a report element in the Formula and Text Cells section as Last Refresh Date.
- LastExecutionTime() – For frequent updates or time-sensitive reports, this function shows the hour, minute, and second of the last refresh.
- UserResponse() – This displays the user’s response to a prompted filter. It is used to display filtered objects values on a report. The main requirement when writing this formula is to provide the prompt text of the prompted filter. Encapsulate the prompt text within double quotes. Optionally, if multiple queries exist within the document, list the data provider name. Enclose this object within brackets.
- =UserResponse([data provider];“prompt text”)
- =UserResponse(“YEAR”), e.g., returns 2006 when the value entered is 2006 and the prompt text is YEAR (the requirement to enter the data provider is optional)
- =UserResponse([DateQuery];"Please select month:"), e.g., returns January when the value entered is January, prompt text is “Please select month:”, and the query containing the prompted filter was previously named DateQuery
Examining a Prompted Filter
Figure 8 shows the Year object in the Query Filters pane after the filter type is changed from Constant to Prompt. When the Prompt type is selected, a new Prompt Properties shortcut icon appears with the filter and a default prompt text label will appear. The prompt text in
Figure 8 is set to YEAR. This text value provides report consumers with an additional description of the prompted filter object and can be modified.
When a query is refreshed that contains a prompted filter, the user’s response can be displayed on a report by using the UserResponse() function. As mentioned in the previous section, the prompt text is required to retrieve the user’s response to the prompted filter.

Figure 8
A prompt filter type


