SAP has simplified financial and management reporting with embedded SAP Business Intelligence (BI) content. Learn how real-time transaction and master data updates in BI enable accurate reporting with most updated key performance indicators (KPIs), thus eliminating the need for a data load into the cubes as in the older versions.
Key Concept
SAP Business Planning (SAP BPC) Optimized for SAP S/4HANA has integrated the Analysis for Office add-in for Excel workbook planning, analysis, and reporting, which was previously available only in the SAP Business Intelligence (BI) and SAP Business Warehouse (SAP BW) worlds. These analyses for office workbook templates can be used for cost object planning processes such as internal order, cost center, and profitability analysis (aka market segment planning) planning.
SAP has introduced a lot of functionality changes with the release of the SAP S/4HANA Finance (formerly sFIN, Simple Finance, and Smart Financials) add-on and also in the new SAP S/4HANA Enterprise Management solution. The solution design approach not only simplifies the underlying architecture but also provides a better user experience.
One of the key changes is in the SAP Integrated Business Planning for finance solution framework, which is now referred to as SAP Business Planning and Consolidation (SAP BPC) Optimized for SAP S/4HANA.
Profitability Analysis (CO-PA) planning can often become quite complex due to user-defined characteristics in CO-PA. Older releases of SAP software used transaction code KEPM for CO-PA planning and used Report Painter transaction codes such as KE31 and KE34 to create reports for analysis. These transactions looked very complex from the end-user perspective. With the innovations in SAP BPC Optimized for SAP S/4HANA, creation of the reports for planning and analysis has become much simpler and user-friendly (mainly due to Excel-based reports).
SAP delivers the following InfoCubes for actuals reporting and planning financial data in SAP Business Intelligence (SAP BI):
- /ERP/SFIN_V01 – Financials Actuals via SAP HANA
- /ERP/SFIN_R01 – Financials Planning
In the older releases, these InfoCubes existed in a separate SAP BW system that had to be loaded with the transactional and master data to enable BI reporting. With the release of SAP BPC Optimized for SAP S/4HANA, these InfoCubes are embedded within the ERP system, thereby eliminating the need to load these cubes. (They are updated in real time.)
In addition to the above InfoCubes, SAP delivers predefined aggregation levels. An aggregation level contains a set of characteristics and key figures from a real-time InfoCube for:
- Cost Center Planning
- Internal Order Planning
- Functional Area Planning
- Market Segment Planning (CO-PA Planning)
- Profit Center Planning
- Profit and Loss (P&L) Planning
The aforementioned InfoCubes and aggregation levels can be readily used. However, complexity arises when you have user-defined characteristics in CO-PA and users want to plan on these dimensions.
In this article, I cover the entire process for creating user-defined characteristics in CO-PA and leveraging SAP BPC Optimized for SAP S/4HANA based on these characteristics for reporting. The release used for this article is SAP S/4HANA 1511 Feature Pack Stack 02 and the version of SAP HANA studio is 2.2.12. SAP HANA studio enables you to manage an SAP HANA database, create and manage database authorizations, and create your own data models.
I describe the following activities that need to be performed for creating user-defined characteristics in CO-PA and leveraging SAP BPC Optimized for SAP S/4HANA based on these characteristics:
- Create user-defined characteristics in account-based CO-PA
- Assign and generate InfoObjects
- Adapt SAP HANA views based on table ACDOCA to report by the user-defined fields
- Create aggregation levels and planning functions
- Set up variable filters in the aggregation level
- Create input-ready BEx queries
1. Create User-Defined Characteristics in Account-Based CO-PA
To complete this step, execute transaction code KEA5 or follow menu path SPRO > IMG > Controlling > Profitability Analysis > Structures > Define Operating Concern > Maintain Characteristics to create characteristics. This path takes you to
Figure 1. (Note that this article does not cover how the values are derived for these characteristics.)
Figure 1 shows an example of seven user-defined characteristics from WWPH1 to WWPH7 in an operating concern that illustrates different levels of the product hierarchy. Planning on these levels helps users analyze profitability and variances at each level of the product hierarchy.
Figure 1 displays how the data structure would look like once you have created and activated the characteristics.

Figure 1
CO-PA data structure
2. Assign and Generate InfoObjects
To complete this step, execute transaction code FCOM_RKEGEN. This action opens the screen in
Figure 2 in which you generate InfoObjects for the user-defined characteristics. This step allows mapping of BI characteristics to CO-PA characteristics and also allows generation of BI characteristics for the user-defined characteristics. SAP-delivered characteristics are already mapped, and you have to execute this step only when new ones are created or if there is a need to change the mapping of existing ones.
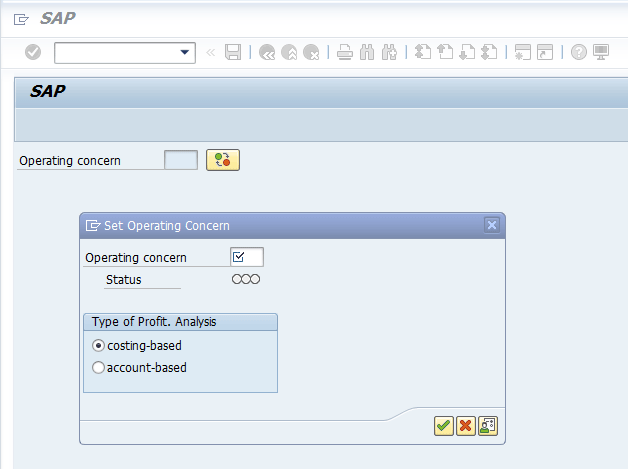
Figure 2
Enter the operating concern (account based)
SAP-delivered characteristics would be in the /ERP/ namespace, whereas user-defined characteristics or characteristics that have yet to be generated would be in the /RKE/ namespace.
To perform the mapping, execute transaction code FCOM_RKEGEN. This action opens the screen in
Figure 2.
Select the Operating Concern check box in the pop-up screen. (This pop-up window appears only if you have not set your operating concern in the transaction code KEBC. If for any reason you would like to set a different operating concern than the one set in KEBC, then you click the display mode active/inactive icon

to revise it.)
In the next screen (
Figure 3) follow menu path Op.Concern > Continue to generate InfoObjects for the user-defined characteristics.

Figure 3
Select the Continue option
This action opens the screen in
Figure 4. All the fields already mapped to BI InfoObjects have a green light (

) status in the Ge… (generation status) column and all those that are unmapped have a red status

. Click the execute icon to accept the system-suggested InfoObject mapping in the namespace /RKE/ in mass mode. To map one field at a time, click the change icon

. After the mapping is completed, all the user-defined characteristics should have a green light status as shown in
Figure 4.
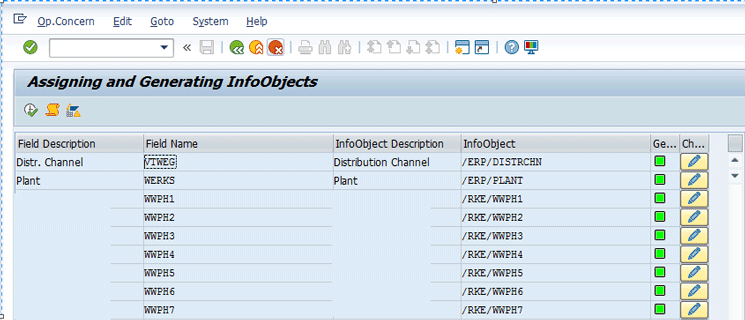
Figure 4
InfoObjects in BI
This step also creates master data views in the underlying SAP HANA database, if the user-defined characteristics have master data, in the package system-local.sap.erp.sfin.co.pl that is used for master data access by BI characteristics. To verify the views, log on to SAP HANA studio and navigate to the views by expanding the node system-local > sap > erp > sfin > co > pl > Attribute Views (
Figure 5). You should now be able to see the views from FCO_RKE_WWPH1 to FCO_RKE_WWPH7.
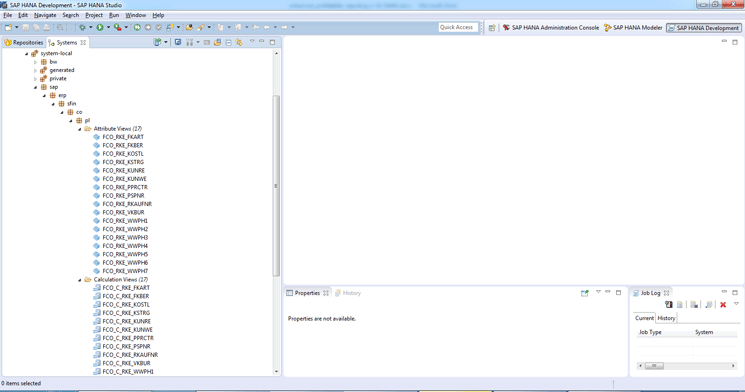
Figure 5
SAP HANA studio
3. Adapt SAP HANA Views Based on Table ACDOCA to Report by the User-Defined Fields
A prerequisite to work with SAP HANA views is to have SAP HANA studio installed locally on your machine.
The following relevant SAP HANA views must be adapted to report on the new CO-PA characteristics:
- sap.erp.sfin.fi.gl.FAC_ACDOCA_COM
- sap.erp.sfin.fi.gl.FAC_GLACCT_LINE_ITEM_COM
- sap.erp.sfin.co.pl.FCO_C_IBP_ACDOCA
Create your own package in SAP HANA studio. This package will have the adapted (Z version) SAP HANA views that are based on the SAP HANA views mentioned above.
For example, in
Figure 6 a new package IBPF has been created. Copy SAP HANA views FAC_ACDOCA_COM and FAC_GLACCT_LINE_ITEM_COM to CA_FAC_ACDOCA_COM and CA_FAC_GLACCT_LINE_ITEM_COM, respectively, and place them in this package.

Figure 6
Package in SAP HANA studio sap.erp.sfin.fi.gl
To do this, simply locate the SAP HANA view, right-click, and select the Copy function. Then right-click the IBPF package and select the Paste function. After pasting, rename the views in the IBPF package to your own naming convention. In this example, I have just prefixed the views with CA.
FAC_ACDOCA_COM > CA_FAC_ACDOCA_COM
FAC_GLACCT_LINE_ITEM_COM > CA_FAC_GLACCT_LINE_ITEM_COM
Note
IBPF is just how I labeled this package. You can give your own name to this package at the time of creation.
Additionally, create a package IBPF (you can name the package as you wish as mentioned earlier) as in
Figure 7 in namespace sap.erp.sfin.co.pl. Copy view FCO_C_IBP_ACDOCA to CA_FCO_C_IBP_ACDOCA and place it in the package. Follow the steps on how to copy and paste in the custom package described in the above paragraphs.

Figure 7
Package in namespace sap.erp.sfin.co.pl
In the custom SAP HANA views of CA_FAC_ACDOCA_COM and CA_FAC_GLACCT_LINE_ITEM_COM, select the user-defined characteristics of CO-PA from table ACDOCA and right-click each user-defined characteristic to choose the Propagate to semantics option. This step activates the CO-PA characteristics in the views.
4. Create Aggregation Levels and Planning Functions
In this step you create aggregation levels in transaction code RSA1. RSA1 gives you access to a data warehouse modeling cockpit where you can create your own InfoAreas, InfoObjects, and InfoCubes, based on which you then can create aggregation levels. This is also a core transaction from which you can create and manage BI transports. As you can see in
Figure 8, the left side of the menu options highlighted in green lets you create new DataSources based on which you can create the aggregation levels, as shown in the right side of the
Figure 8.

Figure 8
Data warehousing modeling workbench
Note
Detailed navigation of RSA1 or the data warehousing modeling workbench is not in the scope of this article.
If you are familiar with creating aggregation levels in BI or SAP BW, then you can create your own. Otherwise, you can request help from a BI resource on your team to create these levels. Basically, these aggregation levels are used for creating the BEx input-ready queries.
To prevent any changes to SAP-delivered settings, I recommend that you create your own InfoArea and set up aggregation levels and planning functions under this area.
Figure 9 shows the aggregation level by which the key measures such as amount and quantity are aggregated. You can navigate to these levels by double-clicking any of the aggregation levels in
Figure 8. Aggregation of the amounts and quantities posted to general accounts happens by profit center and seven levels of product hierarchy in this example.

Figure 9
Aggregation levels
5. Set Up Filters for the CO-PA Planning Distribution Function
In this step you set up variable filters for each InfoObject. As shown in
Figure 10, variables have been created and assigned to each InfoObject. By doing this, you restrict the characteristics to certain values, intervals, or hierarchy nodes so that users have access to only relevant datasets. SAP-delivered variables start with /ERP/, but user-defined variables do not follow this format. For example, P_WWPH1 is a user-defined variable filter for the InfoObject /RKE/WWPH1. These filters can be used to restrict data during reporting, analysis, and planning.
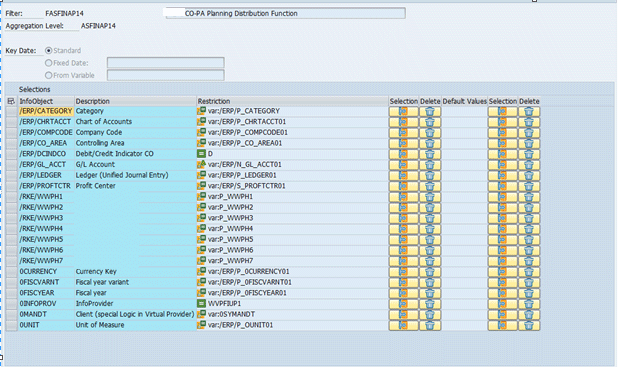
Figure 10
Planning distribution function
Note
The system highlights /ERP/CATEGORY by default when you get to the screen in Figure 10.
To create a filter right-click the aggregation level (for example, the aggregation level of ASFINAP14 in
Figure 8). Choose the Create Filter option or run transaction code RSPLAN and select the Filter option to create. Choose an aggregation level in which you want to create these filters (ASFINAP14 in this example).
Create variables (
Figures 11 to
16 show how to create a variable) and restrict the InfoObject to these variables or values. SAP delivers pre-defined variable filters for standard InfoObjects. Here are the steps to create your own variable for user-defined InfoObjects (for example, /RKE/WWPH1).
Note
In Figure 10, variable filter P_WWPH1 has already been assigned. Therefore, in the steps below, I show you how to create new variable filter Z_WWPH1.
Click the detail view icon

shown in
Figure 11.

Figure 11
Click the selection icon
In the next pop-up window, in the Selection field select S – Single Values, and in the View field, select V – Variables as shown in
Figure 12. Click the create icon

.

Figure 12
Select Single Values and Variables
Name the variable as mentioned earlier as Z_WWPH1 and enter a long description. Select 5 – User Entry/default type in the Processing type field (
Figure 13). Other options are not part of the scope of this article. Click the next step icon

.
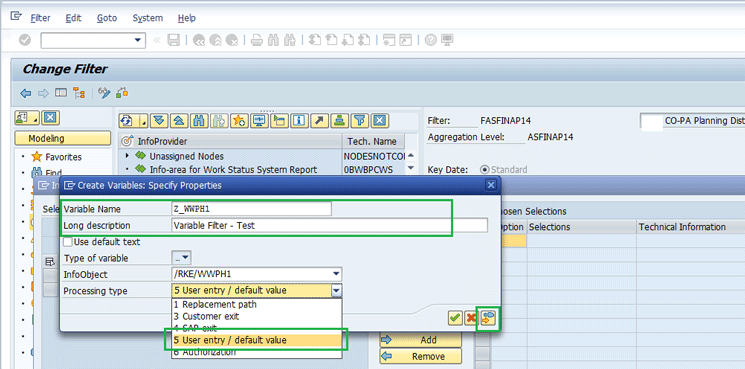
Figure 13
Enter the variable name, enter a long description, and select a processing type
In the next pop-up window (
Figure 14), select P – Single Value in the Variable Represents field and 0 – Optional Variable Entry in the Entry Required field. Select the Variable Is Ready for Input check box. Other options available for these fields are not covered in this article. Click the next step icon.

Figure 14
Select the options
No entry is required in the Default Value(s) pop-up window (
Figure 15). Click the next step icon again.

Figure 15
No Entry is required for Default Value(s)
In the Create Variables: Overview and Save pop-up screen, click the save icon (
Figure 16). This step completes the creation of variable filter.
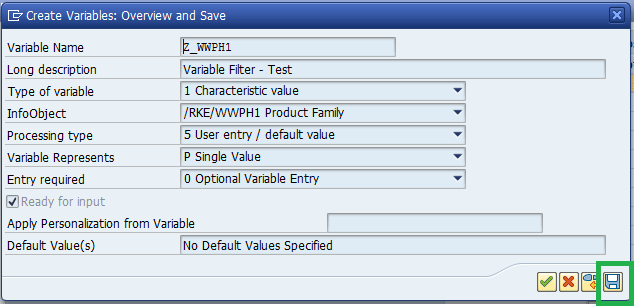
Figure 16
Click the save icon
After you save your data, the new variable filter Z_WWPH1 appears in the list (
Figure 17).

Figure 17
New Variable filter Z_WWPH1 is created
To assign this to the InfoObject, for example to /RKE/WWPH1, select the row in which Z_WWPH1 is located and click the Add button (
Figure 18).
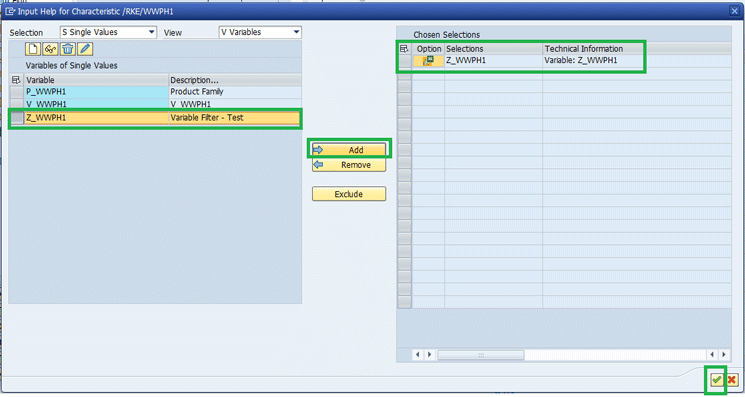
Figure 18
Click the Add button to move the variable filter to the Chosen Selections section on the right
Click the continue icon

. This action displays the screen in
Figure 19. Note that
Figure 19 includes the new variable filter Z_WWPH1 assigned to the InfoObject
/RKE/WWPH1.
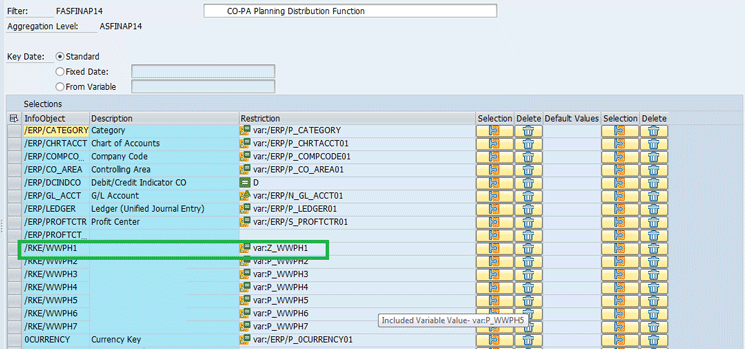
Figure 19
New variable filter assigned to InfoObject
This step completes the process of creating a new variable filter.
SAP offers a few default planning function types (such as copy, delete, repost, revaluate, distribute by reference data or by key, unit and currency translation, or FOX formula). Planning function types are procedures that can be parameterized and that change transaction data within SAP BI Integrated Planning. In this example, the planning function types include copy, delete, and distribute by reference data and by key.
Figures 20 to
23 represent these planning function types.
Just as you did when creating a filter mentioned above, you set up the planning function type for an aggregation level by right-clicking the aggregation level and selecting the Create Planning Function option. Please refer to step 4 on how to navigate to an aggregation level using transaction code RSA1. Select one of the options in the drop-down menu in the Function Type field, for example, 0RSPL_DELETE (
Figure 20). Alternatively, execute transaction code RSPLAN, select Planning Function, and click the Create button. Select the function type you want to create in the aggregation level. Repeat the steps for creating other function types 0RSPL_COPY, 0RSPL_DISTR_REFDATA and 0RSPL_DISTR_KEY. These planning function types are SAP delivered.

Figure 20
Planning function type delete
You use the Delete function type to delete the key figure values for the selected data records. No characteristics values are changed or deleted (
Figure 20).
In the distribution function type you select the Posting period radio button only if you want the total planned key figures (amounts and quantities) to be distributed evenly across the periods upon execution of this planning function (
Figure 21). All the other characteristics remain constant.
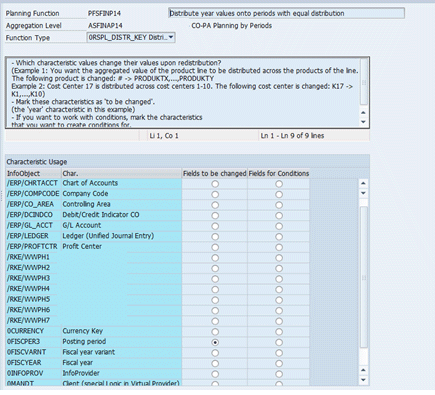
Figure 21
Planning function type distribution by key
Another option for the distribution function is distribution by reference data. This planning function works the same as distribution by key except that it uses a reference data set. For example, if you change the net result of a certain combination of characteristics in the planning spreadsheet in a period, then all the key figures (Revenue and COGS) are automatically adjusted in the period (top-down distribution) for that combination of characteristics. The percentage distribution corresponds to the percentage distribution in the reference data. Therefore, when you set up this planning function type, you select the Posting period as the field to be changed. You complete this step by going to the row in which the posting period appears and selecting the radio button under the Fields to be changed column as shown in
Figure 22.
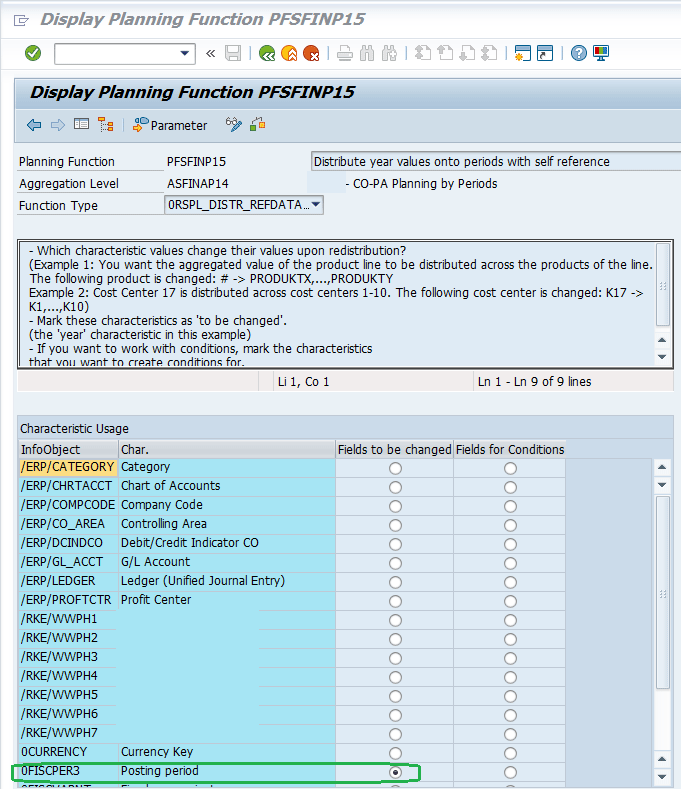
Figure 22
Distribution by reference data
The copy planning function type is used to copy the key figure values from existing characteristic combinations to other characteristic combinations. In this example, you select the Category, Fiscal Year, and InfoProvider radio buttons because you want to copy key figures from one planning category to another category or one fiscal year to another (
Figure 23).
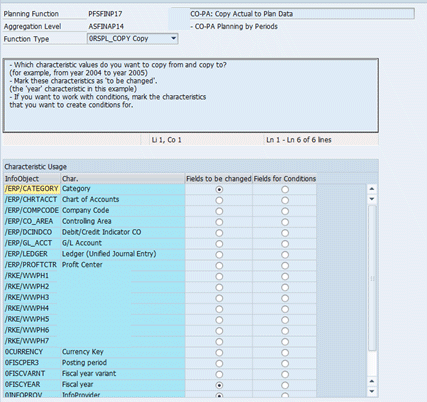
Figure 23
The copy planning function type
6. Create a BEx Input-Ready Query
The final step is to create a BEx input ready query. If you are adept at creating queries you can either do it yourself or you can request help from a BI or BW resource on your team. To create a query you need BEx Query Designer. The Query Designer version I used for this article was BI Add-on 7.x (based on 7.40) Support Package 3.
Figure 24 shows an example query. The query created is based on the aggregation level that was created in the previous steps.

Figure 24
BEx input-ready query
Note
The steps to create a query are not in the scope of this article.
A sample BEx query in
Figure 24 shows the aggregation of amounts and quantities based on the seven levels of product hierarchy plus the profit center.
The query displays data by each individual period in each column as shown in
Figure 25 and a column for the totals. This layout is flexible and can be changed based on user requirements. If needed, this query can also be exposed to Open Data Protocol (OData) services to be run via SAP Fiori applications.
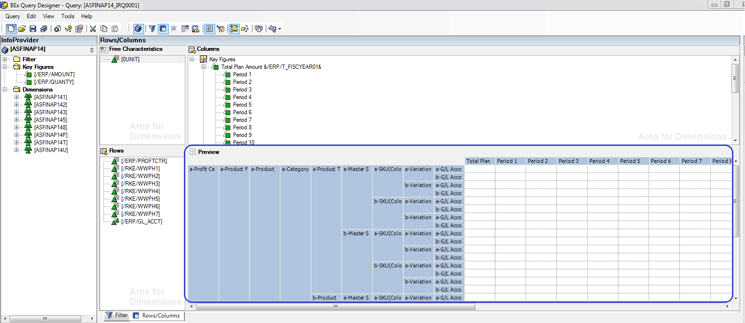
Figure 25
Preview of rows and columns when you run the input-ready query for planning and reporting
Now you are ready to run the query using the Analysis for Excel add-in. Install the Analysis plug-in for Excel using SAP BusinessObjects Analysis, edition for Microsoft Office. The add-in version I used in this example is 2.3.2. SAP recommends that you use the most recent version of this add-in.
Figure 26 shows how you can access the add-in. The add-in can be accessed either via the File menu of Excel or the menu bar option Analysis. After opening a blank new Excel file, go to File >Analysis > Open Data Source OR open an Excel file and go to Analysis (menu option) > Insert Data Source to open a BEx query via the Analysis add-in.
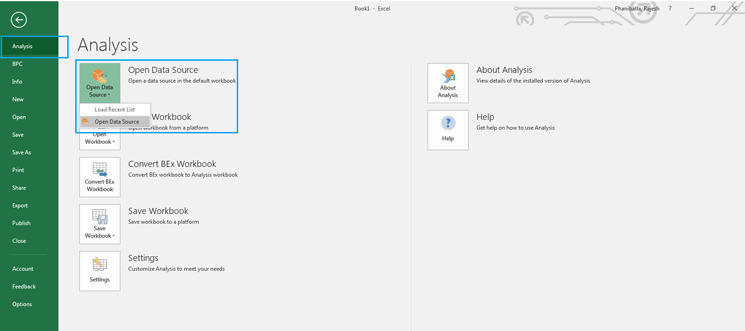
Figure 26
The Analysis add-in
Click the Open Data Source button to log on to the SAP S/4HANA back-end system. This action displays the SAP connections on the Logon to System pad (
Figure 27).
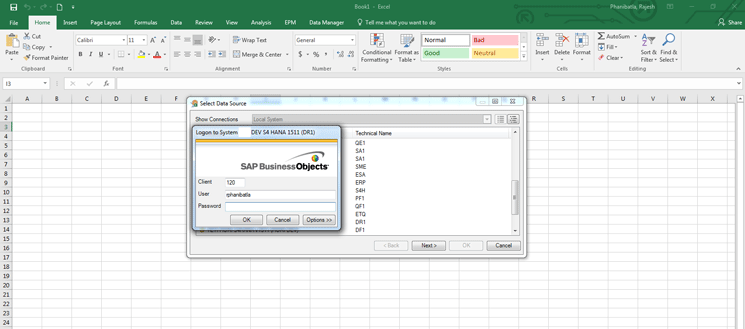
Figure 27
Log on to SAP S/4HANA
Search for the input-ready query that was created in the previous steps. For example, enter the description or technical name of the query. In
Figure 28 I entered the technical name ASFINAP14 with the query radio button option at the bottom of the pop-up. Press Enter.
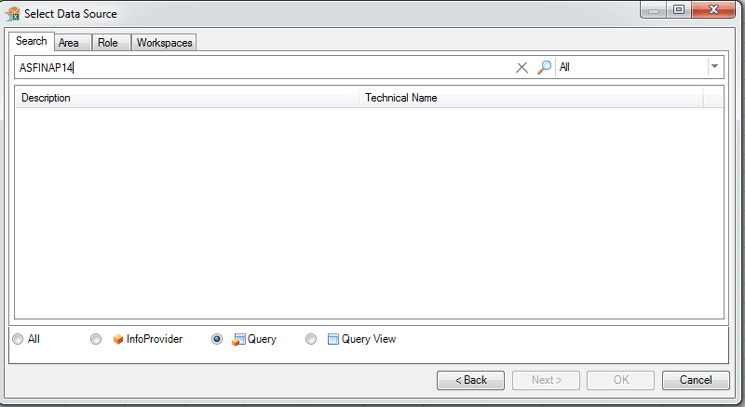
Figure 28
Search bar for query
The search result is displayed as shown in
Figure 29. Select the query and click the OK button.
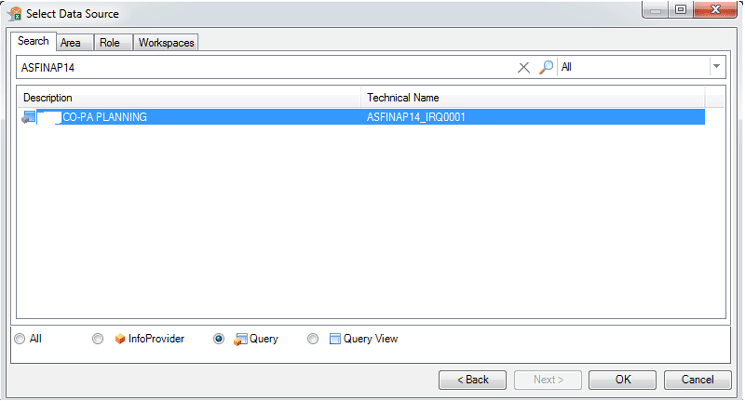
Figure 29
Search result displayed
After you click the OK button, the Prompts pop-up screen appears (
Figure 30).
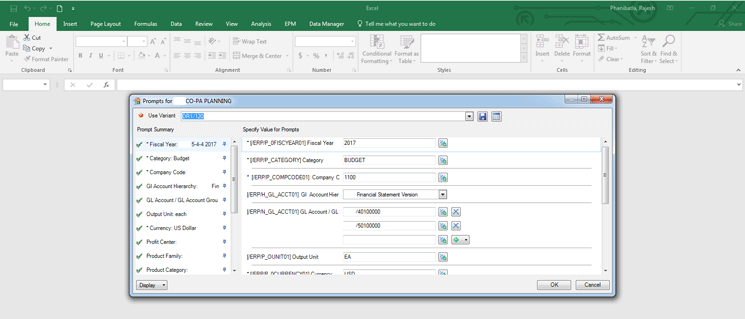
Figure 30
Variable prompts
Note that the fields with an asterisk are mandatory in
Figure 30. In the /ERP/H_GL_ACCT01 field (G/L account hierarchy) select Financial Statement Version from the drop-down list of options. In the older SAP versions, you had to load the hierarchies of general ledger (G/L), cost centers, and profit centers into BI every time you made a change to them. This is no longer required in the embedded BI of SAP S/4HANA as all the master and transactional data is accessed in real time. These parameters can also be saved as user-specific variants so that you do not have to type them each time.
Note
Implement SAP Note 2433659 in case your changes in G/L Account hierarchies are not reflected in Excel-based Analysis for office reports.
Input the selection parameters in the variable prompt and click the OK button to display the report output in the next screens (
Figures 31 to
33).
CO-PA report output displays net result and key figures at each level of hierarchy as in
Figure 31. Column A to Column R represent the CO-PA dimensions and their descriptions. The layout is fully customizable with various options available in Analysis add-in. These options are not in the scope of this article.

Figure 31
CO-PA report output
In
Figure 32, you can input plan values of amounts in each period in the columns T to AE.

Figure 32
CO-PA report output – input-ready amount planning fields (columns T to AE)
In
Figure 33, you can input plan values of quantities in each period in columns AG to AR.
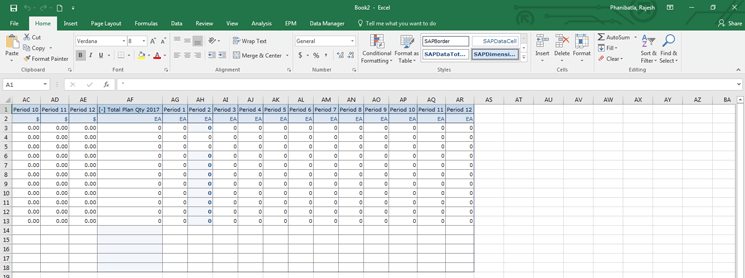
Figure 33
CO-PA report output – input-ready quantity planning fields (columns AG to AR)
In
Figures 32 and
33 (all three
Figures 31 to
33 represent an entire spreadsheet) each column from T to AE in
Figure 32 represents the amount fields, and AG to AR in
Figure 33 represents the quantity fields. The amounts and quantities can be planned by each period in these columns. The system displays the net result at each level of the CO-PA dimension.
To plan for a new CO-PA segment, enter the new characteristic values in the blank rows highlighted in the green box in
Figure 34.

Figure 34
Planning rows
The number of rows can be increased or decreased based on the CO-PA dimensions to be planned by clicking the Display Design Panel option as shown in
Figure 35.
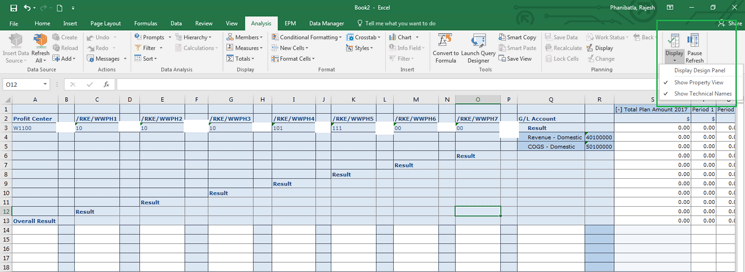
Figure 35
Design panel
Once the design panel is enabled, click the Components button as shown in
Figure 36 and then double-click Crosstab 1 (highlighted in green box) in
Figure 36. Increase or decrease the number of lines by selecting the up and down arrows in the Planning Number of new lines field.
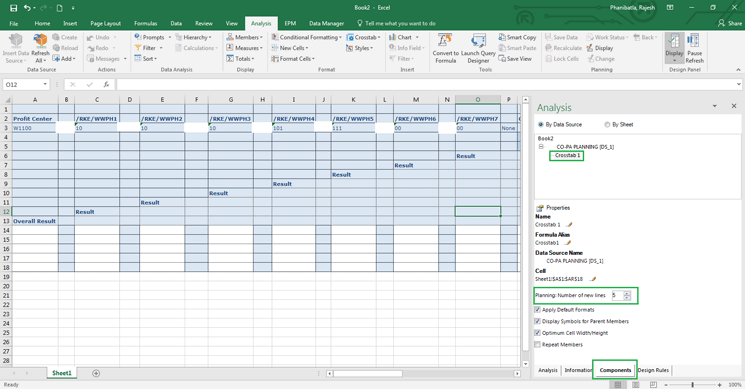
Figure 36
Increase or decrease the number of plan input rows in the Excel Add-in Analysis menu option
After you enter planning amounts and quantities in Period 1 to Period 5 as shown in
Figure 37, click Save Data (
Figure 38). You can get to the columns by scrolling over to the right on the spreadsheet.
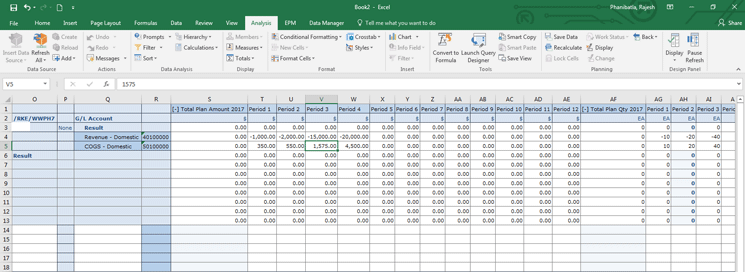
Figure 37
Planning amounts and quantities
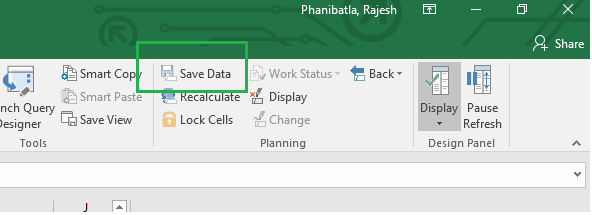
Figure 38
Click Save Data
This step updates the plan cubes with the plan values and they then can be used for reporting plan or actual variances through MultiProviders. Remember that actual values from the SAP S/4HANA system are updated in real time in actual SAP BW cubes.
Various reporting requirements can be met using the steps detailed above. For example, you might want separate reports for plan only, plan versus actual, and actual reporting. Exit variables can be used to create reports based on dynamic variables such as rolling period forecasts.
There are various advantages to building CO-PA reports based on the embedded SAP BW technology compared with conventional CO-PA reporting in SAP ERP Central Component (ECC). Several advantages are listed below; however, you still have to rely on traditional Report Painter reports for costing-based CO-PA.
Advantages of CO-PA reporting through SAP BPC Optimized for SAP S/4HANA include:
- You can override a limitation of nine leading CO-PA characteristics. This feature enables a contribution margin to be analyzed by more than nine leading characteristics that previously were part of a limitation. In this example, users can analyze a margin by seven levels of product hierarchy plus any additional dimensions.
- Real-time replication of G/L account, cost centers, or profit center hierarchies (eliminates the data load task)
- Excel-based output for users
- Reports can be saved as workbooks and refreshed for updated data
Rajesh Phanibatla
Rajesh Phanibatla is an SAP FI/CO architect at Hitachi Consulting US SAP Practice. With more than 13 years of consulting experience, Rajesh has been part of SAP full lifecycle implementation, enhancement, and production support projects. He holds a master’s degree in business administration with a finance major and has been part of SAP S/4HANA and SFIN Add-on (version 1.0 and release 1503) implementations.
You may contact the author at
rajesh.phanibatla@hitachiconsulting.com.
If you have comments about this article or publication, or would like to submit an article idea, please contact the
editor.


