Companies running SAP ERP Central Component (SAP ECC) or other Business Suite applications on SAP HANA can use HANA Live virtual data models for BusinessObjects-based operational reporting without SAP NetWeaver Business Warehouse (SAP NetWeaver BW). In addition, you can analyze data based on Advanced Planning and Optimization (APO) data to provide a full logistics picture quickly without including SAP NetWeaver BW.
Key Concept
HANA Live is a new technical platform for operational reporting. Knowing the basics of the tool set enables you to position and prioritize the rollout of this new data analysis application.
The implementation of operational reporting with SAP has come full circle with HANA Live. Originally, R/3 (the older, but not oldest name for SAP ERP Central Component [SAP ECC]) had tools to allow users to create reports off the tables used by the core ERP applications. For example, you could create a logical join of various tables using ABAP Query/Classic InfoSets, and then you could report against this data with the InfoSet query tool, transaction SQ02.
However, using these tables directly on the source system had a drawback: poor performance. Reports against big transactional tables that were optimized for saving data quickly did not support quick reporting access. SAP realized that the volumes of data would choke the logistics system, so 15 years ago SAP rolled out a fix called Logistics Information System (LIS), which provided a BW-like summary table to speed up summary-based reporting.
The next progression was the moving the data at a detailed level to a separate BW system stored in DataStore Objects (DSOs). SAP also added indexes, and the cubes summarized the data. This is the classic BW solution shown in
Figure 1. You extract, transform, and load the data into DSOs, index them, and then use the query to feed data to either BW (BEx) or BusinessObjects reporting tools.
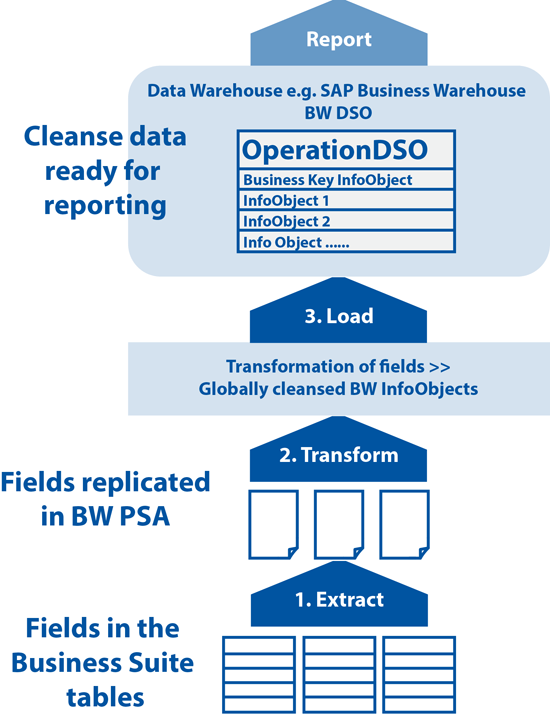
Figure 1
The BW-based operational reporting environment via extraction, transformation, loading
The new HANA Live solution (previously called the HANA Analytics Framework) takes you back to the start. HANA Live enables you to use the tables on the source system with the aid of the modeling application built into HANA. HANA Live can access the data directly for reporting. This scenario is different from operational reporting pre-BW, however, because of the HANA database. When the ERP Business Suite runs on HANA, the rules change radically.
Overview of HANA
HANA is a hardware and software solution that packages many multicore central processing units (CPUs) on multiple blades that are packed with a huge amount of random-access memory (RAM).
Table 1 lists the reasons for the fast access speed.
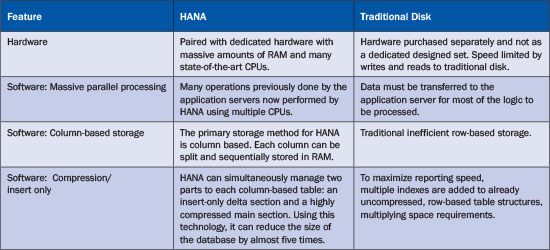
Table 1
A comparison of HANA and pre-HANA functionalities
Data warehouses exist to offload capacity, improve speed of access, and allow data to be homogenized via business rules with other source system data for global and strategic reasons. You need BW for the latter reason, but not so much for speed.
With regard to operational reports, the need to move the data to BW is nearly eliminated because operational reports almost always use local data structures and field names without many business rules applied. Remembering that you still need BW for globally cleansed cross-system strategic data analysis, you now can apply HANA LIVE to fill the reporting requirements.
HANA Live Basics
Following is an introduction to HANA Live from a logistics perspective. It is not intended to be a how-to guide.
HANA comes with HANA Studio, the user interface (UI) for HANA. The UI contains a modeling engine (similar to Microsoft Access) that enables you to create database information views (collections of tables joined at runtime). HANA Studio also comes with an embedded XS Engine (Web Application server lite) that allows the development and deployment of Web-based applications.
There are other pieces of the HANA database, but these two components are the ones that combine to bring you HANA Live. The information views are the deployable objects that can be accessed by the BusinessObjects reporting tools, whereas the XS engine supports a delivered Internet application that enables you to investigate which views are available.
Installing HANA Live is in many ways analogous to installing content objects for SAP NetWeaver BW. The mechanism to deliver the content is, however, HANA specific. All HANA information views are created in folders within the HANA Studio. Within this studio is the Modeler Perspective, a collection of smaller UI windows organized optimally for a modeler’s function. Within the Modeler Prospective, you access a folder called content. Within this content folder another folder structure exists, called packages. These packages are the folders that contain the delivered information views that make up HANA Live.
Installing HANA Live is in essence the download of an SAP-delivered package containing these delivered HANA information views to support HANA Live. In addition, a package includes the delivered HANA Live Internet application (the HANA Live Browser). As I discuss later, the HANA Live Browser is a tool to search for HANA Live views. Finally, regarding logistics, there is another component, a delivered application called the Supply Chain Info Center. Also installed via a downloadable package, the Supply Chain Info Center shows inventory availability based on projected future uses of the inventory.
After implementation, users can create their own packages for organizing HANA Live views that were copied from a standard SAP system and then modified to include new fields. The basic implementation steps are highlighted in
Figure 2. Obviously, HANA Live requires HANA, but some companies are not ready for or can’t afford a total conversion to SAP ECC running on HANA.
For this reason,
Figure 2 shows two high-level implementation strategies. The preferred integrated installation is just another name for SAP ECC running on the HANA database versus DB2, Oracle, or SQL Server. The option on the right side of
Figure 2 shows a solution in which HANA is “bolted on” to your SAP ECC system, the so-called sidecar scenario. In this scenario, you use an SAP data replication tool called SAP Landscape Transformation (SLT) to move records from SAP ECC to HANA in near real time.
Note
You can find more information in the HA900 class and the details in the administrator's guide to HANA.
Click here for details.

Figure 2
Basic implementation steps for installing HANA Live
The Basis team (system or database administrators) usually performs the steps outlined in
Figure 2. The installation steps are just an overview. For more details,
click here to review the SAP install documentation. The side-by-side (sidecar) solution involves SAP ECC running on a non-HANA database with a separate standalone HANA appliance. The appliance hosts the replicated SAP ECC tables and the HANA Live views.
Data Models Delivered with HANA Live for Logistics
Because this is a logistics-focused article, the rest of the details target HANA Live content delivered for logistics. I review the delivered views that can be deployed with HANA Live right out of the box. Using the delivered Internet application that I discussed in the HANA Live Basics section above, the HANA Live Browser, you can browse logistics content. You can drill into fields and underlying tables in tabular and graphic formats that make up the views that the SAP system delivers.
The HANA Live Browser enables you to view HANA Live content in various formats. For example,
Figure 3 shows the navigation tree of the HANA Live Browser focusing on logistics content.
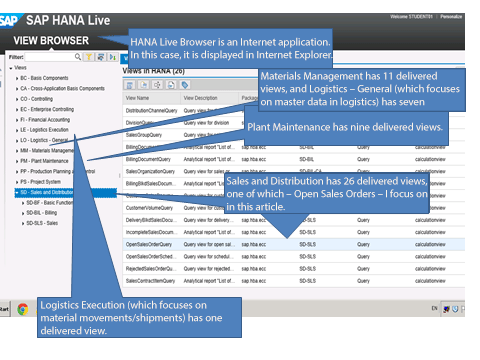
Figure 3
HANA LIVE Browser: Navigation Tree
As shown in
Figure 3, logistics for HANA Live consists of more than 50 different views in all logistics areas. These views access almost every important table. The purpose of this navigation mode of the HANA Live Browser is a high-level review of the available views with which to start your reporting development. Once you find a view with a title that seems to indicate that it holds the logistics information you need, you must verify the fields available in the view. To be sure it is the data you need, review the underlying SAP ECC data tables that make up the view.
Figure 4 shows the first of these investigative views. This view is a detailed field list for Open Sales Orders, one of the more commonly used sales and distribution views. It shows the common fields you can use in reporting off this view – for example, SalesOrder, DistributionChannel, and SalesOffice.

Figure 4
A field list in the Open Sales Order calculation view
As mentioned previously, the next step is to examine the underlying tables from which the view sources the data.
Figure 5 shows higher-level perspectives about the content of the example, Open Sales Order view. One perspective shows the underlying tables in list form. With the graphical presentation perspective, there are two options. The option shown in
Figure 5 depicts the table labels. The other option has the technical names of the tables used in the view.

Figure 5
Different perspectives of the underlying tables of the HANA Live Open Sales Order view
The last peek into the makeup of these HANA Live views comes via the Modeler Perspective of HANA Studio. As mentioned previously, HANA Studio is the UI in which modeling (view development or modification), application development (for Web-based applications using HANA XS as the Web Application Server), and database administration tasks are performed.
Figure 6 shows the same HANA Live view Open Sales Orders, but this time in the HANA Studio’s Modeler Perspective. It is in this perspective that delivered objects are copied and modified.
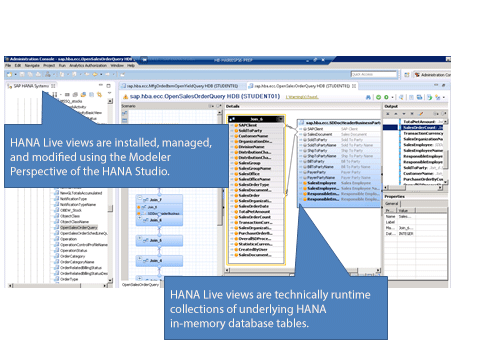
Figure 6
The Open Sales Orders view as shown in the HANA Studio (ready for copying and subsequent modification to company specifications)
Deploying HANA Live Views
Now that you know the basics of how to find HANA views that have been downloaded or downloaded, copied, and modified, you have to see data to actually use views. The tools I discuss and recommend in this section are all part of the BusinessObjects suite of tools, although it is possible to deploy other third-party tools on top of HANA. In addition, custom, HTML5-based Web applications also can be developed to use the data from HANA Live views. I discuss one such application, the Supply Chain Info Center, later.
Figure 7 summarizes the deployment options I endorse. They are the same ones SAP promotes for other HANA views modeled from scratch by HANA modelers.
Figures 8 through
13 show what each reporting application listed in
Figure 7 looks like.
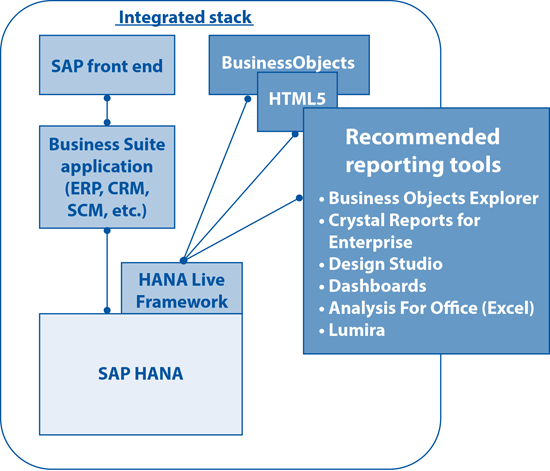
Figure 7
Consuming HANA Live views
Business Object Explorer (
Figure 8) provides a UI targeting executives and information consumers.
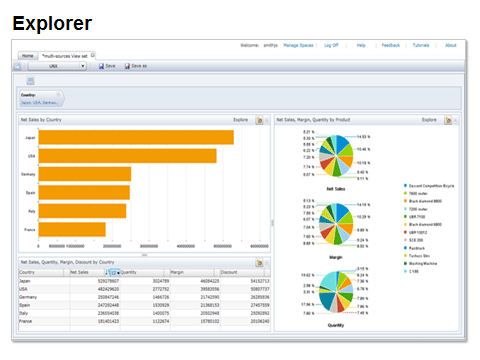
Figure 8
BusinessObjects reporting tools for HANA: Explorer
Crystal Reports Enterprise (
Figure 9) provides a formatted, more static output for presentations that are not designed to slice and dice.
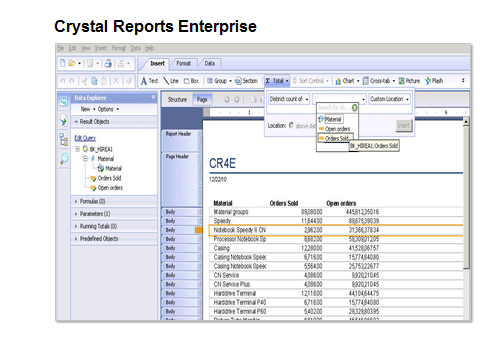
Figure 9
BusinessObjects reporting tools for HANA: Crystal Reports Enterprise
Figure 10Figure 11
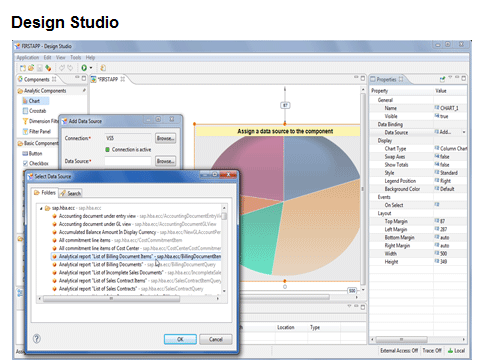
Figure 10
BusinessObjects reporting tools for HANA: Design Studio
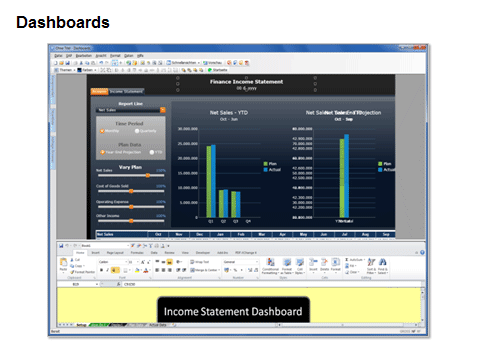
Figure 11
BusinessObjects reporting tools for HANA: Dashboards
Targeting the analyst, SAP offers Analysis Office (
Figure 12) for complex analysis tasks both on the Web and in Excel, and Lumira (
Figure 13) as a dedicated graphing engine.

Figure 12
BusinessObjects reporting tools for HANA: Analysis Office
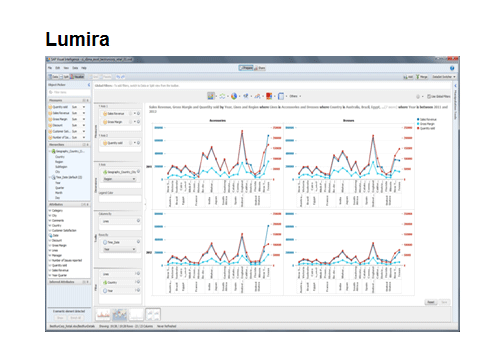
Figure 13
BusinessObjects reporting tools for HANA: Lumira
Note
Design Studio was previously called ZEN, and Lumira was previously called Visual Intelligence. Dashboards was previously called Xcelsius. Design Studio (SAP class BOD310) is poised to replace BEx Web Application Designer and BusinessObjects Dashboards in many or even most situations.
Web Application for Logistics Based on HANA Live: Supply Chain Info Center
Shown in
Figure 14, the Supply Chain Info Center is a collection of different highly graphical representations of supply and demand data for manufacturing companies. It uses data from the Demand Planning (DP) and Supply Network Planning (SNP) application tables of APO. Because these data tables reside at least temporarily in your non-HANA APO system, you need to replicate them to SAP ECC on HANA or sidecar HANA to use this HANA Live Web application. This is usually done using SLT. It provides near real-time access to your non-HANA APO system tables. Once the tables are replicated and the HANA Live objects that use the tables are deployed, planners see a much-improved interface to monitor APO’s demand and supply data. This interface enables organizations to make more timely decisions on replenishments and transfers throughout the supply chain.

Figure 14
APO data displayed in the HANA Live Web application: The Supply Chain Info Center
Ned Falk
Ned Falk is a senior education consultant at SAP. In prior positions, he implemented many ERP solutions, including SAP R/3. While at SAP, he initially focused on logistics. Now he focuses on SAP HANA, SAP BW (formerly SAP NetWeaver BW), SAP CRM, and the integration of SAP BW and SAP BusinessObjects tools. You can meet him in person when he teaches SAP HANA, SAP BW, or SAP CRM classes from the Atlanta SAP office, or in a virtual training class over the web. If you need an SAP education plan for SAP HANA, SAP BW, BusinessObjects, or SAP CRM, you may contact Ned via email.
You may contact the author at
ned.falk@sap.com.
If you have comments about this article or publication, or would like to submit an article idea, please contact the
editor.