3 minute read

Last year SAP enhanced their tool called Visual Intelligence and made it much more user friendly. In general, the graphs became more advanced, while the self-service data visualization development effort was simplified. They also renamed the tool Lumira. In this blog I’ll take a quick look at some of the features of this tool and provide a couple of demos.
Overview
Explore related questions
Ask SAPi
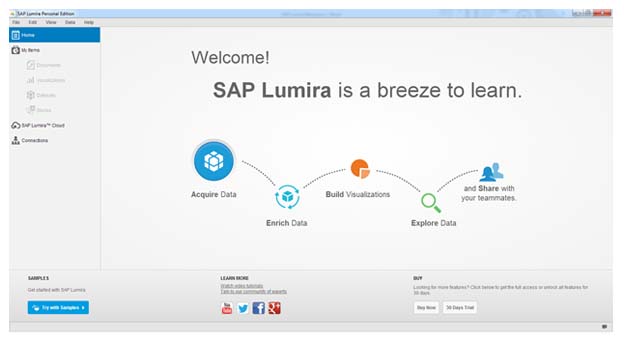
Basically, SAP Lumira enables business users to access, transform, and visualize data of any size in a repeatable and self-service manner. The tool emphasizes a simple user-friendly interface and creates very captivating visualizations which allow users to swiftly analyze data without the need for scripting.
SAP Lumira’s drag-and-drop interface is easy to become familiar with, and with a few clicks data from multiple sources can be gathered, combined, and visualized. After the tool is installed and system access is setup, training is really not needed, but some basics by someone who knows the tool can be helpful.
SAP Lumira’s capabilities include:
- Maximizing business knowledge by integrating wide-scale insights and drill-down to granular details
- Accelerating decision-making with immediate fact-based solutions to intricate business questions by avoiding list tables and fixed format reports. Interaction is key.
- Increasing self-service data usage without increasing the workload of the IT department
- Visualizing any amount of data in real time using SAP HANA and simple deployment to mobile devices.
The Different Versions and Capabilities
Currently there are two versions of SAP Lumira that are available; SAP Lumira Standard Edition which must be purchased and SAP Lumira Personal Edition which is free to download and explore:
|
Feature Comparison |
SAP Lumira Standard Edition |
SAP Lumira Personal Edition |
|
Connect to database servers |
X |
X |
|
Manipulate and transform data |
X |
X |
|
Use Excel and CSV data sources |
X |
X |
|
Share data sets using BO Explorer* |
X |
|
|
Use SAP HANA to analyze live data |
X |
|
|
Visually navigate data using interactive charts and maps |
X |
|
*Included in SAP Crystal Server named user license
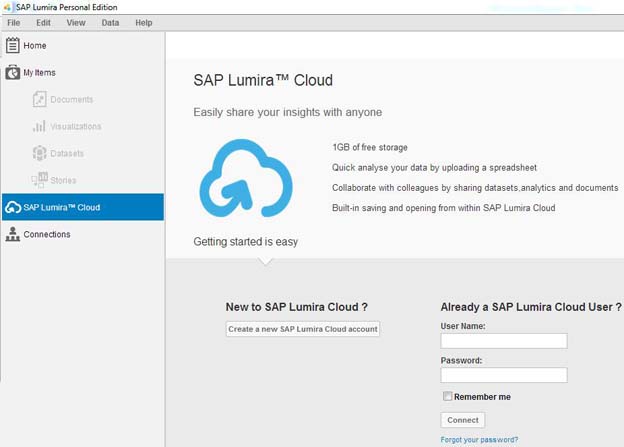
SAP Lumira Cloud
SAP Lumira Cloud enables the use of self-service BI in a secure cloud environment, including the capability to access, visualize, and share data without IT assistance. This solution empowers users to explore information and expose insights with the ease of drag-and-drop. Flexible and ‘budget-conscious’ licensing options are available toward rapid cloud deployment.
The benefits of the cloud environment include reducing the amount of time that it takes to access and upload data from numerous resources, and the ability to expand self-service BI consumption with flexible accessibility at any time and on any device. Furthermore, no software or hardware is necessary to get up and running quickly.
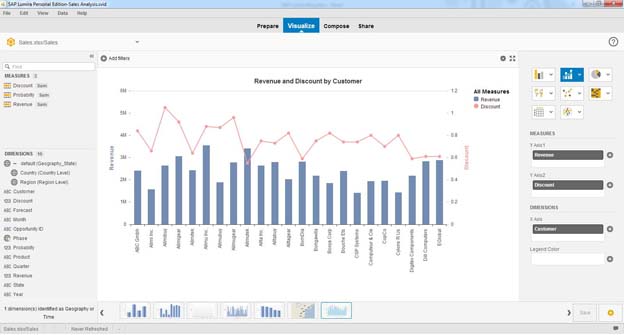
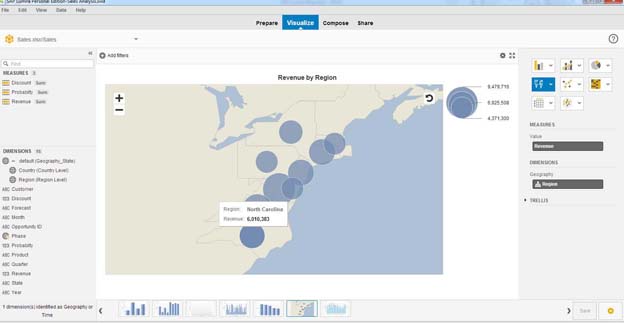
 Data Visualization
Naturally the visual options are the real reason why you might want to start using Lumira. This is where the tool excels. It has much more graphical features than most of its industry competitors, and complex graphing with 3-dimensions, heat, and bubble charts are standard. Also included is the capability to easily create map-based charts using geolocational data to view your information by country, state, county, city, etc. with the ability to drill down by merely clicking within the map.
Lumira also provides the ability to add text, images, shapes, pictograms, and input controls via simple drag-and-drop functionality. The extremely clean and highly intuitive interface makes creating visually pleasing and informative charts easy for end-users, no matter their experience level.
A powerful element within Lumira is the Infographic. This can be utilized to create highly visual, non-interactive narratives, such as newsletters, which can be effortlessly absorbed by the viewer at a glance.
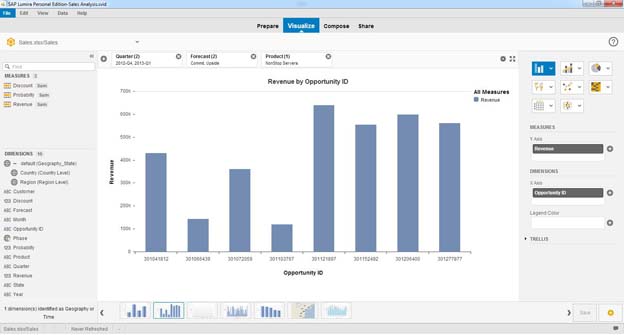
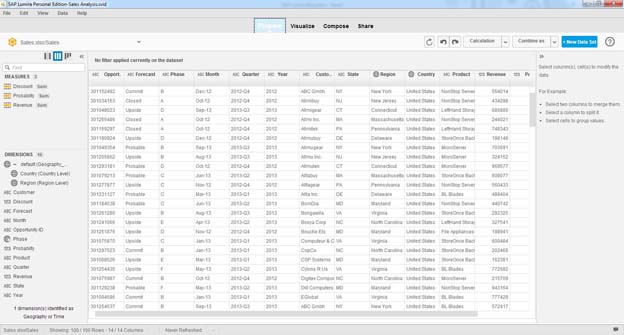
Data Preparation
The basic idea of the tool is that Lumira will lower IT time and costs by allowing end-users the ability to easily prepare data themselves. For example, users can add formulas, create time and geographical hierarchies, merge data sets, create measures, clean and format data, and more – all in simple steps, without the use of code or scripts.
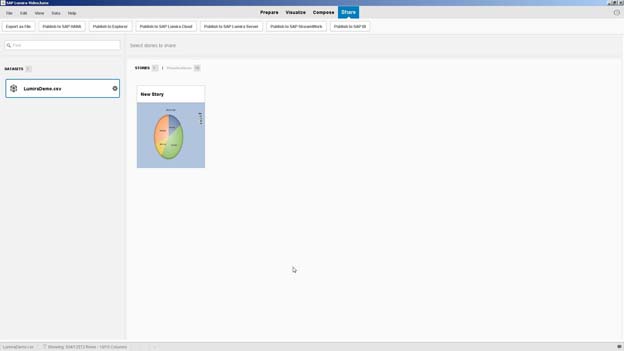
Sharing Capabilities
To support BI self-service, accessibility, and collaboration, Lumira offers multiple, simple to use options for sharing documents and datasets. Currently, both Lumira files and datasets can be published to Lumira Cloud, Lumira Server, or the SAP BI server. In addition, you can also export datasets as a local file or publish them to SAP HANA, Explorer, or StreamWork. The following screen shots capture the options:
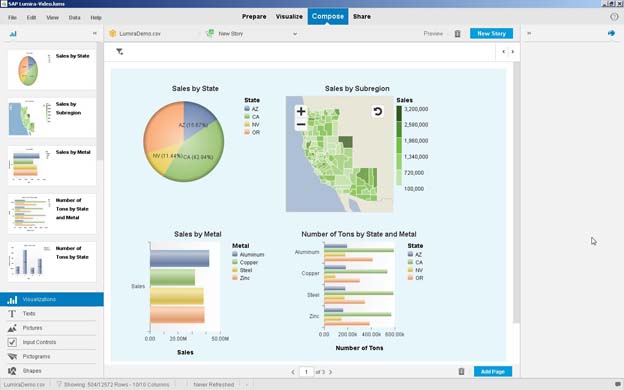
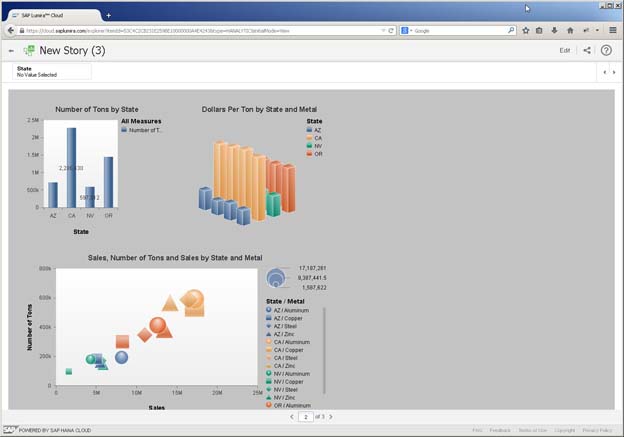
Example of a completed Lumira file, viewed within the Compose screen and on Lumira Cloud:
Summary
While the tool was initially based on ‘Visual Intelligence’, and is in its first release, it is really a solid tool that SAP has brought to market here. Best of all, it is truly a low-cost, yet powerful tool for end-users and it brings user-friendliness, a short learning curve, and highly flexible sharing capabilities, while decreasing dependency upon and freeing up resources within the IT organization.
So, go-ahead and unlock the power of your data by creating beautiful J visualizations. If you want to learn more take a look at a couple of more in-depth demo of the tool that we created:
- A step-by-step guide to creating a Lumira file: https://youtu.be/B5wFLvBYB4k
- A short overview of the toolset within Lumira: https://youtu.be/o4dihLmtg-M
More Resources
See All Related Content


Thales Bets Its Own SAP Landscape on Sovereign Cloud. Every Regulated SAP Shop Should WatchIt is one thing to sell a sovereign cloud, another to run your own ERP on it. Thales just became the first strategic customer to adopt SAP RISE private cloud on S3NS, refounding its landscape on clean core.
3 minute read