Learn about the latest updates to SAP BusinessObjects Design Studio 1.6 that are included in Support Package 02. Although this is not a new product version, there are many interesting and useful new updates, and detailed instructions for how to use these new components.
Key Concept
SAP BusinessObjects Design Studio is SAP’s flagship product when it comes to professionally authored dashboards. After SAP’s announcement of the new roadmap for SAP Lumira and SAP BusinessObjects Design Studio, it is clear that SAP BusinessObjects Design Studio is a very strategic part of SAP’s overall product strategy.
Although SAP BusinessObjects Design Studio 1.6 Support Package 02 (SP 02) does not provide you with a full release and the scope of new capabilities that you normally would expect from a new release—it is more of a service package delivering a set of new capabilities—there are still some very interesting new features. These include:
- New dialog containers
- Enhancements to information charts
- Ad-hoc currency conversion
- The ability to add filter bars
- New additional components for the dashboard consumer
- The ability to add calculations
In the following sections, I provide details about each of these new features, as well as a brief overview of some other new components, followed by step-by-step instructions about how to use them.
Dialog Containers
With the update, SAP delivers a new dialog container that enables you to create a dialog as part of your overall dashboard design. For example, it offers the option to configure settings before exporting your dashboard and to use this dialog component as part of your user interaction. The new dialog component is only one part of the SAPUI5 library (also referred to as the SAP Fiori library).
As shown in
Figure 1, the dialog component allows you to create an actual dialog window. The dialog component also provides you with the option to define the buttons and the script for those buttons as part of the definition for the dialog.
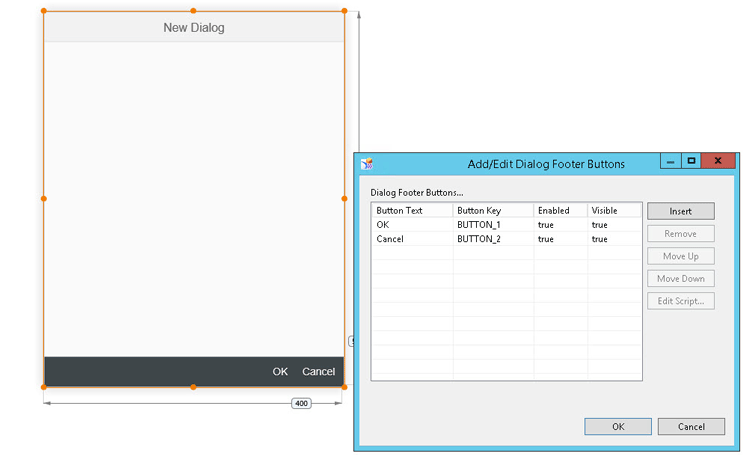
Figure 1
The dialog container component
Enhancements to Information Charts
For the information chart component of SAP BusinessObjects Design Studio, there are two important enhancements. The Info Charts component now enables you to display the configured scaling factor for the used measures (
Figure 2). It also offers you the option to set up a waterfall chart when using the Info Chart component.

Figure 2
A waterfall chart with scaling factors
Ad-Hoc Currency Conversion
In this release of SAP BusinessObjects Design Studio, the dashboard designer now can integrate an ad-hoc currency conversion functionality into the dashboard design (
Figure 3). As a result, the consumer of the dashboard can quickly and easily convert the measure values between different currency and different currency conversion rates.

Figure 3
Integrated currency conversion
Compact Display
One feature that has been missing from SAP BusinessObjects Design Studio is the ability to stack up several dimensions and create a hierarchical navigation without actually having to use a hierarchy—in SAP BW this feature is called Display as Hierarchy. With SP02 this capability is finally being offered. This feature provides you with the option to activate the hierarchical display in the crosstab, and the stacked dimensions enable you to open and close each individual member (
Figure 4).
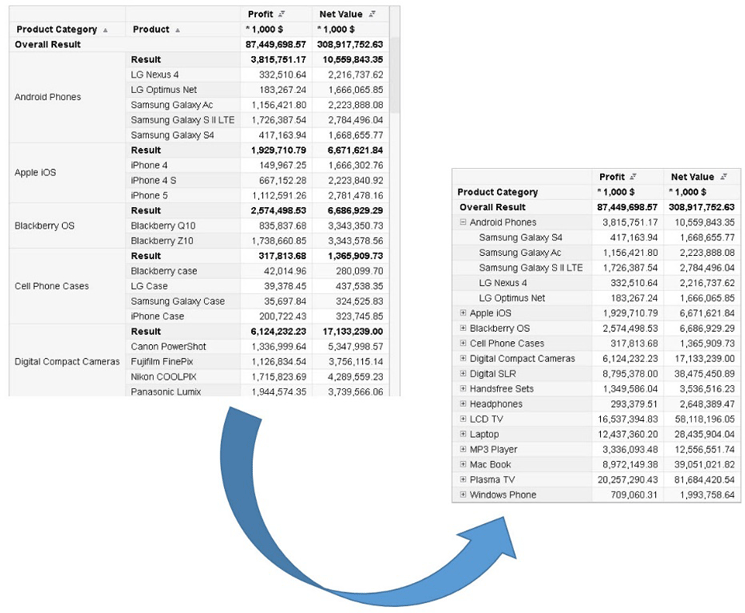
Figure 4
Compact display
Filter Bar
Another important addition to the list of features that you can leverage is the New Filter Bar component. Previously, the dashboard designer had to complete the time-consuming process of creating a filtering dialog. With SP02, however, SAP provides an out-of-the box filter bar. This filter bar provides the dashboard user with the ability to decide in each dashboard which of the available filters are visible and which are hidden. As shown by the circled numbers in
Figure 5, you can open the list of filters (1) and can then decide (2) which of the available filters to hide or be visible in the filter bar (3).
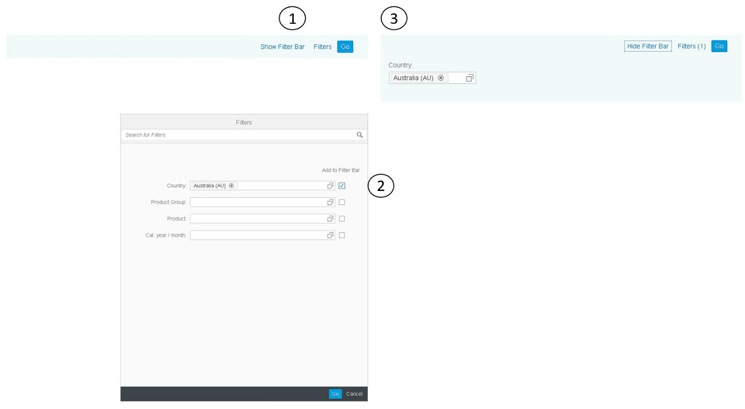
Figure 5
Filter bar options
Additional Components for the Dashboard Consumer
In addition to the previously mentioned items, there are five more new SAP BusinessObjects Design Studio components that are relevant for the consumer of the dashboard: links, text area, segmented buttons, switches, and the ability to add calculations.
Figure 6 shows the first four new components.

Figure 6
Additional items
Links: The dashboard designer can now integrate hyperlinks into the dashboard. This capability enables you to navigate to additional information via websites or to navigate to an additional dashboard using a hyperlink.
Text area: This new component can be configured to be input ready. Enabling this capability provides consumers of the dashboard with the option to enter text into the text area when viewing the dashboard. For example, they can now add a quick comment before printing or exporting the dashboard.
Segmented button: The new segmented button component enables you to create a single component with several buttons, instead of having to create several individual button components. In that way, the process of styling and aligning multiple buttons is much easier for the dashboard developer.
Switch: A new switch component has been added to SAP BusinessObjects Design Studio, providing the same kind of navigation to switch options on or off that users have with a mobile device.
Adding Calculations
Another great enhancement for the dashboard designer is the ability to add calculations as part of the data source. Until now, the dashboard designer could not create calculations (for example, actual versus budget) as part of the data source view in SAP BusinessObjects Design Studio. Instead, any calculation had to be incorporated into the actual data source itself. With SP02 you can now add calculations between two measures (
Figure 7). SP02 also provides you with the option to add dynamic calculations to a single measure (
Figure 8).
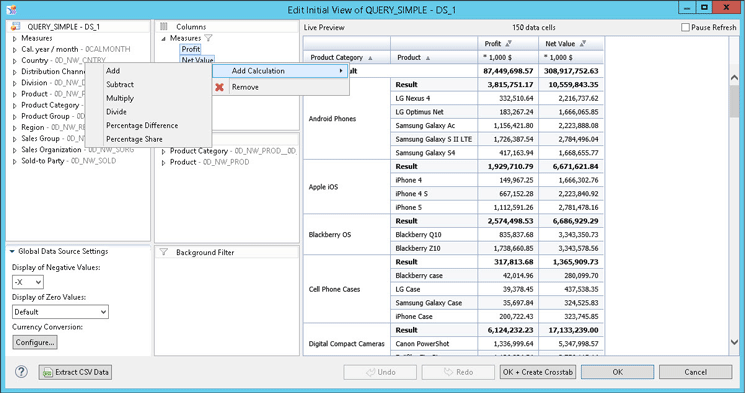
Figure 7
Add calculations between two measures

Figure 8
Add dynamic calculations to a single measure
In the following section, let’s take a look at some of these new components in action.
Using SAP BusinessObjects Design Studio 1.6 SP 02
In this section, I show you how to use some of the new SAP BusinessObjects Design Studio components to create a simple dashboard.
Figure 9 shows a mock-up of the example dashboard that I show you how to set up in the following steps. In this example, I assume that you have access to an SAP BW query displaying the Product Categories and Products in rows and the Profit and Net Value measures in columns (
Figure 10).
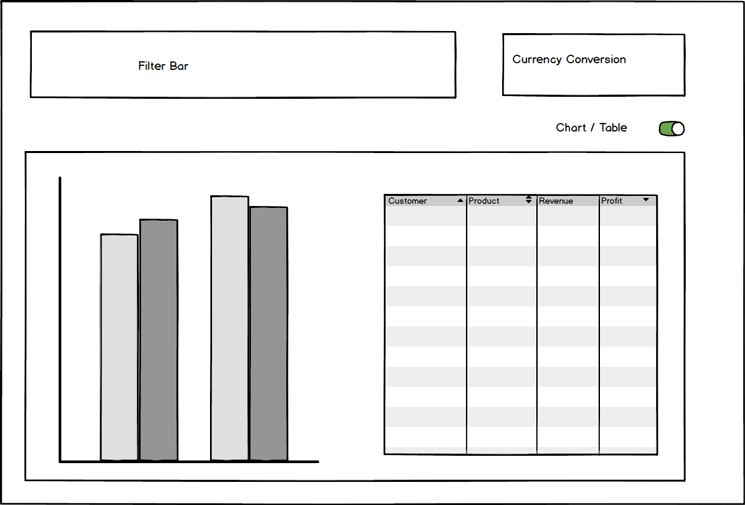
Figure 9
A simple dashboard result

Figure 10
The data source
I first show how to configure a New Filter Bar (in detail), followed by brief instructions for setting up a currency-conversion component, the option to switch between a chart and a table display, and, finally, how to use the new dialog component to display the details for the currency-conversion dialog.
To create the new dashboard, follow these steps.
1. Start SAP BusinessObjects Design Studio and select Application > New.
2. In the screen that opens (not shown), enter a name for the new application, select SAPUI5 m as the value for the Template option, and select a blank template from the Standard area. Click the Create button.
3. In the screen that opens (
Figure 11), navigate to the Outline area of your new application and select the Data Sources folder. Right-click and select Add Data Source… from the context-menu options.
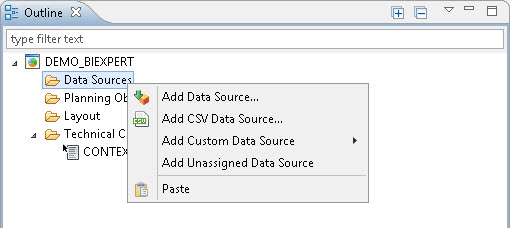
Figure 11
Add a data source
5. In the screen that opens (not shown) click Browse for the Connection and select the connection entry for your data source. Click the OK button.
6. In the screen that opens (not shown), click the Browse for the Data Source field and select your data source for this exercise. Click the OK button.
7. In the screen that opens (not shown), enter DATA_SOURCE_01 as the alias name in the Data Source Alias field and click the OK button.
8. Add a Filter Bar component from the Analytic Components folder to your new dashboard. Select the Filter Bar in the Outline area (on the left) and navigate to the Properties section on the right (
Figure 12).

Figure 12
The Design Studio environment
In the Properties section, configure the following values:
- Top Margin: 20
- Left Margin: 20
- Bottom Margin: Auto
- Right Margin: 500
- Width: Auto
- Height: 50
- Data Source: DATA_SOURCE_01
9. Add an Info Chart component from the Analytic Components to your new dashboard. Follow the same steps you took previously for the New Filter Bar component, except select Info Chart and navigate to its Properties (
Figure 12).
10. In the Properties section, configure the following values:
- Top Margin: 200
- Left Margin: 20
- Bottom Margin: Auto
- Right Margin: Auto
- Width: 1200
- Height: 600
- Data Source: DATA_SOURCE_01
11. Add a crosstab component. Following the same steps as before, select Crosstab in the Outline folder and navigate to its properties (
Figure 12).
12. In the Properties section, configure the following values:
- Top Margin: 200
- Left Margin: 20
- Bottom Margin: Auto
- Right Margin: Auto
- Width: 1200
- Height: 600
- Data Source: DATA_SOURCE_01
- Visible: False
13. Add a switch component. This time, go to the Basic Components folder (
Figure 12) and select the Switch option from the Outline folder.
14. Navigate to the switch’s properties and make the following entries to configure it:
- Top Margin: 100
- Left Margin: 750
- Bottom Margin: Auto
- Right Margin: Auto
- Width: Auto
- Height: Auto
- On: True
15. Add a text component from the Basic Components. Select the Text option in the Outline folder and navigate to its properties (
Figure 12).
16. In the text’s Properties, configure the following values:
- Top Margin: 100
- Left Margin: 650
- Bottom Margin: Auto
- Right Margin: Auto
- Width: 100
- Height: 30
- Text: Display Chart
17. Select the Switch component in the Outline folder (
Figure 12) and navigate to its properties on the right.
18. Under Events, select the On Change option (
Figure 13).
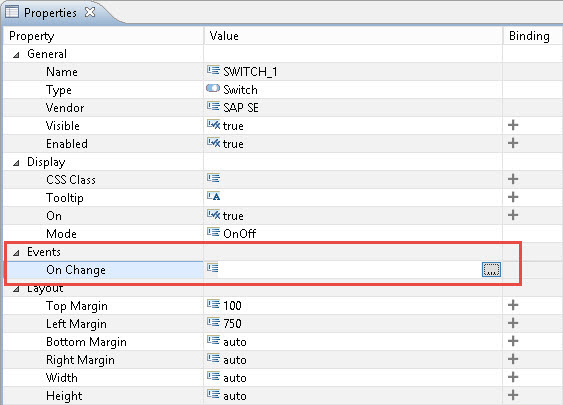
Figure 13
Set the On Change property for the switch component
19. Click the ellipse icon on the right to open the script editor. In the screen that opens (not shown), enter the following script:
INFOCHART_1.setVisible(!INFOCHART_1.isVisible());
CROSSTAB_1.setVisible(!CROSSTAB_1.isVisible());
Now, each time you click the switch button, this script reverses the visibility of the crosstab and the chart.
20. Click the OK button, and your dashboard should now display the new components you added in the preceding steps (
Figure 14).
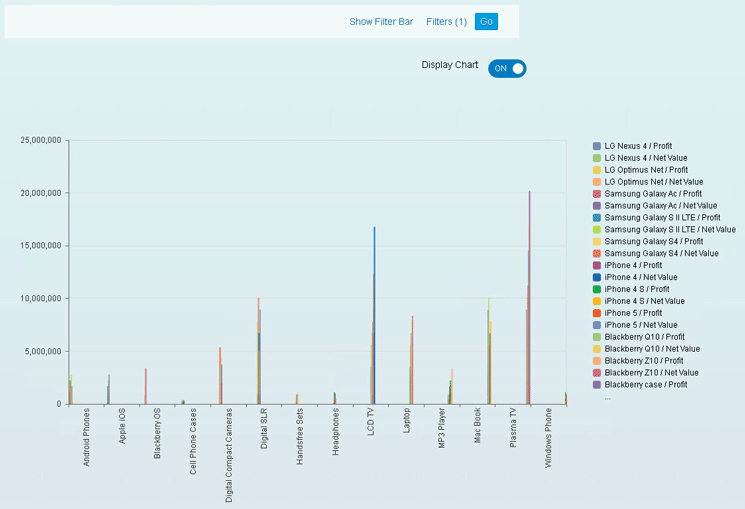
Figure 14
The dashboard with the new components
21. Add a button component from the Basic Components to your new dashboard. Select the Button option in the Basic Components folder and navigate to its properties (
Figure 12).
22. In Properties, configure the following values:
- Top Margin: 20
- Left Margin: 900
- Bottom Margin: Auto
- Right Margin: Auto
- Width: 200
- Height: 30
- Text: Currency Conversion
23. Set the properties for this button component so that it can be switched on or off. As you did previously for the visibility of the charts, navigate to Properties.
24. Under the Events section (
Figure 13), this time choose the On Click option. Click the ellipse icon on the right to open the script editor. In the screen that opens (not shown), enter the following script:
DATA_SOURCE_01.openCurrencyConversionDialog();
This script calls the new currency-conversion functionality and give users the option to choose the settings on the fly.
25. Click the OK button to save your changes.
26. In the screen that results, follow menu path Application > Execute Locally. Your dashboard should now look like the one in
Figure 15.

Figure 15
The dashboard with the new switch and currency-conversion options
By taking these steps, the following changes are made to your dashboard:
- Each time the switch component (Display Chart with the ON/OFF button) is clicked (Figure 15), either the chart or the crosstab is displayed. ON, in this case, means that the chart is displayed and OFF means that the crosstab is displayed.
- Clicking the Currency Conversion button brings up the Currency Conversion dialog (see Figure 16). Here you can choose the target currency and the conversion type, and the measure values in the crosstab and chart are changed accordingly.
- Each time the word Filter is clicked in the Show Filter Bar, a list of dimensions is opened (see Figure 17). This list can be used for filtering (depending on your data source) and you have the option to choose which dimensions are visible as part of the Filter Bar (see Figure 18).
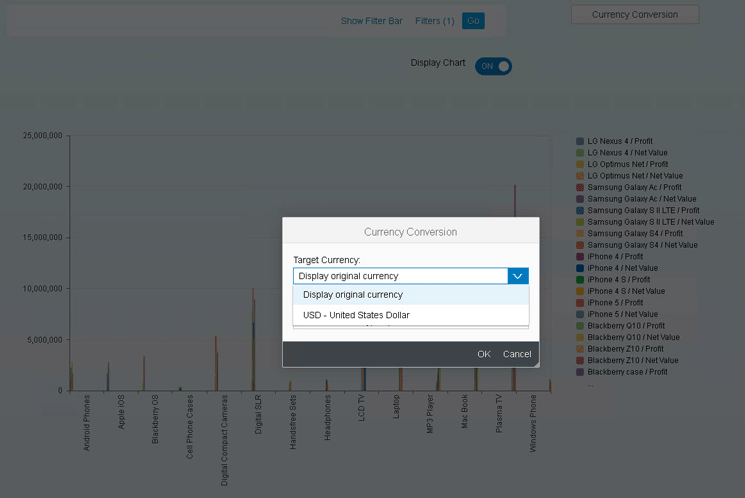
Figure 16
The new currency-conversion option
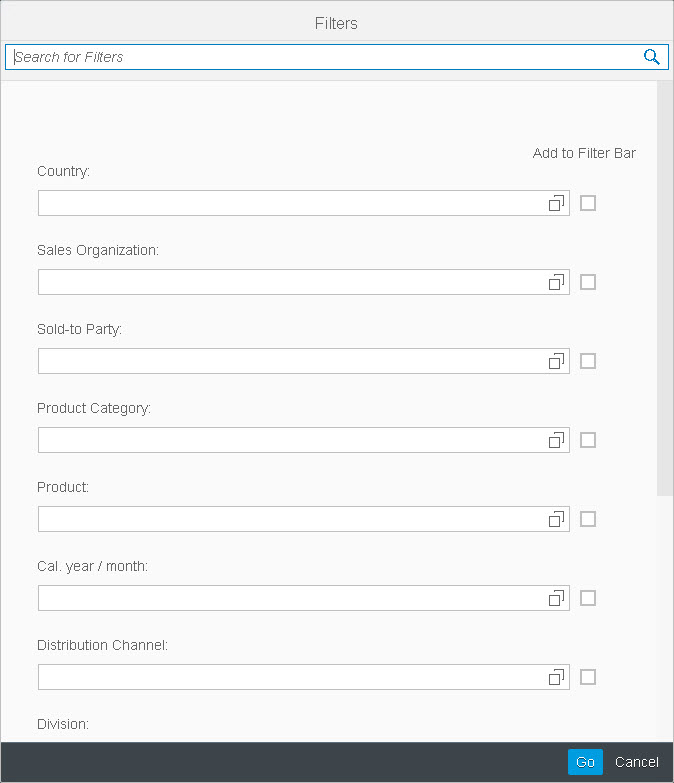
Figure 17
Choose dimensions for the filter bar
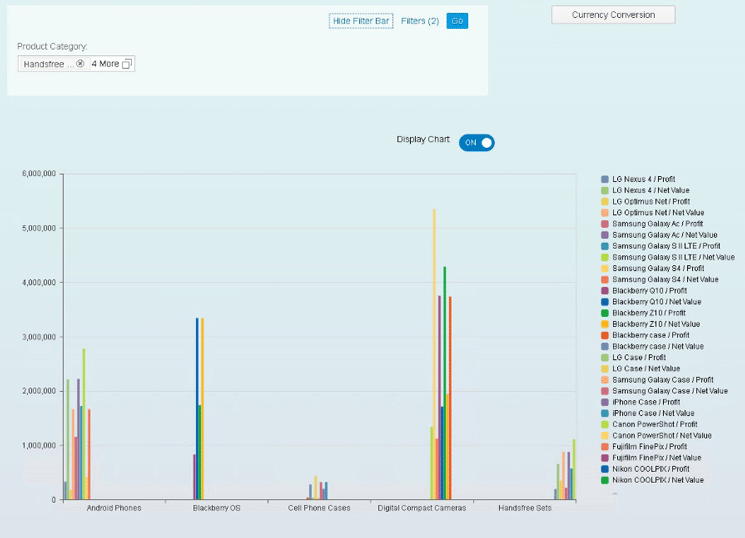
Figure 18
The New Filter Bar with the new dimensions
In just a few steps, you can use some of the new components from SAP BusinessObjects Design Studio 1.6 SP02, such as the switch, the ad-hoc currency conversion, and the Filter Bar options, to create a simple dashboard that allows you to interact with the data.
In the next section, I look at the updated roadmap for SAP BusinessObjects Design Studio and discuss the impact of combining SAP Lumira and SAP BusinessObjects Design Studio into one product family.
SAP BusinessObjects Design Studio – Roadmap Update
One major announcement from the SAPPHIRE NOW and ASUG Annual Conference (May 2016), is about the changes to the roadmap around SAP Lumira and SAP BusinessObjects Design Studio.
As shown in
Figure 19, SAP announced the merger of SAP Lumira and SAP BusinessObjects Design Studio into one product with two clients. It is very important to understand the terminology in this situation. SAP Lumira and SAP BusinessObjects Design Studio are being merged into one product from a branding, technology, and release-cycle point of view, but it remains as two separate clients, re-branded as SAP Lumira Studio and SAP Lumira Desktop.

Figure 19
The new roadmaps for SAP Lumira Studio and SAP Lumira desktop
Figure 20 provides further details on the timeline and the reasons behind these changes, as well as some of the planned scenarios.
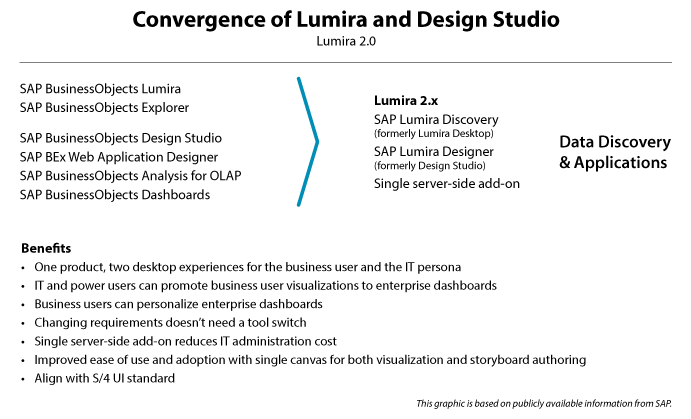
Figure 20
The roadmap details for the merger of SAP Lumira Studio and SAP Lumira desktop
SAP plans on combining SAP Lumira Desktop and Design Studio into a single solution with a single-server add-on for the SAP BusinessObjects BI platform, but it still remains as two separate client products (SAP Lumira Desktop and SAP Lumira Studio) that focus on different users.
SAP Lumira Desktop’s focus is on the self-service aspect, and SAP Lumira Studio becomes the solution for a more professionally authored dashboarding scenario. Some of the key benefits of this convergence of technology is that SAP Lumira Desktop gains strong integration with SAP BW and SAP HANA from SAP Lumira Studio, and SAP Lumira Studio gains the offline connectivity capabilities from SAP Lumira Studio. If you are responsible for the deployment and administration part of these products, note that the add-ons for the SAP BusinessObjects BI platform merge into a single add-on deployment.
Figure 21 shows the updated SAP BusinessObjects BI portfolio roadmap with the strategy moving forward. This shows which of the existing products are moving forward, and which BI clients are migrating into which of the future BI clients. As you can see in
Figure 21, SAP Lumira Studio (formerly SAP BusinessObjects Design Studio) and SAP Lumira Desktop are planned to cover the workflows of SAP Lumira; BusinessObjects Explorer; SAP BusinessObjects, Analysis for OLAP; Dashboards; and BEx Web Analyzer.
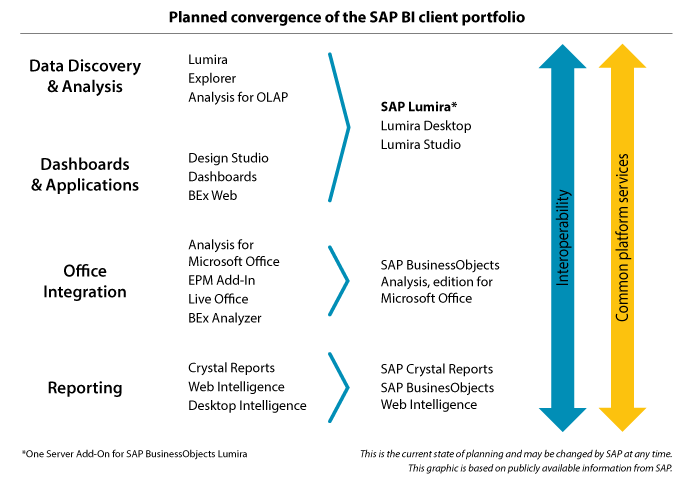
Figure 21
Simplification roadmap details
Figure 22 shows the current detailed roadmap for the planned beta release in Q4 2016, and a general availability in Q1 2017.

Figure 22
The details for new simplified roadmap
Some of the key topics for the upcoming release include:
- A single-file format for SAP Lumira Desktop and SAP Lumira Studio
- A single-server add-on for SAP Lumira Desktop and SAP Lumira Studio
- Stronger integration with SAP BW and SAP HANA in SAP Lumira Desktop
- Access to SAP Lumira Desktop data sources in SAP Lumira Studio
- A Fiori-style look and feel in SAP Lumira Desktop
- The ability to schedule SAP Lumira Studio applications
- Lifecycle management support for SAP Lumira Studio bookmarks
- Componentization and reusability of custom components in SAP Lumira Studio
As you can see, SAP is focusing on re-using the best of both worlds and creating a strong integration between SAP Lumira Desktop and SAP Lumira Studio to provide a complete solution to cover self-service scenarios as well as offering professionally authoring of the dashboard experience with the minimum set of products. Looking at this roadmap and the future plans, I can see that SAP Lumira Desktop and SAP Lumira Studio are going to be key elements in SAP’s BI client portfolio in the future.
Product Roadmap Disclaimer
The descriptions in this article of future functionality are the author’s interpretation of the publicly available product integration roadmap. These items are subject to change at any time without any notice, and the author is not providing any warranty on these statements.

Ingo Hilgefort
Ingo Hilgefort started his career in 1999 with Seagate Software/Crystal Decisions as a trainer and consultant. He moved to Walldorf for Crystal Decisions at the end of 2000, and worked with the SAP NetWeaver BW development team integrating Crystal Reports with SAP NetWeaver BW. He then relocated to Vancouver in 2004, and worked as a product manager/program manager (in engineering) on the integration of BusinessObjects products with SAP products. Ingo's focus is now on the integration of the SAP BusinessObjects BI suite with SAP landscapes, such as SAP BW and SAP BW on SAP HANA, focusing on end-to-end integration scenarios. In addition to his experience as a product manager and in his engineering roles, Ingo has been involved in architecting and delivering deployments of SAP BusinessObjects software in combination with SAP software for a number of global customers, and has been recognized by the SAP Community as an SAP Mentor for SAP BusinessObjects- and SAP integration-related topics. Currently, Ingo is the Vice President of Product Management and Product Strategy at Visual BI Solutions, working on extensions to SAP’s product offering such as SAP BusinessObjects Design Studio and SAP Lumira. You may follow him on Twitter at
@ihilgefort.
You may contact the author at
Ingo@visualbi.com.
If you have comments about this article or publication, or would like to submit an article idea, please contact the
editor.