4 minute read

Data has been universally recognized as one of the most important pillars of the modern knowledge world. Big data technologies have changed the way data is stored and processed. Modern data visualization tools enable businesses to derive better insights from this data. Big data technologies and appliance-based database systems ensure optimized data storage and retrieval. New-age database systems enable the combination of multiple technologies or novel concepts to enable data storage and retrieval at fast speeds. However, the fact remains that the better the data, the better the insights.
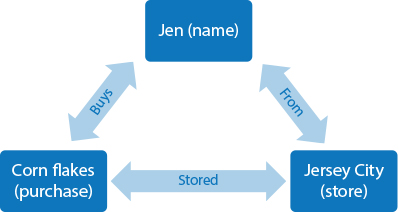
The modern world is all about connectivity. Relationships add contextual meaning to data. How a particular shopper is connected to the things he or she buys is an example of connected data. Further information can be added to the subject to derive more insights into shopping behavior. Graph data models are best suited to analyze this kind of highly connected data. Graph databases are best suited for storage and processing of data that is connected by multiple relationships.
Though graph databases have been in existence since the 1960s, they have found mainstream popularity only recently. The modern connectivity-based data world has revived interest in graph databases. SAP HANA incorporates a graph engine from SAP HANA 2.0.
Explore related questions
Ask SAPi
What Is a Graph Database?
Traditional relational databases store data in structured formats across well-defined columns and tables. Relationships are created across these tables by joining columns across primary and foreign keys. For a query to generate insights, it has to pass through a search operation for data matching across the keys. Primary entities for a relational database are tables and columns. However, consider a situation in which numerous entities are connected creating multiple joins across entities and resulting in complex queries. As data increases, there is a drastic slowdown in queries, similar to what occurs when inserting, updating, or deleting entities. When you receive data from numerous connected sources, the process of searching and updating is time-consuming and tedious.
The solution to this complexity is a graph database.
A graph database engine models data as entities and relationships (https://en.wikipedia.org/wiki/Graph_database). These data entities are called nodes, and the relationships between them are called edges. Entities hold data, while the edges define how these data points are related. Properties add information that is more relevant to the entities.
Figure 1 is an example of graph storage.
The resulting data model is simpler, and query searches are faster. Since each node holds data with relationships to other nodes, completing updates is also faster than using relational databases for the same process.
SAP HANA Graph Capabilities
SAP HANA 2.0 uses a novel approach to enable processing of graph data (https://blogs.saphana.com/2015/06/16/new-sap-hana-sps10/). This enables relational data to be stored as tables, but to be processed as a graph on the basis of relationships (https://www.researchgate.net/publication/236178288). Since SAP HANA supports both row- and column-based storage, building relationships across tables is more convenient than typical relational databases. SAP HANA also supports multiple processing engines in addition to graph, such as text, search, and spatial engines, which enables a combination of data processing capabilities across engines (https://help.sap.com/hana/SAP_HANA_Graph_Reference_en.pdf).
Figure 2 shows the general architecture.

Some of the benefits of SAP HANA graph processing capabilities are:
- Performance: Since graphs inherently store information as entities and relationships, searching between tables and joins is reduced considerably. For highly connected data, relational databases falter for a large number of joins. This also causes the Structured Query Language (SQL) to be complicated. When data has to be accessed across multiple tables, the SQL formed in a relational database would be joined to that many tables. For example, if information is stored across 10 different tables, the SQL scans across these tables to join the right values and then present the solution. This hampers the performance of the query both in terms of time consumed and resources used. However, since the graph database stores data as relationships, having a large number of joins does not pose a problem.
- Flexibility: Since data is stored as entities in nodes, it is much easier to find and manipulate data. This also allows for data searches to be contextual, not just value oriented. The graph engine works in parallel with other processing engines, such as engines used for spatial and text analysis. You can analyze graphs with a familiar relational structure.
- Better insights: Since data entities are connected to relative bits of data across the storage, queries are more contextual and bring up better insights into relationships between data nodes. The SAP HANA graph engine’s built-in algorithms, such as neighborhood search and pattern matching, can be used to build better insights into the data. The SAP HANA graph visualization toolkit provides additional capabilities for building deeper insights into the data.
Though graph processing can be used extensively for highly connected data, some additional typical use cases are:
- Fraud detection. Easy access to information over the internet has enabled fraudsters to be more creative with their methods. They rely on stolen identities, usernames, and passwords across continents to cheat individuals across the globe. Traditional fraud detection engines rely on individual data entities to trace fraudulent activities and predict future attacks. However, fraudsters seldom stick to single individuals. Rather they may take on the identities of multiple individuals across geographies. Graph data processing inherently creates relationships across entities and enables you to find hidden relationships across these data points. This enables far more effective fraud detection and prevention.
- Retail recommendation engine that makes recommendations of products for retail customers. With multiple channel sales and cashless payments, today’s retail world is in itself a mesh of individuals, accounts, and payment information. Based on preferences shown during shopping history, an SAP HANA graph can build relationships between an individual and shopping habits to predict shopping behavior.
- Logistics and distribution. Connected fleet data can be merged with route and warehouse data to come up with efficient relationships between deliveries and distributions. The SAP HANA graph engine can pick up this data from SAP ERP or the underlying data lake and come up with the best routes for efficient distribution.
More Resources
See All Related Content
UST’s Approach to SAP GROW: Accelerate Time-to-Value in Weeks, Not MonthsUST’s updated ERP Cloud (formerly SAP S/4HANA Cloud, Public Edition) combines SAP GROW with proprietary accelerators, automation, AI, analytics, and change-enablement to deliver a clean-core, future-ready implementation in as little as four weeks, sharply reducing time-to-value, upgrade effort, and business disruption.

What CCH Tagetik Can Do for Financial Planning in SAP EnvironmentsFinancial planning is becoming a system design issue in SAP environments. This article examines how CCH Tagetik shifts planning onto SAP data structures, connecting budgeting, operations, and financial outcomes within a unified architecture.
3 minute read