Improving FP&A Impact
Financial planning and analysis (FP&A) supports an organization's financial health by providing timely and accurate insights on
financial planning, budgeting, forecasting, performance reporting, and more. Today, progressive FP&A teams are increasingly looking to leverage data and analytics to in reports and dashboards derive insights and make decisions.
Fundamentally, companies that are data-driven demonstrate improved business performance.
A report from MIT says digitally mature firms are 26% more profitable than their peers.
McKinsey Global Institute indicates that data-driven organizations are 23 times more likely to acquire customers, six times as likely to retain customers, and 19 times more profitable.
Industry analyst firm Forrester found that organizations that use data to derive insights for decision-making are almost three times more likely to achieve double-digit growth.
12 Reports
In this backdrop, FP&A teams are increasingly using data and analytics and helping organizations to increase revenue, reduce costs, and mitigate business risks. Basically, the FP&A process is a continuous cycle of data collection, analysis, and decision making.
However, deriving business insights is highly contextual as the insights derived depend on time, location, user type, and other factors. In this regard, there are 12 standard or commonly used performance reports in the measurement continuum the FP&A team can leverage to measure and improve business performance. These 12 reports are:
- Exploratory Analysis (Centrality and Variation)
- Association Analysis
- Variance Analysis (Planned vs. Actual)
- Profitability Analysis (Customer Segmentation)
- Horizontal/Trend Analysis
- Vertical/Proportional Analysis
- Price-Volume Mix (PVM) Analysis
- Breakeven Analysis
- Predictive Analysis
- Prescriptive Analysis
- Sensitivity Analysis in Scenario Planning
- Risk Analysis
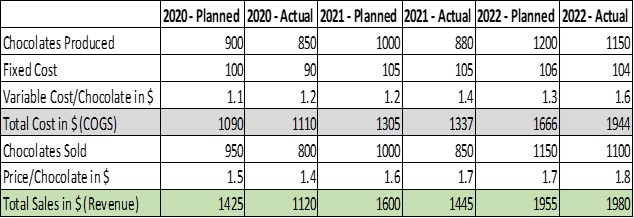
To explain these 12 FP&A standard performance reports, let us take a company that makes chocolates. The table below shows the financial details of the company for the last three financial years (2020-2022) where the 12 standard or commonly used FP&A reports will be derived or explained.
1. Exploratory Analysis
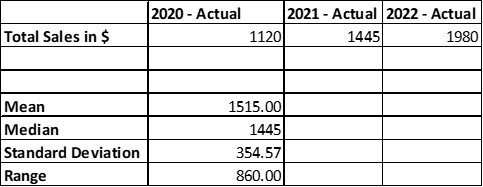
Exploratory Analytics reports are used to analyze the “3D” characteristic of the historical performance of the company - discover the important variables, determine the data distribution, and detect anomalies or outliers. Measures of centrality and variations are commonly used in Exploratory Analysis. Centrality measures include mean and median while variation measures are standard derivation and range.
2. Association Analysis
This type of FP&A analysis finds interesting relationships in the historical datasets using correlation techniques. The Pearson correlation is the most commonly used correlation technique. It measures the strength of the linear relationship between two numeric variables. It has a value between -1 to 1, with a value of -1 meaning a total negative linear correlation, 0 being no correlation, and + 1 meaning a total positive correlation. In the below example, the Pearson’s correlation between the planned sales and actual sales for the 3 financial periods is 0.99 as shown.

3. Variance Analysis
Variance Analysis is the difference between planned and actual values on various business entities or resources such as materials, labor, equipment utilization, energy consumption, overhead, and so on. It measures a product’s cost and profitability. Basically, variance shows how to move forward based on how your business has performed versus the expectations. In the above example, the variance analysis for the financial year 2022 is the difference between planned sales and actual sales, and this variance amount is $1,955 - $1,980 = $25.
4. Profitability Analysis
Profitability Analysis helps organizations understand how they generate revenue and make profits. Though there are many ways to assess the profitability of a company, the three most important profitability KPIs are gross profit, operating profit, and net profit. These three KPIs are derived from the income statement.
- Gross Profit or Gross Income = Net sales - Costs of Goods Sold (COGS).
- Operating Profit = Gross Profit - Operating Expenses (i.e., SG&A + Depreciation)
- Net Profit or Net Income = Operating Profit - Taxes.
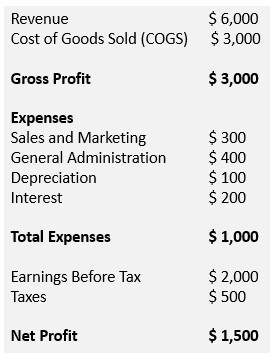
Below is a sample income statement to illustrate the three profitability KPIs.
- Gross Profit/Income was $3 million for the quarter (Revenue of $5 million minus $2 million in COGS).
- Operating profit was $2.2 million for the period, which is calculated by taking Gross Profit of $3 million minus Operating Expenses of $1 million (labeled total expenses). However, we must add back in the interest expense of $200,000 because Operating Profit doesn't include interest (or $3 million - $1 million + $200,000 = $2.2 million).
- Net Profit/Income was $1.5 million.
 NOTE
NOTE
EBITDA (Earnings Before Interest, Taxes, Depreciation, and Amortization) is a KPI used to evaluate a company’s operating performance. It can be seen as a loose proxy for
cash flow for the entire company’s operations.
The formula for EBITDA = Net Income + Tax Expense + Interest Expense + Depreciation.
EBITDA = $1,500 + $500 + $100 = $2,100.
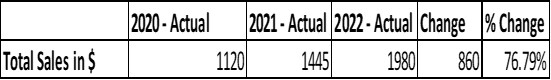
5. Horizontal Analysis
Horizontal Analysis or Trend Analysis compares one period with another period to spot the trend. Basically, it is a financial analysis technique to evaluate a company's performance over time. In the given example, in 2022 the revenue was $1,980 while in 2020 the company’s revenue was $1,120.
6. Vertical Analysis
In Vertical Analysis or Proportional analysis, you analyze a particular KPI or a related set of KPIs in one reporting period. This KPI could be COGS or EBITDA or revenue for a given period. For example, suppose a corporation has gross sales of $5,000, COGS of $2,000, SG&A expenses of $700 ($300 + $400) and a 25% tax rate, its income statement will look like this if vertical analysis is performed.
 NOTE:
NOTE:
The primary difference between vertical analysis and horizontal analysis is that vertical analysis is focused on a set of KPIs in one single reporting period. Horizontal analysis looks at certain KPIs over several reporting periods to determine the changes and trends.
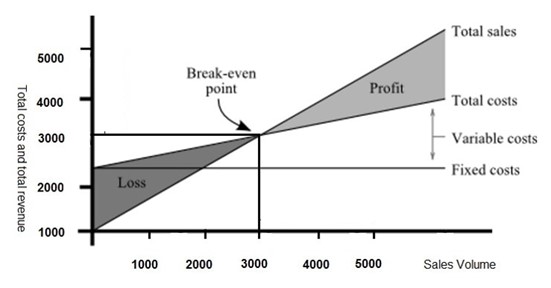
7. Break Even Analysis
Break Even Analysis weighs the costs of a new asset, service, or product against the unit selling price to determine the point at which you will break even. In other words, Break Even Analysis reveals the point at which you have sold enough units to cover all the costs. At the Beak Even point (BEP), you will have neither lost money nor made a profit. Basically, Break Even Analysis tells you how many units of a product must be sold to cover the total costs i.e., fixed and variable costs.
The formula to calculate the Break-Even Point is shown below.
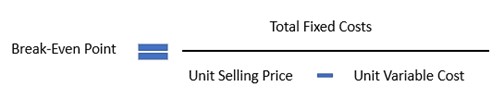
In the FY2022, the chocolate company spent $104 on fixed costs. Each chocolate has a variable cost of $1.60, and a selling price of $1.80. So, BEP is 104 / (1.8-1.6) = 520 Units. This means to break even; the company needs to sell 520 chocolates per year. You can also think of the break-even point in terms of dollars of sales. Selling $1.80 per chocolates, the break even will be $936 in annual sales.
NOTE:
The Contribution Margin (CM) is the difference between the product’s selling price and product’s total variable cost. For example, if a chocolate sells at $1.80 and its variable cost is $1.60, then the contribution margin is $0.20.
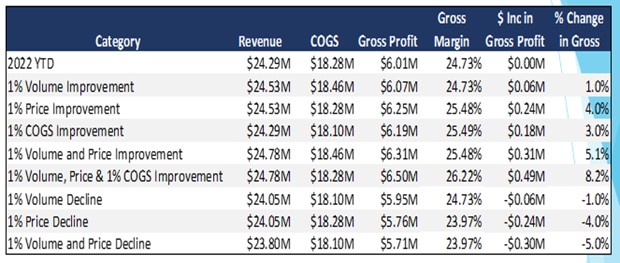
8. Price Volume Mix (PVM) Analysis
Sales or revenue is primarily dependent on two main variables: quantity and unit price. PVM (Price Volume Mix) Analysis helps to assess the impact of changes in prices, volume change, or a combination of both to the revenue. In the below example, a 1% increase in product price is four times more impactful than 1% increase in volume.
9. Predictive Analysis
Predictive analytics makes predictions about the future using historical or past data. Though there are many kinds of techniques such as trend analysis, decision trees, neural networks, and more to predict the future outcome, regression analysis is the most popular predictive analytics technique. Regression analysis determines the relationship between the independent variables and help predict the outcome should one variable change. In our example, the below data can be used to forecast the revenue.

The data says that there is a strong relationship between two variables - sales and quantity. R-squared (R2 or Coefficient of Determination) is a statistical measure that indicates the extent of variation in a dependent variable (sales) due to an independent variable (Quantity). Hence the mathematical equation of Y (= Revenue) = 2.222* X (= Quantity) + 558.95 can be used for future sales prediction.
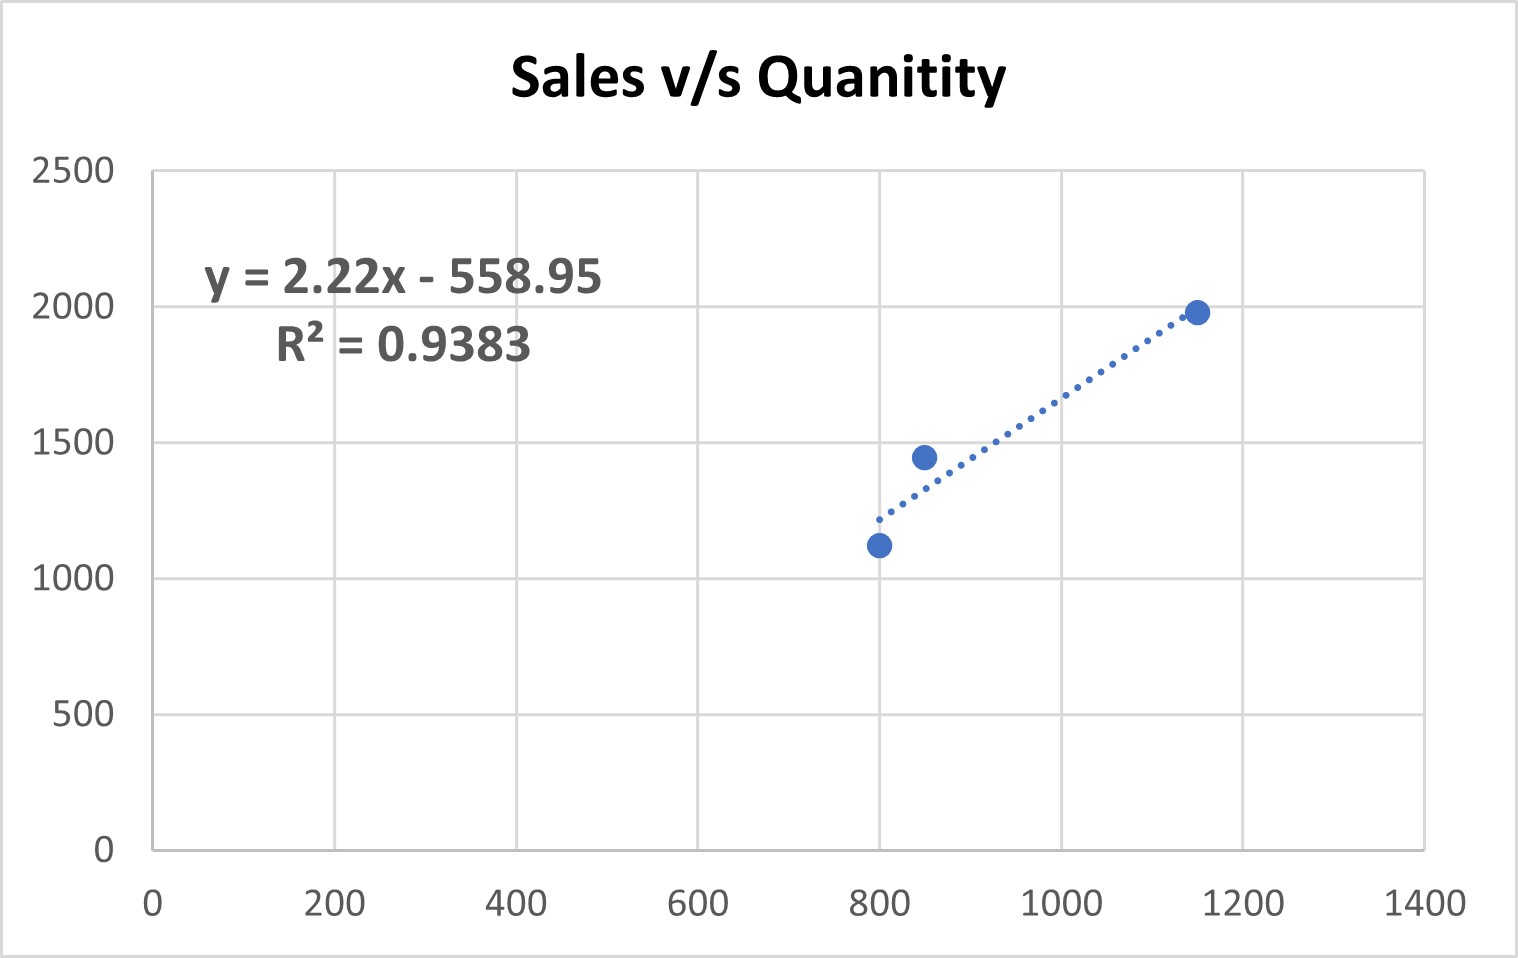
So, in 2023 (the future period), if the expected quantities of chocolates sold is 1,225, then the predicted sales or revenue will be: 2.222 * 1,225 - 558.95 = $2,163.
10. Prescriptive Analysis
A prescriptive analysis focuses on finding the ideal or the best way forward for a particular scenario, based on historical data. This answers the question, “What should we do next?” and is often used together with Predictive Analysis.
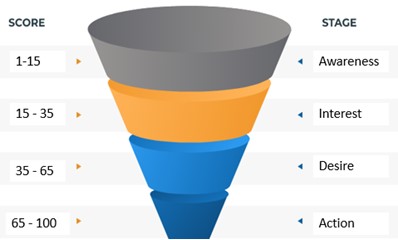
In FP&A, Prescriptive analytics plays a prominent role in revenue forecasting through lead scoring in the AIDA cycle. The AIDA cycle describes the four stages a customer goes through before making a purchasing decision. The stages are Attention, Interest, Desire, and Action. Lead scoring or prospect qualification is the process of assigning a point value to various actions along the sales funnel, enabling you to rank sales leads based on how likely they are to convert into customers. For example, if a prospect opens the marketing email a score of 2 points is awarded, if the prospect visits the website a score of 3 points is awarded, the prospect attends the demo presentation, a score of 7 points is awarded, and on. These scores ae then used to categorize the prospect accordingly in the sales funnel.
11. Sensitivity Analysis
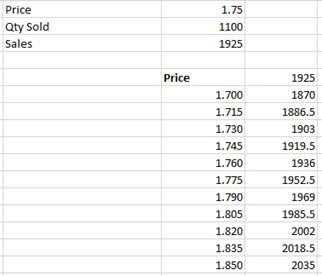
Sensitivity Analysis or What-if analysis is an excellent tool for Scenario Planning as it provides different outcomes in the scenario based on variation of one input. For example, say if the confidence interval at 95% confidence levels for the product’s selling price in 2022 is $17 to $18.50, what will be the sales or revenue when the price is increased every 15 cents. To derive this insight, a one variable data table (in Excel) can be used. The one variable data table in Excel is a Sensitivity Analysis technique used in situations when you want to see how the final result changes when you change one of the input variables. In the above example if the product’s unit selling prices changes from $1.715 to $1.730, then the revenue changes from $1,886.50 to $1,903.
Sensitivity Analysis is closely associated with interferential analysis especially when sample data is used in analysis. In this regard, the empirical rule also referred to as the “Three Sigma Rule” or the “68-95-99” rule says that, virtually every piece of data in a given population will fall within three standard deviations of the mean of the sample data.
For example, if the average or mean price of a product/SKU from 30 days of sample is $16.25 and the standard derivation is $0.85, the “68-95-99” rule which is based on the sample mean and sample standard deviation can be applied to infer the insights of the entire population. This “68-95-99” says for the entire 365 days or 1-year, the price of the SKU will be:
- 68% of the population is within 1 standard deviation of the mean. This means in 68% of the population of 365 days i.e., for 249 days, the SKU price is $16.25 +/- $0.85 i.e., $15.40 to $17.10.
- 95% of the population is within 2 standard deviations of the mean. This means in 95% of the population of 365 days i.e., for 347days, the SKU price is $16.25 +/- 2*$0.85 i.e., $14.55 to $17.95.
- 99% of the population is within 3 standard deviations of the mean. This means in 99% of the population of 365 days i.e., for 361 days, the SKU price is $16.25 +/- 3*$0.85 i.e., $13.7 to $18.8
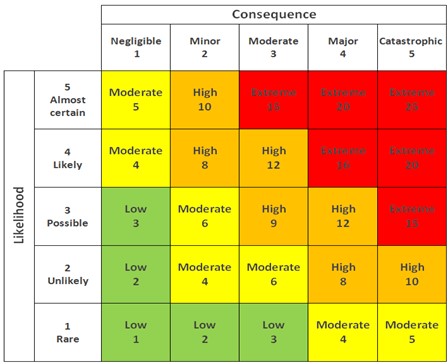
12. Risk Analysis
Risk analysis identifies the potential for any adverse events that may negatively affect the business. Once the risks are identified, they are analyzed to identify the impact of the risk on the situation so that appropriate steps can be taken to mitigate them. A qualitative risk analysis uses a rating scale to grade the risks in terms of two factors - likelihood and impact. It assigns numerical values to risks, based on quantifiable data, such as costs, logistics, time, resource availability, and so on.
The risk analysis matrix is as shown below. For example, if the likelihood of risk becoming an issue associated with an investment project is
likely and the impact of the consequences of the issue is
major, then we have a high-risk item (4X4) as per the chart.