Walk through a number of practical steps for setting up a simple analytical dashboard with SAP Lumira. Learn how to complete visualizations in SAP Lumira for a number of real Cross-Application Time Sheet (CATS) key performance indicators (KPIs). Analyzing proper business performance indicators on an analytical dashboard helps you make appropriate business decisions faster. The approach described for setting up a dashboard on CATS KPIs can be applied to any other business area with SAP or non-SAP data sources.
Key Concept
An analytical dashboard provides a view on the key performance indicators (KPIs) of a particular business area. It focuses on gaining insights from a volume of data collected over time to understand what happened, why, and what changes should be made in the future to optimize processes and improve performance.
The time-reporting process with SAP Cross-Application Time Sheet (CATS) is a relatively simple exercise if viewed from a technical perspective. However, that process is only a tip of the iceberg for an organization’s project management team when it embarks on a "simple" time-writing project journey. Any organization that operates with a critical mass of business users involved in the time-writing process soon realizes many more challenges, such as a constant need to maintain the data quality, the discipline of business users, availability of well-documented procedures, and change management.
Based on our experience, the critical number of CATS time reporters that can force the business organization to switch from manual controls to automated controls via a number of developed key performance indicators (KPIs) is around 1,000 business users. If the internal or external rotation in the organization is high, that only complicates the overall picture. By internal rotation, we mean people moving between departments in the same legal entity (or country), whereas external rotation in a global organization is about people moving between countries. In addition, you have general rotations such as hiring new employees and employees leaving companies. The number of new hires or terminated employees also affects the master data maintenance workload.
Such data monitoring and quality checks might become very time-consuming because every user, on average, can easily generate three to four line items per day. In other words, the average business user can be working on three to four projects or jobs on the same date, so that generates three to four line items daily per person. It is not relevant here when the data is actually entered, such as the same day or the end of the week. This is just to illustrate potential data volume: 1,000 users times 20 working days per month times 3 line items per day = 60,000 line items monthly. On the financial side, you also cannot underestimate the data quality; no matter if the data is used for customer projects (and therefore requires timely resource-related billing to ensure healthy cash flow) or investment projects (to ensure timely capitalizations and cash calls for joint venture partners within upstream oil businesses, for example).
There are three main groups of business users involved in the time-writing process. The first, and largest, group consists of time reporters. The second group consists of time approvers. Time approvers are usually project managers, but they can also be budget holders responsible for different projects. Therefore, time approvers need either to approve or reject the time reported by the first group of business users. Only approved time can be transferred into accounting. Therefore, fast action is expected from this second group.
Finally, the third group consists of time administrators. Time administrators take care of the master data used by the first two groups of business users and ensure timely hiring and leaving actions for HR master data related with the time writing process. Moreover, time administrators are responsible for changing the organizational assignment data for business users moved across the organization (that indeed can be also a part of HR functions).
The timely action by all three groups of business users is highly important to ensure the data quality and therefore the accuracy of financial data later on. All such actions must be supported by crystal-clear operational procedures that every newcomer can read and understand without any additional help. A lack of operational procedures can often be used as a valid excuse for not following them. Further, a few examples are intended to highlight the importance of timely actions dependent on the above groups of business users (Table 1).
| Who? |
What? |
Why it is important?
|
Time reporters
|
Time is not reported by operational deadline.
|
Time is not transferred into the accounting component in the same reporting period and creates a gap between the working period and the accounting period, complicating further reporting and reconciliation. In addition, it can negatively affect cash flow due to late cost recognition.
|
Time reporters
|
Rejected time is not corrected within operational deadline.
|
Time is not transferred into the accounting component in the same reporting period and creates a gap between the working period and the accounting period, complicating further reporting and reconciliation. In addition, it can negatively affect a cash flow due to late cost recognition.
|
Time approvers
|
Time is not approved by operational deadline.
|
Time is not transferred into the accounting component in the same reporting period and creates a gap between the working period and the accounting period, complicating further reporting and reconciliation. In addition, it can negatively affect a cash flow due to late cost recognition.
|
Time administrators
|
Newcomer master data is not set up for time writing.
|
Time writer cannot report time. No customer billing or capitalizations are possible.
|
Table 1
The process ownership matrix by involved user group, problem, and financial impact
To address these problems and efficiently track how the time-reporting processes are followed we suggest introducing a management dashboard with critical CATS KPIs updated on a regular basis. By looking at the dashboard, managers are able to track the workflow and see where there are bottlenecks or delays in the CATS process.
The SAP ERP Central Component (ECC) CATSDB table is a relatively easy target for any BI tool that enables you to build your own analytical dashboards because it contains several data fields (basically the most comprehensive data about the time-writing process available in a single table). In principle, this table can be used without linking of additional data tables. Some of the other data tables that can be used to make reporting more user-friendly are listed in Table 2.
| Table |
Why it can be used |
PA0105
|
System user name link
|
PA0001
|
HR record name
|
CSKS
|
Cost center description
|
CSLA
|
Activity type description
|
AUFNR
|
Work order description (if used as account assignment in CATS)
|
PRPS
|
Work breakdown structure (WBS)-element description (if used as account assignment in CATS)
|
| AFKO/AFVC |
Network activity description (if used as account assignment in CATS) |
Table 2
A list of SAP ECC tables that can be used together with the CATSDB table to link associated text descriptions
How to Implement KPIs in SAP Lumira Dashboards
Instead of going through multiple reports with overwhelming details you can use analytical dashboards to visualize KPIs critical for time reporting. This gives managers a capability to quickly review the status of CATS processes and identify which departments or users have issues with processes such as time reporting, approvals, or master data maintenance.
SAP Lumira is one of the latest dashboarding tools from SAP that helps you visualize your data with just a few clicks. However, before you start using Lumira, you need to implement KPI calculation rules that are not immediately available in the original datasets. We show you in a few easy steps how the SAP HANA platform can be used for data modeling, KPI calculations, and feeding SAP Lumira dashboards.
In this section, we show you how to implement some KPIs into an SAP Lumira dashboard. Table 3 includes a summary of the KPIs to be implemented in SAP Lumira.
| KPI ID |
KPI description |
KPI formula or criteria |
Target user group and purpose |
KPI dimension |
1.0
|
Average number of days passed between actual working date and the data entry date
|
The difference between CATSDB-WORKDATE and CATSDB-ERSDA (created on date)
|
Time writers and operational discipline |
By department (cost center) and by period |
1.1
|
Alternative to the average number can be the maximum number of days
|
The difference between CATSDB-WORKDATE and CATSDB-ERSDA (created on date)
|
Time writers and operational discipline |
By department (cost center) and by period |
2.0
|
Average number of days passed between data entry date and time approval or rejection date
|
The difference between CATSDB-ERSDA (created on date) and CATSDB-APDAT (approval date). If there is no time approval date yet, the current actual date is used.
|
Time approvers and operational discipline |
By department (cost center) and by period |
2.1
|
Alternative to the average number can be the maximum number of days
|
The difference between CATSDB-ERSDA (created on date) and CATSDB-APDAT (approval date). If there is no time approval date yet, the current actual date is used.
|
Time approvers and operational discipline |
By department (cost center) and by period |
3.0
|
Average number of daily hours reported within a department
|
Total number of reported hours divided by number of time reporters who reported time for department X in period X, and divided by number of working days in period X
|
N/A |
By department (cost center) and by period |
Table 3
A summary of sample KPIs
Prepare Source Data in SAP HANA One
We picked SAP HANA One as a database engine for Lumira dashboards in which the calculations, data aggregation, and processing for KPIs can be done. It could have been any other online analytical processing (OLAP) processor or a database engine, but SAP HANA performs well with large datasets and has direct connectivity to SAP Lumira. Therefore, we decided to use it in this exercise.
A set of database tables can be updated automatically from any source system (such as SAP ECC or Oracle) using tools such as BusinessObjects Data Services. For simplicity, we prepared a data model in SAP HANA One on Amazon Web Services (AWS). All CATS records are sitting in a table in HANA One with the raw data imported from a flat file. The flat file has been generated in ECC using a standard report.
Here is a link to the SAP HANA One AWS and step-by-step instructions for how to launch the instance: https://aws.amazon.com/marketplace/pp/B009KA3CRY/ref=mkt_ste_hp_car_ec_HANAOne
To import a table from a flat file to HANA One, go to SAP HANA Studio and follow menu path File > Import > SAP HANA Content > Data From Local File (Figure 1). Click the Next button. This action opens a screen (not shown) in which you choose a target system, schema, and source file. Follow the wizard steps. You have to specify a table name in which source data is stored. In this case, we have stored source data in table AA_CATSDB4.
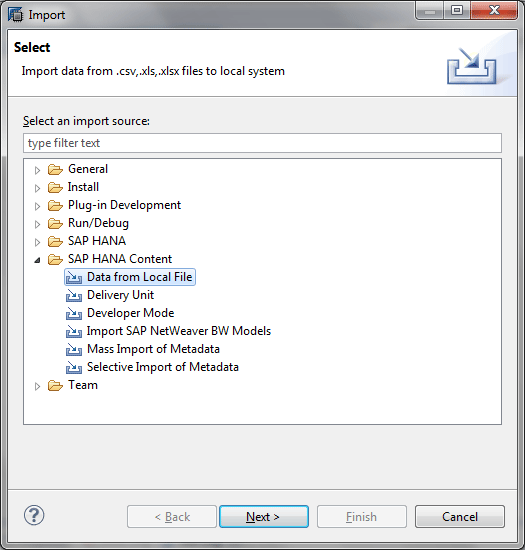
Figure 1
Import a table from a flat file
Design an Attribute View
Based on the source data in the table AA_CATSDB4, we designed an attribute view AT_CATS in the SAP HANA Studio to derive all needed attributes that we are missing for the CATS KPIs (Figure 2) – for example, number of entry days or number of approval days. To get to the screen shown in Figure 2, follow menu path Systems > HDB (SYSTEM) SAP HANA One > Content > demodata > Attribute Views > AT_CATS.

Figure 2
Create an attribute view AT_CATS
You have to convert all three data fields available in the source to the date format (work date, entry date, and approval date) on the right side of the screen shown in Figure 2. You may not see all the columns in one screen. During this conversion, you check for blank dates (for example, those entries for which there is no approval yet) and convert them to some fake dates that make sense for the KPIs you are building. In the case of a blank approval date, replace it with the current date, assuming the time sheet is approved today or later.
In addition, you have to group records by month, quarter, and year. Therefore, you need to introduce respective attributes based on work date. Here is a list of the calculated attributes introduced in the attribute view:
- Month (based on work date)
- Year (based on work date)
- Rows (= 1)
- Entry_dt (date type)
- Approved_dt (date type)
- Work_dt (date type)
- Entry_days (Entry_dt – Work_dt)
- Approval_days (Approved_dt – Entry_dt)
- Time_approval_disc (max over Approval_days)
- Time_writers_disc (max over Entry_days)
Design a Calculation View for Required KPIs
In the calculation view, we aggregated records from the original dataset and calculated all measures needed for the CATS KPIs defined above (Figure 3). To get to the screen shown in Figure 3, follow menu path Systems > HDB (SYSTEM) SAP HANA One > Content > demodata > Calculation Views > CA_CATS.

Figure 3
Create a calculation view CA_CATS
In the aggregation, we keep only attributes that are needed (user name, approver name, department, and month) in the ultimate reports or dashboards. To add these attributes to the aggregation, click the Aggregation object in the middle of the screen (Figure 4). Collect all KPIs used in the dashboards. To do so, right-click your mouse the objects in the middle of the screen and select them for the columns on the right.

Figure 4
Create an aggregation in the calculation view CA_CATS
Here is a list of all columns delivered in the calculation view CA_CATS that are used in creating the dashboard (this list is an output of the aggregation or the calculation view):
- Name
- Approver
- Department
- Month
- Hours_sum
- Rows
- Approved_days
- Entry_days
- Time_approval_disc
- Time_writers_disc
Figure 5 defines a formula for the time approval discipline KPI. To reach this screen, right-click Calculated Columns and select Add new from a list of options in the drop-down context menu. In our example, we define a new Calculated Column in the Calculation View. Check if the APPROVAL date is blank and use today as an approval date for the time approval discipline KPI.
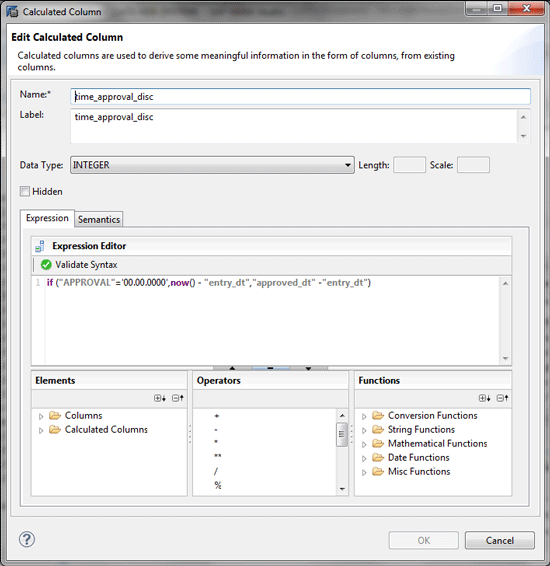
Figure 5
Define a time approval discipline as a calculated column
Connect Lumira to an SAP HANA One Dataset
With SAP HANA One you can easily download the output dataset based on the calculation view CA_CATS to Lumira and use this dataset for defining dashboards (Figure 6). To download this output, launch SAP Lumira. In the menu bar, click File and New. In the pop-up screen, select Download from SAP HANA and click Next. In the next screen (not shown) enter your HANA login credentials.
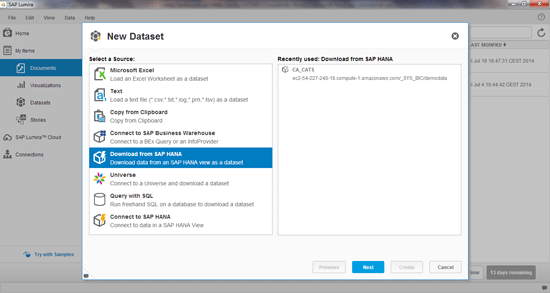
Figure 6
Launch SAP Lumira and create a new dataset
Alternatively, to keep your dashboard data always up to date, you may want to choose the Connect to SAP HANA option instead of Download from SAP HANA. The server name, instance or port, user, and password should be taken from the AWS panel when working with SAP HANA One.
Design Dashboards for Each KPI
It is easy to design dashboards in SAP Lumira based on the existing dataset. Just drag and drop available data elements from the left pane to the appropriate sections on the right (measures, dimensions, or trellis). You can also change the type of chart from the available list and the name of the dashboard.
Time approvers and writers discipline KPIs can be combined in one chart. To complete this task, click the Visualize tab in SAP Lumira (Figure 7). Drag and drop the time approvers and writers discipline KPIs to the Measures section. Click the + in the lower left corner of the screen.
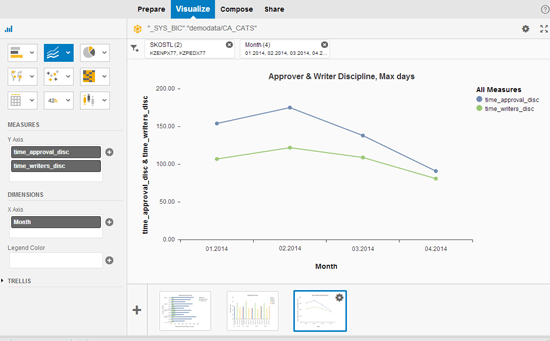
Figure 7
Approver and writer discipline dashboard
In the next screen (Figure 8), you can see a chart to measure average hours reported by department or month.
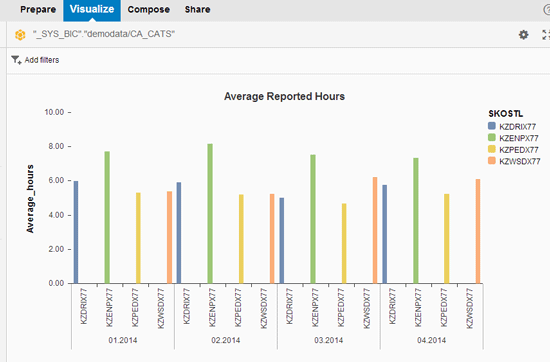
Figure 8
Average Reported Hours dashboard
One more chart can be used for the average approval and entry days KPIs. To create this chart, click the + sign in the lower left corner of the screen. In the screen that appears (Figure 9) drag and drop appropriate measures and dimensions to the dashboard. In Figure 9 the measures are Average approval and Entry days.
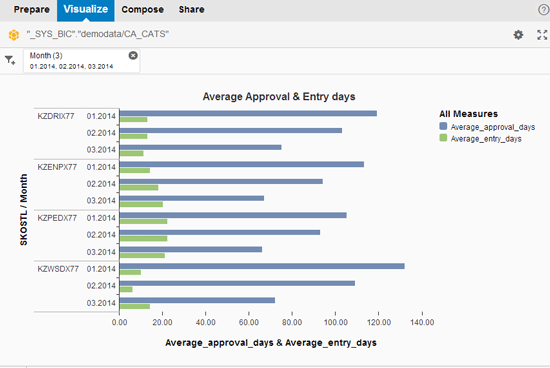
Figure 9
Create Average Approval & Entry days dashboard
Compile a Storyboard, Set Up Filters, Publish
When designing a storyboard (e.g., dragging and dropping dashboards to the storyboard sections), you have to consider which filters are applicable to all dashboards on the storyboard. In our scenario, it is filtered by month. To complete this task, click the Compose tab in SAP Lumira (refer back to Figure 9). Go to the Input Controls folder (not shown) in the lower left section and select the month. Drag and drop the Month object to the filters section on the storyboard (Figure 10).
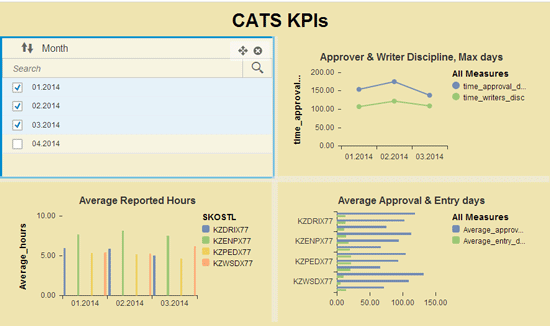
Figure 10
Create a CATS KPIs storyboard
In the last step, you can share the storyboard with other users and publish it to SAP Lumira Cloud, SAP Lumira Server, or to the SAP BI platform. To share a storyboard, click the Share tab in SAP Lumira (refer back to Figure 9). In the screen that appears (Figure 11) click one of the buttons to choose a destination in which to publish your storyboard (Publish to SAP Lumira Cloud, Publish to SAP Lumira Server, or Publish to SAP BI).
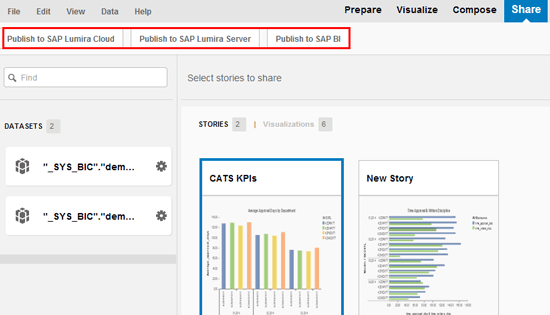
Figure 11
Publish the storyboard
Note
The data used in this article was generated artificially and serves for illustration purposes only. The set of KPIs also represents the most simple scenarios and is based on a number of assumptions. Real business data is likely to require more complex logic for KPI building.
Paulo Vitoriano
Paulo Vitoriano started his consulting career with Arthur Andersen Business Consulting in 1997. Since then, he has helped many global clients on SAP implementation projects, including DHL, Carlsberg, Nestle, Shell, AXA, Electrolux, and Maersk. During the last 18 years he has covered more than 10 end-to-end SAP implementations working on-site in 16 different countries. He has project experience with seven different oil and gas companies, and his current focus is on SAP IS-Oil and system integration.
You may contact the author at pavitoriano@gmail.com.
If you have comments about this article or publication, or would like to submit an article idea, please contact the editor.

Sergei Peleshuk
Sergei Peleshuk has more than 15 years of experience implementing BI technologies for global clients in retail, distribution, fast-moving consumer goods (FMCG), oil, and gas industries. He has helped clients to design robust BI reporting and planning capabilities, leading them through all project phases: from analysis of requirements to building BI roadmaps, technical architecture, and efficient BI teams. Sergei is an expert in modern BI tools and technologies available on the market, including SAP Business Warehouse (SAP BW), SAP HANA, BusinessObjects, and SAP Lumira. Sergei maintains a business intelligence portal at www.biportal.org.
Sergei will be presenting at the upcoming SAPinsider HANA 2017 conference, June 14-16, 2017, in Amsterdam. For information on the event, click
here.
You may contact the author at peleshuk@biportal.org.
If you have comments about this article or publication, or would like to submit an article idea, please contact the editor.